Article
1
A Rapid Extraction Method for Regional-
S
cale
2
Agricultural Disasters Based on Google Earth Engine
3
Zhengrong Liu 1, Huanjun Liu 1,2 , Chong Luo 2, Haoxuan Yang 3,Xiangtian Meng 1, Yongchol Ju 4 ,
4
Dong Guo 2,*
5
1 School of Pubilc Adminstration and Law, Northeast Agricultural University, Harbin 150030, P.R.China;
6
[email protected](Z.L.); [email protected](H.L.); [email protected](X.M.)
7
2 Northeast Institute of Geography and Agroecology Chinese Academy of Sciences, Changchun 130102,
8
China; [email protected]
9
3 College of Surveying and Geo-Informatics, Tongji University, 1239 Siping Road, Shanghai 200092, China;
10
11
4 Wonsan University of Agriculture, Won san city, Kangwon Province; [email protected]
12
* Correspondence: [email protected]; Tel.: +86-1874-519-4393 (D.G.)
13
Abstract: Remote sensing has been used as an important tool for disaster monitoring and disaster
14
scope extraction, especially for the analysis of spatial and temporal disaster patterns of large-scale
15
and long-duration series. Based on the Google Earth Engine cloud platform, this study used MODIS
16
vegetation index products with 250-m spatial resolution synthesized over 16 days from the period
17
2005–2019 to develop a rapid and effective method for monitoring disasters across a wide
18
spatiotemporal range. Three types of disaster monitoring and scope extraction models are proposed:
19
the normalized difference vegetation index (NDVI) median time standardization model (RNDVI_TM(i)),
20
the NDVI median phenology standardization model (RNDVI_AM(i)(j)), and the NDVI median
21
spatiotemporal standardization model (RNDVI_ZM(i)(j)). The optimal disaster extraction threshold for
22
each model in different time phases was determined using Otsu’s method, and the extraction results
23
were verified by medium-resolution images and ground-measured data of the same or quasi-same
24
period. Finally, the disaster scope of cultivated land in Heilongjiang Province from 2010–2019 was
25
extracted, and the spatial and temporal patterns of the disasters were analyzed based on
26
meteorological data. This analysis revealed that the three aforementioned models exhibited high
27
disaster monitoring and range extraction capabilities, with verification accuracies of 97.46%, 96.90%,
28
and 96.67% for RNDVI_TM(i),RNDVI_AM(i),and (j)RNDVI_ZM(i)(j), respectively. The spatial and temporal disaster
29
distributions were found to be consistent with the disasters of the insured plots and the
30
meteorological data across the entire province. Moreover, different monitoring and extraction
31
methods were used for different disasters, among which wind hazard and insect disasters often
32
required a delay of 16 days prior to observation. Each model also displayed various sensitivities and
33
were applicable to different disasters. Compared with other techniques, the proposed method is fast
34
and easy to implement. This new approach can be applied to numerous types of disaster monitoring
35
as well as large-scale agricultural disaster monitoring and can easily be applied to other research
36
areas. This study presents a novel method for large-scale agricultural disaster monitoring.
37
Keywords: Google Earth Engine; MODIS; disaster monitoring; remote sensing index
38
39
1. Introduction
40
Climate impact and environmental change are two important factors that restrict the
41
development of agricultural production. Among them, the impacts of droughts, windstorms, pest
42
infestations, hailstorms, and other agricultural disasters are the most significant. As a result of the
43
global warming trend, the increasing frequency and intensity of various extreme weather events
44
around the world has brought great harm to food security and agricultural development [1]. The
45
traditional agricultural disaster monitoring methods are time-consuming and mainly consist of field
46
investigation and sampling, which are difficult to implement in large areas. Compared with the
47
traditional methods, the use of remote sensing to monitor agricultural disasters has the advantages
48
of continuous spatiotemporal access to high-resolution surface information, fast data acquisition, and
49
a wide range. For these reasons, remote sensing has been widely used in agricultural disaster and
50
vegetation dynamic monitoring, and numerous remote sensing measurement methods have been
51
developed to monitor global vegetation and extreme climate events [2, 3]. The monitoring of
52
agricultural disasters via remote sensing plays an essential role in rapid crop loss assessment, crop
53
condition monitoring, crop insurance, and food security. Therefore, there is an urgent necessity to
54
establish a rapid and large-scale agricultural disaster monitoring method with remote sensing as its
55
technical basis.
56
At present, many agricultural disaster monitoring methods have been proposed, including ground
57
spectral features, remote sensing vegetation indices, and vegetation index time series. Many vegetation
58
indices based on remote sensing parameters, including the normalized difference vegetation index
59
(NDVI), enhanced vegetation index (EVI), normalized difference water index (NDWI), vegetation
60
condition index (VCI), vegetation health index (VHI), disaster vegetation damage index (DVDI), fire
61
weather index (FWI), crop water stress index (CWSI), vegetation supply water index (VSWI), and
62
temperature vegetation dryness index (TVDI), are widely used in disaster monitoring. Furthermore,
63
based on these indices, a daily-scale forest fire danger forecasting system (FFDFS) was developed for
64
drought monitoring, and a fire risk assessment and remote sensing-based flood crop loss assessment
65
service system (RF-CLASS) has been employed to assess crop damage caused by waterlogging [4-10].
66
The VCI has proven to be an effective means of monitoring drought occurrence and measuring the
67
intensity, duration, and impact of droughts around the world. The spatial and temporal ranges of
68
agricultural drought can be studied via the VCI [11], although the correlation between the VCI and the
69
meteorological drought index based on weather station data is not high [12]. The VCI is also not very
70
sensitive to short-term precipitation shortages. In addition, there is significant spatial variability in the
71
relationship strength between the VCI and the meteorological drought index [13]. The VHI is a widely
72
used comprehensive remote sensing drought index whose goal is to improve the VCI in areas with high
73
soil moisture and long-term cloudy conditions [14]. It is also used to evaluate the degree of agricultural
74
drought and extract the spatiotemporal range of drought [15]. However, drought monitoring via the
75
VHI requires the assumption of a negative correlation between the NDVI and land surface temperature
76
(LST). Therefore, the VHI is not applicable in regions and periods where the NDVI-Ts correlation
77
coefficient is non-negative [16]. The TVDI is feasible for large-scale drought monitoring, although it is
78
usually affected by its high sensitivity to clouds. Hence, it should not be used to monitor moderate and
79
severe droughts [17][18][19]. The crop water stress index (CWSI) is widely used as an indicator of crop
80
water status. The short-term oscillations of canopy temperature and vegetative flushing are the main
81
factors that make the CWSI less effective in wet areas, which is its chief limitation [20][21]. The VSWI
82
and TVDI can be used for drought monitoring, but they are not suitable for areas with large elevation
83
changes [22]. Moreover, the CWSI, TVDI, and VSWI exhibit certain lags in drought detection, meaning
84
that they take some time to respond [23]. In view of these lagging vegetation indices, hyperspectral
85
remote sensing technology can be used to monitor winter wheat freezing injury and locust disasters
86
[24][25][26]. The DVDI, which is often used in flood disaster and wind disaster monitoring, has a linear
87
relationship with crop yield reduction and is an effective indicator of the degree of vegetation damage
88
[27][28]. At the same time, the EVI is also frequently utilized to describe vegetation patterns in
89
ecosystems affected by hurricanes, such as tropical rainforests, tropical arid forests, and temperate arid
90
grasslands. The NDVI and EVI, as the most widely used remote sensing indicators, are usually adopted
91
for crop growth monitoring. MODIS NDVI time series can be used to analyze the spatiotemporal
92
evolution of droughts and ENSO events in order to estimate the associated yield loss [29][30][31]. In
93
areas with less vegetation, methods based on the vegetation index have their limitations. For desert
94
locusts, based on the mid-infrared (MIR), near-infrared (NIR), and red reflectance, multi-temporal and
95
multi-spectral image analysis is effective [32]. Corn fields damaged by hail can be effectively identified
by comparing the ΔNDVI before and after the hail from HJ-1 CCD images, although it is difficult to
97
precisely classify the damage [33][34]. Pixel-based time series derived from enhanced vegetation index
98
(EVI) data can be extracted to detect flood disturbances of crop production, but when assessing flood
99
events occurring during crop maturity, the accuracy rate is very low [35]. At the same time, the habitat
100
of Asian locusts can be monitored [36]. Some studies have employed three different remote sensing
101
green indices, namely the normalized vegetation difference index (NDVI), the enhanced vegetation
102
index (EVI), and the green index (GI), to study the damage of frost to the canopy [37]. The above
103
indicators have been widely used to monitor crop growth in specific regions and countries, as well as
104
the entire world. Crop growth monitoring usually uses the NDVI as the main indicator of crop
105
conditions, either by combining the NDVI value with other variables for analysis and utilization, or by
106
calculating the difference between the multi-year average (or selected “reference” year) and the NDVI
107
of that year to monitor the growth of crops [38]. However, this method also has its limitations. First, one
108
needs to obtain multi-year averages for the same crop, which requires that the crop planting structure
109
and distribution remain unchanged. Second, the error of the crop growth fluctuation in the selected
110
reference year will affect the assessment results of that year. In order to avoid the crop distribution
111
changes that lead to information errors, C. Li proposed monitoring the growth of winter wheat based
112
on the percentage of crop NDVI (pNDVI) [39]. Few studies, however, can remove this limitation in
113
terms of phenology. In addition, most research generally focuses on relatively small areas. For example,
114
when monitoring disasters using ground spectral characteristics, the use of visible and near-infrared
115
reflectance spectroscopy is an alternative method for monitoring soil contaminated by heavy metals,
116
although the study area tends to focus on either a particular city or county [40][41]. From the above
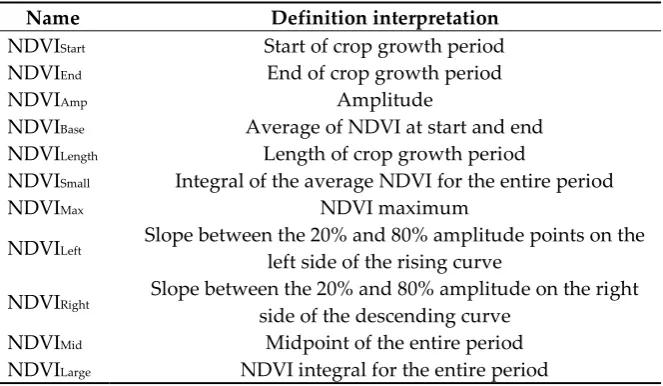
117
research, we determined that the traditional disaster monitoring methods rely on the disaster data
118
collected by surface stations in order to construct indicators based on the data. In addition, the amount
119
of data obtained is limited, and the data are difficult to collect. Moreover, many disaster monitoring
120
methods based on remote sensing exhibit various application shortcomings. Most disaster monitoring
121
research methods are limited by large image data, generally focus on small time scales or small research
122
areas, and their speeds are slow since they lack a fast large-scale disaster discrimination scheme.
123
Therefore, it is difficult to quickly analyze the spatiotemporal disaster pattern in a certain area. Google
124
Earth Engine (GEE) can solve this problem since it can quickly carry out large-scale and long-range
125
disaster monitoring in a long-term sequence analyze the spatiotemporal pattern of the designated area.
126
Google Earth Engine is a cloud platform that stores and processes BP-level global time series satellite
127
images and vector data. Researchers from various countries have used GEE to conduct research in
128
vegetation monitoring, land cover, agricultural applications, disaster management, and Earth science
129
[42][43]. A. Beaton et al. calculated the icebreaking period of a river for flood monitoring using GEE
130
[44]; N. Sazib et al. verified the value of global soil moisture data for drought disaster monitoring using
131
GEE [45]; C. C. Liu et al. developed a flood control and emergency system based on GEE (FPERS) [46];
132
and B. Pradhan et al. used GEE to provide physical support for the assessment of the forest impacts of
133
sand dune risk and hurricanes in the Sabha region of Libya [47]. Based on GEE, L. Lu et al. examined
134
the spatial characteristics of vegetation destruction induced by typhoons in the coastal areas of
135
southeastern China from 2000–2018 [48].
136
In terms of phenology, there have been few studies on large-scale disaster monitoring and disaster
137
range extraction. In addition, most of the research has focused on a single disaster type and has lacked
138
a method for extracting a wide range of disaster types. In GEE, different vegetation indices extracted
139
through multi-temporal remote sensing images are used as standard values to reflect the normal
140
conditions of crop growth in different regions and different growth stages, and they are compared with
141
the vegetation index extracted in a single time phase in order to compare agricultural disasters in the
142
region. The situation is monitored more accurately, thereby making the results universally applicable.
143
It remains difficult, however, to extract the standard value that can represent the average growth of
144
crops. To address this issue, this study introduces the NDVI median time normalization model
145
(RNDVI_TM(i)), the NDVI index median phenology standardization model (RNDVI_AM(i)(j)), and the NDVI
146
median time-space normalization model (RNDVI_ZM(i)(j)), which comprehensively consider the effects of
147
phenology, different disasters and crop types, and changes in planting structure, with the goal of
proposing a large-scale GEE-based monitoring method for the rapid extraction of agricultural disasters.
149
We attempted to utilize the MODIS 16-day NDVI time series data after smooth reconstruction and
150
compare and analyze the regional-scale disaster index analysis map generated by the three models.
151
Additionally, we planned to extract the disaster threshold of the study area using Otsu’s method and
152
compare it with HJ-1A/B CCD data in order to analyze the spatial and temporal distributions of
153
disasters in Heilongjiang Province from 2000–2019. This method features good transferability and can
154
be quickly applied in other areas.
155
2. Materials and Methods
156
2.1. Study area
157
Located between latitude 43°25'–53°33'N and longitude 121°11'–135°05'E, Heilongjiang Province
158
straddles three humidity zones from east to west. The total land area of the province is approximately
159
473,000 km2, of which agricultural land accounts for ~39.5045 million hectares. In terms of elevation, it
160
is high in the northwest, north, and southeast, and low in northeast and southwest. Heilongjiang
161
Province is located in the eastern part of Eurasia to the west of the Pacific Ocean, and experiences a
162
temperate continental climate. The average annual temperature in the province generally ranges from
163
-5°C to 5°C, and its annual precipitation varies from 400 to 650 mm, with uneven spatial and temporal
164
distributions. Agricultural disasters are frequent, and the frequencies of the representative disasters of
165
droughts, floods, windstorms, hailstorms, low temperatures, and freezing, as well as disease and insect
166
disasters, are increasing [49][50].
167
168
Figure 1. Cultivated land in Heilongjiang Province
169
2.2. Data
170
2.2.1. MOD13Q1
171
The MODIS vegetation index (MOD13Q1) synthesized over 16 days with a 250-m spatial
172
resolution that was used in the study area is a terrestrial data product, whose complete and formal
173
designation is the MODIS/Terra Vegetation Indices 16-day L3 Global 250-m SIN Grid. This product is
174
calculated by the atmospheric correction of bidirectional surface reflectance and possesses the
175
advantages of moderate spatial resolution, high temporal resolution, high spectral resolution, wide
176
observation range, and low cost.
2.2.2. HJ-1A/B
179
The verification data for the disaster monitoring in this study were the HJ-1A/B data with a 30-m
180
spatial resolution from the environmental disaster mitigation satellite. The Chinese HJ-1A/B satellite
181
makes synchronous ground observations, the charge-coupled device (CCD) sensor captures the ground
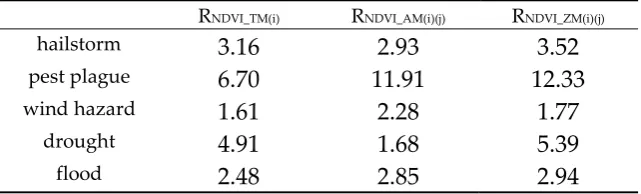
182
features with a 30-m pixel resolution at a minimum angle, and four bands cover the visible light and
183
near-infrared wavelength ranges. Each satellite has two CCD sensors, and the constellation consisting
184
of two satellites forms an observation network covering China and its surrounding areas, featuring
185
large-scale, all-weather, all-day, dynamic environmental and disaster monitoring capabilities. In
186
addition, it was combined with the crop insurance plots from 2011–2019 in order to determine disaster
187
scope via visual interpretation. Insurance company personnel carried out field verification on 80% of
188
the plots, and the accuracy was determined to be > 95%. These data were used to validate the extraction
189
extent of the disasters in this study.
190
2.2.3. Meteorological data
191
The spatial and temporal distribution characteristics of agricultural disasters in Heilongjiang
192
Province and its prefecture-level cities from 2010–2019 were analyzed based on the precipitation,
193
temperature, humidity, and sunshine duration meteorological data gathered by the Heilongjiang
194
Provincial Bureau of Statistics (http://www.hlj.stats.gov.cn/) and the China Meteorological Disaster
195
Yearbook.
196
2.2.4. Cultivated land range data
197
In this study, in order to avoid the influence of other land types and to conduct phenological
198
zoning for the construction of the disaster monitoring model, the disaster monitoring and extraction for
199
the cultivated land was performed using the land range extracted from the global 30-m land cover data.
200
The land use classification data were from the Northeast Institute of Geography and Agroecology of
201
Chinese Academy of Sciences, which used 2014 land samples. Taking the CCD images from the China
202
Resources No. 1 satellite and the Landsat remote sensing images as the main data sources, and adopting
203
the manual visual interpretation method, we obtained the cultivated land range, as shown in Figure 1.
204
2.3. Method
205
2.3.1. Data preprocessing
206
Here, the MOD13Q1 reflectivity product was used to construct the model based on Google Earth
207
Engine. GEE contains over 200 public datasets and more than 5 million images, and is increasing at a
208
rate of approximately 4,000 images per day. Images uploaded into Google Earth Engine are
209
preprocessed. In GEE, the MOD13Q1 NDVI products are calculated based on atmosphere-corrected
210
bidirectional surface reflectance, which is shielded against water, clouds, heavy aerosols, and cloud
211
shadows. We selected the good data and marginal data from the SummaryQA in order to remove the
212
impact of clouds and snow and ensure that the extracted disaster scope was not affected by outliers.
213
2.3.2. Phenological remote sensing zoning method
214
In terms of the remote sensing image processing, 23 MODIS (MOD13Q1) remote sensing data
215
with a spatial resolution of 250 m synthesized over 16 days in 2014 were employed to extract 11 crop
216
phenological features, and the multi-phase NDVI time series was smoothly reconstructed using
217
Savitzky-Golay filtering. The dynamic threshold method was utilized to extract the key phenological
218
values, and the intervention of different vegetation types and soil background values were
219
eliminated. Based on the time series changes of the NDVI curve, the beginning of the crop growth
220
period was defined as the sharp rise of the NDVI curve on the left side, i.e., the time when the
221
increasing range was 20% of the overall increase. At the same time, the end of the crop growth period
222
was defined as the sharp decrease of the NDVI curve, i.e., the time when the decreasing range was
223
20% of the overall increase. The 11 extracted phenological characteristic parameters are listed in Table
1. The regions with similar phenological values were categorized as a single study area, and
225
multiscale segmentation was carried out on the cultivated land. Via this method, different crops with
226
various geographical distributions and growth conditions were divided into different agricultural
227
phenological zones. It was required that the laws of zonality and non-zonality for phenological
228
distribution as well as the principle of crop similarity and difference be followed, and certain zoning
229
methods were adopted in order to divide a region into units of different grades, with clear differences
230
in crop growth. Pursuant to the method described above, Heilongjiang Province was divided into 39
231
phenological areas [51].
232
Table 1. Definition of phenological parameters in remote sensing
233
Name Definition interpretation
NDVIStart Start of crop growth period
NDVIEnd End of crop growth period
NDVIAmp Amplitude
NDVIBase Average of NDVI at start and end
NDVILength Length of crop growth period
NDVISmall Integral of the average NDVI for the entire period
NDVIMax NDVI maximum
NDVILeft Slope between the 20% and 80% amplitude points on the
left side of the rising curve
NDVIRight Slope between the 20% and 80% amplitude on the right
side of the descending curve
NDVIMid Midpoint of the entire period
NDVILarge NDVI integral for the entire period
234
2.3.3. Construction of three disaster monitoring models
235
Certain differences exist in Heilongjiang Province: the phenological periods and cultivated land
236
planting structures, the vegetation indices of crops growing at the same time but in different areas,
237
and the vegetation indices of different crops. Therefore, the results of disaster range recognition and
238
extraction based directly on the NDVI value difference of a certain phase are not precise and not
239
universal. For this situation, the following three models were proposed and calculated in GEE:
240
The RNDVI_TM(i) model with normalized difference median vegetation index time:
241
242
𝑅
_ ( )=
( ) ( )( )
× 100%
(1)
243
244
where RNDVI_TM(i)represents the time standardization value of the NDVI(i) of the ith time phase in a
245
certain year, NDVI(i) is the NDVI value of the ith time phase in a certain year, and NDVITMED(i) is the NDVI
246
value of the ith time phase for five consecutive years. The smaller the RNDVI_TM(i) value, the less the
247
vegetation grows. Five years was selected as the time scale because longer time scales are susceptible
248
to management decisions such as dryland diversion, crop rotation, and changes of planting structure.
249
Meanwhile, shorter time scales cannot reflect the time trend, and are prone to the influence of individual
250
annual outliers.
251
252
The RNDVI_AM(i)(j) model of phenology standardization of the median value of the normalized
253
difference vegetation index is:
254
𝑅
_ ( )( )=
( ) ( )( )( )( )
× 100%
(2)
256
where RNDVI_AM(i)(j) is the phenological standardization value of the median NDVI(i)in the jth
257
phenological region of the ith phase in a certain year, NDVI(i) Is the NDVI value of the ith phase in a certain
258
year, and NDVIAMED(i)(j) is the median value of the NDVI region in the jth phenological region of the ith
259
phase in a certain year. The smaller the RNDVI_AM(i)(j) value, the worse the vegetation grows.
260
261
The RNDVI_ZM(i)(j) model is based on an improvement of Eqs. (1) and (2). Given that the median value
262
curve of the NDVI region for the same phenological area in different years may be affected by the
263
change of crop planting structure and other factors, the median NDVI values extracted at the same time
264
in different years can exhibit great differences. Therefore, the regional median of the phase NDVI of
265
phase I for five consecutive years is proposed as an alternative.
266
267
𝑅
_ ( )( )=
( ) ( )( )( )( )
× 100%
(3)
268
269
where RNDVI_ZM(i)(j) is the spatiotemporal standardization value of the median NDVI(i)in the jth
270
phenological region of the ith phase in a certain year, NDVI(i)is the NDVI value of the ith phase in a certain
271
year, and NDVIZMED(i)(j) is the standardized median value of the NDVI in the jth phenological region of
272
the ith phase for five consecutive years. The smaller the RNDVI_ZM(i)(j) value, the less the vegetation grows.
273
2.3.4. Determination of threshold value
274
Table 2. Phenological period of main crops in Heilongjiang Province
275
Crop species Crop phenology (10 days/month)
Rice Sowing and seedling raising Mid-April–mid-May
Transplanting and rejuvenation Late May–early June
Tillering Mid June– mid-July
Booting and tasseling Late
July–mid-August
Milk Late August–
early September
Mature Mid-September–
late September
Corn Seed and emergence Late April–early May
Seedling Mid-May–mid-June
Jointing Late June–
mid-July
Emasculation Late July–early
August
Milk Mid-August–
early September
Mature Mid-September–
late September
Soybean Seed and emergence Early May–late May Early June–late June Third Leaf Parabranching Late June
Flowering Early July–mid
July
Podding Mid-August–
early September
Mature Mid-September–
late September
276
From mid-April to early June, crops in Heilongjiang Province are in the seeding stage and seedling
277
stage, during which the crop coverage is low and the NDVI value is small, and thus images are easily
278
susceptible to the soil background value. Therefore, this study began extracting the disaster scope from
279
the day-of-year (DOY) 177 time phase. In mid-September, precocity occurs in some crops, so the disaster
280
area cannot be directly extracted on DOY 273. In this study, images between DOY 161 and DOY 257
281
were selected. A total of 113 typical disasters reported by insurance companies from 2011–2019 were
282
chosen as sample data. Otsu’s method was employed to determine the appropriate threshold value for
283
extracting the disaster scope and verifying its universal applicability via the GEE monitoring model.
284
We adopted the average value without the extreme outliers as the threshold in order to distinguish
between disasters and non-disasters and calculated the proportions of the MODIS image extraction
286
results and the insured plots to obtain the corresponding error size and verify its accuracy.
287
2.3.5. Disaster extraction
288
When crops suffer from disasters, the values of RNDVI_TM(i), RNDVI_AM(i)(j), and RNDVI_ZM(i)(j)are slightly
289
lower than their normal levels. Therefore, when the standardized value of a certain regional model
290
was found to be less than a threshold value, the crop was identified as being affected by a disaster.
291
The smaller the values of RNDVI_TM(i), RNDVI_AM(i)(j), and RNDVI_ZM(i)(j), the more severe the damage. Thus,
292
this study analyzed the RNDVI_TM(i), RNDVI_AM(i)(j), and RNDVI_AM(i)(j) values in Heilongjiang Province from
293
2010–2019 in accordance with the time sequence. The average value extracted using Otsu’s method
294
was taken as the threshold value, and the disaster scope was extracted from the corresponding remote
295
sensing disaster monitoring model via the determined threshold values of each time phase. Given
296
the spatial resolution of the MODIS data and the need to remove small patches after the extraction of
297
agricultural disasters, the disaster areas covering < 6 pixels (approximately 40 hectares) were
298
eliminated in order to obtain the agricultural disaster scope of Heilongjiang Province from 2010–2019.
299
2.3.6. Accuracy verification
300
In order to test the accuracy of the scope of the disasters extracted by the three types of disaster
301
monitoring models, and selecting the DOY 285 fact-finding disasters from 2010–2019 as the validation
302
sample, this study used the MODIS data close to the moderate resolution of the HJ-1A/1B CCD image
303
NDVI value from the calculation of the wave band operation and combined this with the data
304
reported by the insurance company, the changes of the NDVI value in the affected area, and the
305
affected area and disaster scope extracted from the field data of the agricultural disaster as the
306
validation data. With a spatial resolution of 30 m, the HJ-1A/B extracts the disaster scope whose
307
precision is higher than the actual sampling results. Therefore, the disaster range extracted by this
308
image was taken as the truth value to verify the accuracy of the extracted disaster range by the MODIS
309
image.
310
We took Absolute error =| Extract value – True value |, i.e., the Absolute value between the
311
disaster result extracted from the MODIS data and the disaster result extracted from HJ-1A/B, as the
312
accuracy evaluation parameter. Finally, the errors of 285 verification samples for the different models
313
were calculated as the average values of the accuracy test.
314
3. Results
315
3.1. Phenological division of cultivated land
316
The purpose of utilizing the key phenological values as the basis of zoning in Heilongjiang
317
Province was to combine the regions with similar phenological values into a single study region, then
318
conduct multiscale segmentation within the cultivated land. After conducting numerous experiments
319
and using the average segmentation evaluation index (ASEI) for calculation and analysis, we
320
discovered that the ASEI value reached its maximum when the optimal segmentation scale was 70.
321
The 39 phenological regions that were ultimately obtained are shown in Figure 2. After the cultivated
322
land was categorized into regions according to its phenological values, the median values of the
323
different phenological regions were extracted from the processed images in GEE as NDVIAMED(i)(j) and
324
NDVIZMED(i)(j), and RNDVI_AM(i)(j) and RNDVI_ZM(i)(j) were then calculated.
326
Figure 2. Phenological zones in Heilongjiang Province
327
3.2. Precision analysis
328
We used Otsu method to extract the threshold value of DOY 113 sample points of different
329
disaster types on GEE. From Table 3, we find that in the three models, the threshold size is mainly
330
distributed between -0.1 ~-0.2. The thresholds extracted from different disaster types and by different
331
models are different. The error in the table is received based on the difference between the proportion
332
of disaster results extracted by HJ-1A/B provided by the insurance company and the proportion of
333
disaster results extracted by MODIS image. Among them, the errors of insect and wind disasters are
334
larger. At the same time, we extracted the threshold value of insect and wind disasters after 16 days
335
and conducted precision analysis. It was found that the errors of the results of these two disasters
336
were smaller and the accuracy was higher through images observed after 16 days. Therefore, we used
337
the images of 16 days later to calculate the threshold value of insect and wind disasters. The errors of
338
hailstorm, drought disaster and flood disaster are small, so The MODIS image which is close to the
339
time of disaster is used to calculate the disaster threshold for disaster monitoring.
340
341
Table 3. Otsu extraction disaster threshold and disaster error analysis example
342
Model Definition interpretation
Proportion of HJ-1A/b monitoring
results in the insured land(%)
Threshold
Proportion of MODIS monitoring
results in the insured land(%)
Error(%)
RNDVI_TM(i) 20170803Youyi hailstorm 1.31 -0.15 1.39 0.08
20160813Longjiang drought 0.47 -0.14 0.57 0.10
20170802Fuyuan flood 0.17 -0.08 0.30 0.13
20180703Zhaodong flood 13.14 -0.11 12.71 0.44
20120702Maqiaohe hailstorm 84.82 -0.14 85.50 0.68
20160702Hailstormun hailstorm 4.60 -0.15 3.88 0.73
20160829Gannan drought 1.47 -0.16 0.66 0.82
2018080Luobei wind hazard 2.47 -0.16 0.25 2.22
20170901Beian wind hazard 16.63 -0.10 35.04 18.41
RNDVI_AM(i)(j)
20170803Youyi hailstorm 6.87 -0.10 10.96 4.09
20180703Tonghe flood 2.27 -0.14 3.21 0.94
20160813Longjiang drought 21.68 -0.14 25.74 4.06
20170802Fuyuan flood 0.87 -0.17 0.77 0.10
20180703Zhaodong flood 23.19 -0.14 19.32 3.88
20120702Maqiaohe hailstorm 84.82 -0.17 89.06 4.24
20160702Hailstormun hailstorm 54.57 -0.18 30.62 23.95
20160829Gannan drought 1.47 -0.15 2.43 0.95
2018080Luobei wind hazard 2.47 -0.15 0.63 1.84
RNDVI_ZM(i)(j)
20170803Youyi hailstorm 38.41 -0.13 51.15 12.73
20180703Tonghe flood 6.87 -0.15 8.22 1.35
20160813Longjiang drought 2.27 -0.14 1.79 0.48
20170802Fuyuan flood 41.16 -0.14 63.13 21.98
20180703Zhaodong flood 0.87 -0.13 0.97 0.10
20120702Maqiaohe hailstorm 13.14 -0.11 17.28 4.14
20160702Hailstormun hailstorm 84.82 -0.16 91.64 6.82
20160829Gannan drought 36.25 -0.16 36.43 0.18
2018080Luobei wind hazard 3.01 -0.16 3.74 0.73
20170901Beian wind hazard 2.47 -0.18 0.47 1.99
343
344
After removing the extreme values from the thresholds of the different phases in the three
345
monitoring models, the mean value was taken as the threshold value of the time phase. The sizes and
346
errors of the average thresholds are listed in Table 4 Generally speaking, as time increased, the
347
threshold values increased, indicating that the disasters across the entire province exhibited a gradual
348
decreasing trend during the crop growth period. In addition, the difference of the threshold value
349
between the RNDVI_AM(i)(j) and RNDVI_ZM(i)(j) models for the same time phase was small, implying that the
350
extraction disaster scopes may have been similar. At the same time, as shown in Tables 5 and 6, based
351
on either the environmental star monitoring results or the MODIS monitoring results, the proportion
352
of hailstorms was the highest, which as followed by drought and flood disasters. Windstorms and
353
insect disasters often accounted for a small proportion of monitoring results in the insured land, i.e.,
354
the disaster areas resulting from these events were small. On DOY 209, the relatively large average
355
error may have led to the large error of the disaster area extracted during this period. Having selected
356
the DOY 285 samples to test the accuracy of the three monitoring models, our calculations revealed
357
that the average precision values of the RNDVI_TM(i), RNDVI_AM(i)(j), and RNDVI_ZM(i)(j) monitoring models were
358
97.46%, 96.90%, and 96.67%, respectively. In Table 6, the average errors of droughts, windstorms,
hailstorms, and floods were smaller and their accuracy values were higher, while the average error
360
of insect infestation was larger and its accuracy was lower.
361
Table 4. Mean thresholds and error analysis of each phase
362
Model DOY Threshold Average error (%)
RNDVI_TM(i)
177 -0.13 2.90
193 -0.16 7.78
209 -0.15 6.29
225 -0.15 4.22
241 -0.13 4.58
257 -0.14 2.83
RNDVI_AM(i)(j)
177 -0.15 5.89
193 -0.15 3.70
209 -0.15 7.51
225 -0.13 4.99
241 -0.13 5.11
257 -0.13 7.08
RNDVI_ZM(i)(j)
177 -0.16 5.27
193 -0.16 4.32
209 -0.15 7.44
225 -0.13 5.31
241 -0.15 3.16
257 -0.13 4.06
363
364
365
Table 5. Comparison sample table of the accuracy test of MODIS data disaster range extraction based on
HJ-366
1A/B CCD image
367
368
Model Definition interpretation
Proportion of HJ-1A/b monitoring results in
the insured land(%)
Threshold
Proportion of MODIS monitoring
results in the insured land(%)
Error (%)
RNDVI_TM(i)
20180801Tongjiang flood 7.08 -0.15 8.44 1.36
20180803Tonghe wind hazard 3.41 -0.15 3.61 0.20
20180803Suiling wind hazard 2.62 -0.15 1.79 0.83
20160829Nehe drought 5.60 -0.13 0.86 4.73
20120914Hulan Insect 20.36 -0.14 20.90 0.54
20120829Wuchang Insect 8.79 -0.13 0.14 8.65
2017090Nenjiang flood 12.35 -0.14 16.77 4.42
20180901Zhaodong hailstorm 51.82 -0.14 58.66 6.84
20190907Nehe flood 22.34 -0.14 28.85 6.51
RNDVI_AM(i)(j)
20180801Tongjiang flood 4.10 -0.13 4.28 0.18
20180803Tonghe wind hazard 8.55 -0.13 10.98 2.43
20180803Suiling wind hazard 2.62 -0.13 3.22 0.60
20160829Nehe drought 1.92 -0.13 1.06 0.86
20120914Hulan Insect 20.36 -0.13 4.64 15.72
20120829Wuchang Insect 8.79 -0.13 0.69 8.11
20170901Nenjiang flood 6.94 -0.13 13.73 6.79
20180901Zhaodong hailstorm 67.07 -0.13 70.06 2.98
20180901Hailun hailstorm 80.72 -0.13 92.93 12.21
20190907Nehe flood 50.25 -0.13 48.16 2.09
RNDVI_ZM(i)(j)
20180801Tongjiang flood 4.10 -0.13 4.73 0.63
20180803Tonghe wind hazard 8.55 -0.13 10.98 2.43
20180803Suiling wind hazard 2.62 -0.13 3.22 0.60
20160829Nehe drought 1.92 -0.13 1.18 0.74
20120914Hulan Insect 20.36 -0.13 1.80 18.55
20120829Wuchang Insect 8.79 -0.13 12.41 3.62
20170901Nenjiang flood 6.94 -0.13 8.53 1.58
20180901Zhaodong hailstorm 67.07 -0.13 62.44 4.63
20180901Hailun hailstorm 80.72 -0.13 91.63 10.90
20190907Nehe flood 50.25 -0.13 42.80 7.45
369
Table 6. Average errors of the three monitoring models for different disasters (%)
370
RNDVI_TM(i) RNDVI_AM(i)(j) RNDVI_ZM(i)(j)
hailstorm
3.16
2.93
3.52
pest plague
6.70
11.91
12.33
wind hazard
1.61
2.28
1.77
drought
4.91
1.68
5.39
flood
2.48
2.85
2.94
371
3.3. Consistency analysis of applicability and extraction scope of different models
372
Based on the thresholds of the different time phases listed in Table 4, the typical disasters verified
373
by the HJ-1A/B monitoring range and the disaster scope of Heilongjiang Province from 2010–2019
374
were extracted. These results are presented in Figures 4 and 5.
375
As shown in Table 6, the average errors of the hailstorm and wind disasters extracted by the
376
RNDVI_TM(i) and RNDVI_ZM(i)(j) models were relatively small, and the disaster extraction ranges of these
377
models for the actual observations shown in Figure 5 were similar. The average flood disaster errors
378
extracted by the RNDVI_AM(i)(j) and RNDVI_ZM(i)(j) were small, and the disaster extraction ranges of these
379
models for the actual observations were similar. In terms of drought, however, although the error
380
difference between the RNDVI_TM(i) and RNDVI_ZM(i)(j) was smaller, the disaster range extracted by the
381
RNDVI_AM(i)(j) was similar to that extracted by the RNDVI_ZM(i)(j) for the actual observations.
382
The crops ripen once a year in Heilongjiang Province, although the three models monitored and
384
extracted the disaster areas from mid-June to mid-September with little difference. It can be seen from
385
Table 7 that the three monitoring models exhibited similar ratios of phase disaster range to the
386
cultivated land range across the entire province during the period DOY 177–DOY 225, among which
387
the RNDVI_TM(i) and RNDVI_ZM(i)(j) displayed a small difference in this ratio on DOY 177. Figure 4 shows
388
that their extracted disaster ranges were also relatively close. For the DOY 193–DOY 209 phases, there
389
was a small difference between the RNDVI_AM(i)(j) and RNDVI_ZM(i)(j) in the disaster scope proportion of the
390
cultivated land across the entire province, and the disaster scopes extracted in Figure 4 were more
391
consistent. In the phase from DOY 241–DOY 257, the RNDVI_TM(i) and the other two monitoring models
392
indicated that the extracted disaster range accounted for a larger percentage of the total cultivated
393
land area in the province, and the extracted disaster range exhibited a larger difference. The main
394
reason for this finding is that from DOY 241–DOY 257, the RNDVI_AM(i)(j) and RNDVI_ZM(i)(j) were more
395
sensitive to waterlogging, resulting in a larger monitored range.
396
397
Table 7. Ratio of 2017 disaster scope to cultivated land area in Heilongjiang Province (%)
398
RNDVI_TM(i) RNDVI_AM(i)(j) RNDVI_ZM(i)(j)
177
11.29
14.17
11.83
193
8.04
7.22
6.78
209
6.03
4.41
4.06
225
3.17
4.38
3.97
241
5.96
10.30
11.58
257
11.43
18.59
16.85
399
3.4. Analysis of spatiotemporal patterns of disasters in the study area
400
3.4.1. Spatial and temporal pattern analysis of 2017 disasters in Heilongjiang Province
401
402
Figure 4. 2017 disaster distribution maps of Heilongjiang Province for the three monitoring models
403
After extracting the disaster area of Heilongjiang Province using the threshold values of different
404
time phases, the spatial and temporal distributions of disasters in Heilongjiang Province over the past
405
10 years could then be analyzed in combination with the corresponding meteorological data. Taking
406
2017 as an example, as shown in Figure 4, disasters in June were concentrated in the western and
407
southeastern regions. Longjiang County and Tailai County had little rain over the years, and drought
408
occurred frequently. In early July, the crop situation improved, although serious disasters still
occurred in southern areas such as Wuchang due to heavy rain, as well as in Keshan County, Nehe,
410
and other areas. In late July, the crops grew well, and the disasters were concentrated in the western
411
and northwestern areas of Heilongjiang Province, while the southeastern area of Fuyu County had a
412
low vegetation index for the entire month of July, and disasters occurred. In mid-August, the
413
vegetation growth in the Jiamusi and Suihua areas was poor, and the trend worsened in early
414
September.
415
In terms of the spatial and temporal distribution trends of disasters, based on distribution
416
consistency, the time period DOY 177–DOY 193 was labeled time period 1, and DOY 193–DOY 209,
417
DOY 209–DOY 225, DOY 225–DOY 257 was designated period 2, 3, and 4, respectively. The time
418
variation characteristics of the provincial disasters revealed that the disaster area exhibited a
419
downward trend from period 1 to period 2, and this trend continued to period 3, when it reached its
420
minimum. Entering period 4, however, the disaster area increased rapidly, which was consistent with
421
the disaster area change of the insured land across the entire province. In period 1, the disasters were
422
mainly distributed in the west and south, among which Qiqihar, Heihe, Daqing, Mudanjiang, Anda,
423
and Wudalianchi were severely affected, and the level of severity gradually decreased with time.
424
During the second period, agricultural disasters were mainly concentrated in Qiqihar, Heihe (the
425
Aihui District, Nenjiang County, Xunke County, Sunwu County, and Wudalianchi), Suihua, Nehe,
426
and other locations, all of which were severely impacted. In the third period, the disasters mainly
427
occurred in the west, south, and central portions of Heilongjiang Province. Qiqihar and Heihe were
428
still the most affected areas; Jixi, Jiamusi, and Suihua were clearly stricken; and Duerbert, Zhaozhou,
429
and Acheng also suffered severely. During period 4, crops in many areas had already entered the
430
harvest season by late August and early September, particularly rice, which is grown widely in the
431
Sanjiang region of the Jiamusi belt, leading to a significant increase of disaster area in the Kiamusze
432
region, as seen in Figure 4. This gave the impression that agricultural disasters in Heilongjiang
433
Province were concentrated in the northeast. In summary, the 2017 agricultural disasters in
434
Heilongjiang Province were mainly concentrated in the northeast, south, west, and central regions.
435
436
3.4.2. Spatial and temporal disaster pattern analysis of different phases in the study area from 2010
437
to 2019
438
(a) (b)
439
440
(c) (d)
(e) (f)
Figure 5. Disaster distribution maps of Heilongjiang Province during different phases from 2010–2019: (a) DOY
442
177, (b) DOY 193, (c) DOY 209, (d) DOY 225, (e) DOY 241, and (f) DOY 257
443
444
Comparing the same time phase images of different years allows a deeper analysis of the spatial
445
and temporal pattern distributions of disasters.
446
The analysis of the disaster range and meteorological data over the 10-year study period
447
revealed that on DOY 177 in 2010, 2011, 2012, 2016, and 2017 a large range of disasters occurred. In
448
2010, Heilongjiang Province continued to experience low temperatures in the winter and spring. The
449
weather warmed late and the soil defrosted slowly. In May, precipitation was unusually heavy,
450
leading to late field seeding. Therefore, the bare soil area was extensive, resulting in the large 2010
451
disaster scope shown in Figure 5(a). Severe convective weather generated a hailstorm in the Beilin
452
District of Suihua, Hailun, Lanxi County, Qingan County, Suiangxian County, and the Hulan District
453
of Harbin. The actual range of the hailstorm was consistent with the ranges extracted from the three
454
models. Due to the sustained high temperatures and sparse rainfall from late May through June, parts
455
of the Songnen Plain, the northern forest region, the northern Sanjiang Plain, and Mudanjiang
456
experienced drought conditions. The drought-stricken areas were mainly distributed in the Greater
457
Hinggan Mountains and the Mudan River region. In the Mudan River region, the three monitoring
models were consistent. In the forest regions, however, the RNDVI_AM(i)(j) and RNDVI_ZM(i)(j) were more
459
sensitive to drought monitoring, resulting in more extensive drought extraction in the northern areas.
460
In June 2011, rainstorm and flood disasters occurred in Heilongjiang Province, severely impacting
461
Fujin, Qiqihar, and other areas. In addition, hailstorms occurred in many locations. Figure 5(a) reveals
462
that the disaster area extracted in 2011 was concentrated in the western and northeastern sections of
463
Heilongjiang Province, which was consistent with the meteorological data. In June 2012, precipitation
464
in the eastern part of Harbin and the Sanjiang Plain continued to be low, eventually resulting in
465
drought. Shuangyashan, Baoqing, Wuchang, Tonghe, Fangzheng, and other counties suffered from
466
severe drought. A hailstorm occurred in Qiqihar Mountain County. In Figure 5(a), the disaster areas
467
extracted in 2012 were concentrated in the eastern and western sections of Heilongjiang Province,
468
and the extraction of drought areas was good. In June 2014, strong convective weather occurred in
469
some areas of Heilongjiang Province. Windstorms and hailstorms occurred with high frequency,
470
impacting a wide area and resulting in severe losses. The extraction process revealed that the
471
disasters were concentrated in the Jiamusi area, which is in the southern part of the province, and
472
Suihua, which is in the western part. In June 2015, strong convective weather occurred in
473
Heilongjiang Province, with a high frequency of hailstorms. The extracted disasters were
474
concentrated in the northwestern, northeastern, and southern sections of Heilongjiang Province. In
475
June 2016, there was a large amount of precipitation in the province, with heavy rain concentrated in
476
most of the Songnen Plain and the northern portion of the Sanjiang Plain. Yanshou County and other
477
areas suffered from severe waterlogging due to the heavy rainfall, and this meteorological disaster
478
was consistent with the extracted disaster in this county. In mid-June 2017, rainstorms and floods
479
occurred frequently, and waterlogging was severe in Nehe and other locations, which was consistent
480
with the monitoring results.
481
During the time phase DOY 193–DOY 209, the disasters occurring in 2012, 2015, 2016, and 2017
482
were relatively serious. In 2010, the average rainfall of Heilongjiang Province in this phase was higher
483
than the average of a normal year. The rainstorms and floods in July damaged 221,000 hectares of
484
crops. Figure 5(b) shows that in 2010 floods mainly occurred in Heihe, Suihua, and Harbin. From
485
May to mid-July 2012, rainfall in the eastern part of Harbin and the Sanjiang Plain continued to be
486
low, causing moderate meteorological drought, including severe drought in the Shuangyashan urban
487
area, as well as Baoqing, Fuchang, Tonghe, Fangzheng, and other counties. At the end of July, Daqing
488
and many other cities suffered from severe flooding and waterlogging disasters, which was
489
consistent with the disaster extraction range. In addition, there were mild disasters in the central and
490
northern regions of the extraction range. In July 2013, heavy rainfall occurred in Heilongjiang
491
Province, causing regional floods along the Heilongjiang, Nenjiang, and Songhua rivers. The disaster
492
distribution map clearly shows that greater waterlogging occurred along these rivers. Strong
493
convective weather was observed in some areas of Heilongjiang Province. At the end of July,
494
hailstones pummeled the Beilin District of Suihua, which was consistent with the extracted disaster
495
area. In July 2014, Jiamusi was hit by severe hailstorms, which was also consistent with the extracted
496
disaster scope. Meanwhile, according to the extracted disaster map, the entire province was flooded
497
and waterlogging was serious during this period. In 2015, Heilongjiang Province witnessed frequent
498
rainstorms and floods, and severe convective weather occurred in many areas. For example, the
499
Hulan District of Harbin was hit by tornadoes and hail. In mid-July, Hulin experienced a rainstorm,
500
which matched to the disaster area extracted on DOY 209. In addition, there were a few disasters in
501
the northeastern portion of Heilongjiang Province. In July 2016, the continuous high temperatures
502
and low rainfall in the province led to a drought on the western Songnen Plain in mid-July.
503
Rainstorms and floods occurred frequently, especially in late July, mainly in most sections of the
504
Songnen Plain and the northern Sanjiang Plain. These events were all consistent with the extraction
505
disaster scope. In addition, there was a small disaster in the northwestern part of the province on
506
DOY 209. In July 2017, the average temperatures were excessive, causing most of the Songnen Plain
507
to be arid. In the middle of the year, the western region suffered from a continuous drought due to
508
insufficient precipitation. By the end of July, Duerbert, Zhaozhou, Zhaoyuan, and Acheng were
509
experiencing drought conditions as well. Heavy rain and floods occurred frequently in mid- and late
July. In addition to tornadoes in Suihua, short-term heavy rain, strong winds, and hail battered the
511
Aihui District of Heihe, Nenjiang County, Xunke County, Sunwu County, and Wulianchi. It can be
512
seen from the disaster distribution map that the disasters in western China were more serious while
513
the disasters in Heihe were relatively mild.
514
During the time phase DOY 225–DOY 241, disasters occurred in 2011, 2015, 2016, and 2017, and
515
were relatively serious. In August 2010, heavy rains and floods developed frequently in Qiqihar and
516
Hegang. In the provincial distribution map extracted on DOY 225, in addition to the above disasters
517
consistent with the meteorological data, a large range of disasters were found in the eastern and
518
northeastern sections of Heilongjiang Province. By the end of August 2011, a severe meteorological
519
drought had developed in the eastern region, mainly in Mudanjiang, Harbin, Shuangyashan, Hulin,
520
and other places, and especially in Linkou and Muling. These findings are consistent with the disaster
521
range extracted in 2011 in Figure 5(e). Meanwhile, it can be seen from the figure that the Heihe River
522
in the northwestern part of the province also experienced a serious disaster. At the end of August
523
2012, a windstorm caused large areas of crop lodging in cities and counties in the central part of
524
Suihua and the Sanjiang Plain, resulting in serious urban waterlogging in Harbin. From the extracted
525
disaster map, it can be seen that, with the exceptions of the disasters consistent with the above
526
meteorological data, the flooding on the Sanjiang Plain was relatively serious. In the summer of 2013,
527
Heilongjiang Province experienced heavy precipitation. In mid-August, Fuyuan County was stricken
528
by floods and waterlogging and suffered serious losses, which was in agreement with the distribution
529
map of extracted disasters across the entire province. Furthermore, the eastern part of Heilongjiang
530
Province suffered from a large range of disasters. At the end of August 2016, strong winds and
531
rainstorms hit the eastern part of the province. Gusts in Tongjiang even reached level 10; Fuyuan,
532
Suibin, Fujin, and Huachuan level 9; Tonghe, Dongning, and 13 other counties and cities level 8; and
533
Suifenhe, Yilan, and 30 other counties and cities level 7. The high winds caused the partial lodging of
534
rice and corn crops. The aforementioned observations were consistent with the extraction range. In
535
August 2017, the amount of precipitation in Heilongjiang Province increased. In mid-August, a
536
severe flood occurred in the city of Anda, and also took place along a number of small and
medium-537
sized rivers, including the Tongkan, Hulan, Zhaolanxin, Belahong, Maolan, Dongxiao and Helen,
538
with their water levels rising rapidly. The disaster distribution map of the entire province indicated
539
that the flooding was serious on DOY 247.
540
On DOY 257, the disasters in 2010 and 2019 were still serious. In 2010, droughts occurred in
541
Heilongjiang Province from late spring to early summer, and also in September. As seen in Figure
542
5(f), the 2010 disaster map revealed that disasters mainly occurred on the Sanjiang Plain and in the
543
eastern part of Heilongjiang Province. Since the fall of 2011, the continuous high temperatures and
544
insufficient rainfall in Heilongjiang Province have led to meteorological drought in some areas. The
545
disaster monitoring results extracted in 2011 primarily indicate drought in the east. In mid-September
546
2012, Typhoon ”Sanba” tracked northward, disturbing the normal conditions in the eastern part of
547
Heilongjiang Province. The associated precipitation from this system alleviated the previous drought
548
and water shortage of reservoirs in the eastern part of Heilongjiang Province. Furthermore, the
549
amount precipitation in September was high. From the disaster scope extraction map, it can be seen
550
that waterlogging resulted from serious river flooding. Since the rice crop was harvested early in
551
some areas, however, the disaster range of the phase extraction was large [33].
553
Figure 6. Disaster classification in Heilongjiang Province
554
It can be seen from Figure 5, Figure 6, and the meteorological data analysis that according to the
555
distribution of disasters throughout the year, 2010, 2011, and 2012 were normal years, while the
556
disasters in 2014, 2015, 2017, and 2018 were relatively mild, and those in 2013, 2016, and 2019 were
557
serious.
558
By analyzing the meteorological disaster data, Figure 5, and Figure 6, as well as the above
559
discussion, we were able to summarize the spatial and temporal distribution characteristics of
560
disasters from 2010–2019 in Heilongjiang Province. In terms of time distribution, disasters occurred
561
frequently in July and August; spatially, disasters mainly took place in the central, eastern, and
562
southwestern regions from June–August, including Qiqihar, Heihe, Suihua, Haerbin, Jiamusi, and
563
other locations.
564
Different disasters exhibited different spatial and temporal distribution characteristics.
565
Submersion was observed frequently in late June, although it also occurred in July and August, with
566
the exception of the northwest Greater Khingan Mountains. In some years, submersion was prevalent
567
in September. This type of disaster was primarily distributed in northeastern Heilongjiang Province,
568
in places such as Jiamusi, Tongjiang, Fuyuan, Fujin, and Suiling County in Hegang. In addition,
569
Shuangyashan in the east, Qiqihar in the west, and Daqing and Suihua in the southwest were also
570
frequently flooded. This is due to the fact that precipitation in Heilongjiang Province is concentrated
571
from June to August, and the terrain is high in the northwest, north, and southeast, and low in the
northeast and southwest. This means that, in terms of precipitation, a substantial difference exists
573
between the eastern and western regions in Heilongjiang Province throughout the year, with large
574
amounts of precipitation in the eastern and western regions and small amounts in the central and
575
southern regions. The Songnen Plain and Sanjiang Plain comprise higher topographical terrain and
576
favorable water vapor conditions, making it easy for heavy precipitation to develop, and leading to
577
numerous flood disasters. At the same time, since the central and northwest areas of the province are
578
high while the northeast and west are low, flooding occurs readily.
579
Hail disasters occur frequently in June and July, and from late August to mid-September. Jiamusi
580
in the east is a frequent disaster site, as are Shuangyashan, Mudanjian, and Jixi. In the western part
581
of the province, hail disasters are concentrated in the Suihua, Heihe, and Qiqihar areas. The
582
mountainous area represented by the Greater Hinggan Mountains experiences low temperatures and
583
is prone to suffering from frost and hail disasters. These occur primarily as a result of orographic
584
lifting and the planting structure of crops.
585
Droughts in Heilongjiang Province generally occurred in July and September, with the July
586
droughts mainly developing in the southwest Suihua urban area and Harbin, as well as Daqing in
587
Durbert Mongolian Autonomous County, Zhaozhou County, and Zhaoyuan County. In the
588
northwest, Baoqing County, Suibin County, Fujin, Tongjiang, and Fuyuan County are located on the
589
Sanjiang Plain. In September, droughts mainly occurred in the northeast, including Yichun and
590
Hegang in the north, as well as Lubei County, Suibin County, and Tongjiang. Qiqihar and the
591
Mudanjiang area experienced high temperatures and were prone to drought.
592
In Heilongjiang Province, wind damage was always observed in August and September, while
593
there were fewer windstorms in July. This type of disaster mainly occurred in the east and northeast
594
areas, as well as central and eastern regions such as Huachuan County, Suijiang County, Fujin,
595
Tongjiang, Fuyuan County in Jiamusi, Yilan County, Shuangyashan in Jixian, Baoqing, Raohe, and
596
Jidong County, as well as Jixi and Hulin.
597
598
4. Discussion
599
In general, the three disaster monitoring models exhibited high accuracy, although their
600
monitoring accuracy levels for various disasters were different. The monitoring accuracy levels of
601
hailstorms, droughts, and floods were higher. For insect and wind disasters, the real-time monitoring
602
accuracy levels were low, and the phenomenon of disaster lag usually appeared in the subsequent
603
images 16 days later. This is due to the fact that the disasters caused by hailstorms, floods, and
604
droughts are immediate and serious for crops, with short duration and clear changes in the satellite
605
images. The damage to crops from pests and windstorms, however, is continuous rather than
short-606
term, and does not immediately cause changes in the images.
607
The accuracy levels of the disaster extraction range of different phases were also different.
608
According to the extraction differences of the disaster ranges listed in Table 7, the disaster ranges on
609
DOY 130, 145, 167, and 273 presented great differences and the ranges themselves were large, with
610
consistency only occurring from DOY 177 to DOY 257. This was mainly due to the low crop coverage
611
and large bare soil area befor