R E S E A R C H
Open Access
Image analysis of ceramic burning based
on cellular automata
Xiaowei Gu
1*and Yiqin Sun
2Abstract
In order to effectively improve the flexural strength and fracture toughness of ceramics, two methods can be used to control the growth rate of grain during sintering of ceramic materials by adding a certain amount of (W,Ti)C material. Therefore, on the one hand, the paper simulates the composite ceramic materials based on cellular automata (CA) to optimize the ratio of two formulations. On the other hand, in order to optimize sintering process, CA modeling is also carried out for the sintering process of composite ceramics. Finally, in order to detect the temperature of the firing zone of the ceramic kiln by using the characteristics of the flame image of the firing zone, the K-means clustering method is used for the color segmentation of the flame image of the firing zone of the ceramic kiln. The experimental results show that the size of the grains is in accordance with the actual situation of the simulation and the
microstructure evolution of the composites can be simulated well by using the CA theory to simulate the composites; with the increase of simulation time, the grain size distribution is basically unchanged, which accords with the normal distribution, and the simulation process of grain growth is very stable. Based on the K-mean clustering segmentation method, the segmentation of the flame image of ceramic kiln firing zone is realized. This method also provides a good technical means for feature extraction of flame image in ceramic kiln firing zone.
Keywords:CA, Composite ceramic materials, Ceramic burning image
1 Introduction
Ceramic material has high hardness, high wear resistance, and good high temperature stability, as well as good elec-trical and thermal conductivity and chemical resistance [1]. Therefore, there is a great prospect in the field of re-fractories, nozzles, cutting tools, and bearings. In addition, ceramic material belongs to the boron-containing series ceramics and can generate boron oxide lubricating film dissolved with other elements under friction and high temperature (800–1000 °C) driving, which can realize self-lubricating and is a very good self-lubricating material [2]. Ceramic material has good neutron control capabil-ities and can be used in the nuclear industry. However, the sintering densification of ceramic materials is more diffi-cult in bending strength, and the defects of low fracture toughness limit its application scope. It often fails because
of damage [3]. Related studies have shown that [4] (W,Ti)C composites can effectively increase the bending strength and fracture toughness of composite ceramic ma-terials. With the increasing demand for composite mate-rials in modern engineering, during the preparation of composite ceramic materials, if the formulation is not op-timized, ceramic material grain growth and abnormal growth may occur during the preparation process. (W,Ti)C grain distribution is not uniform and will not achieve the purpose of improving the performance of composite ceramic materials. Therefore, optimizing the proportion of the two components in composite ceramic materials is very important to improve the performance of composite ceramic materials. In addition, adding (W,Ti)C composites to ceramic material can also significantly im-prove its mechanical properties. The level of mechanical properties of [5] is closely related to the microstructure. But the mechanical properties are closely related to the microstructure. The grain growth during sintering deter-mines the evolution of the microstructure and the local topological structure of the sintered body, and the bending strength of the sintered body. Fracture toughness and * Correspondence:[email protected]
Xiaowei Gu and Yiqin Sun contributed equally and are co-authors of this manuscript.
1School of Information Science and Technology, Zhejiang Sci-Tech University,
928 Second Avenue, Xiasha Higher Education Zone, Hangzhou, Zhejiang, People’s Republic of China
Full list of author information is available at the end of the article
hardness play an important role. Therefore, it is of great significance to study the grain growth in the sintering process of ceramic materials and optimize the sintering process to improve the bending strength, fracture tough-ness, and hardness of the materials.
In recent years, many studies have been carried out on the grain growth in the process of preparing materials by computer simulation. The commonly used research methods are [6]: phase field method, Monte Carlo method, and so on. However, the models also have some defects, such as the low efficiency of [7] Monte Carlo method, the complexity of phase field theory model, the large amount of calculation, and the gap between [7] Monte Carlo method and the actual model. In 1991, Hesselbarth et al. [8] firstly used CA method to simulate the kinetics of recrystallization nucleation and grain growth of materials and obtained the same results as that of JAMK theory. With the increasing of simulation research on grain growth based on CA method, Liu [9] proposed a two-dimensional grain growth model combin-ing MC method and CA method. Geiger et al. [10] pro-vided the CA method based on thermodynamics which is proposed to simulate the two-dimensional growth of grains. Ding [11] et al. established two-dimensional and three-dimensional CA models based on the minimum en-ergy principle. Raghavan et al. [12] proposed a small incre-ment processing method for cells. Guan Xiaojun et al. [13] and Ma Xiaofai et al. [14] also simulated the grain growth by CA method. CA shows complex behaviors through cel-lular interaction through simple operation rules. It has be-come the main tool for modeling complex systems. However, the application of CA method to the simulation of grain change in the sintering process of composite cer-amic materials is relatively rare.
In the process of industrial production, the sintering zone temperature of ceramic kiln is an important factor affecting the firing quality of ceramic products, so it is very necessary to study the advanced detection and con-trol methods of ceramic kiln firing belt condition. In re-cent years, with the development of image processing technology, most of the industrial production control through the extraction of flame characteristics of the analysis of the state of material combustion. Effective flame segmentation is one of the key techniques to detect temperature by flame image, so it is necessary to study the effective flame image segmentation tech-nology. The common image segmentation methods include threshold method and clustering analysis. The threshold method is suitable for gray image segmenta-tion, but not for flame image color segmentation. K-means clustering algorithm is a mature clustering analysis method, which has been successfully applied to face image segmentation and remote sensing image analysis and other fields.
Therefore, this paper starts with two aspects. On the one hand, CA theory is used to simulate the composite materials, and the relationship between grain distribu-tion and microstructure is analyzed. It is of great signifi-cance to select the preparation process reasonably, save the experiment cost, shorten the experiment period, and improve the experiment efficiency. On the other hand, using CA theory, the CA model of grain growth during sintering of composite ceramic materials is established. The grain growth of ceramic materials was simulated. The relationship between grain size distribution and simulation time was analyzed, and the growth index was calculated and compared with the prepared ceramic ma-terials. In addition, in the Lab color space, the K-mean clustering is applied to the segmentation of the flame image of the combustion zone of the ceramic kiln and the experiment is carried out. Finally, the segmentation and contrast experiments are carried out in different color modes.
2 Method—establishment of CA model 2.1 CA model
CA can be considered to be composed of many grids. Each cell in the grid is a cell and only takes a finite discrete state. All of them follow the same local trans-formation rules and update [15] synchronously. A large number of cells form the dynamic evolution of the sys-tem through simple interaction and can form a complex evolutionary state. CA [16] is not defined by a definite function, but is determined by simple rules. That is, CA model is the general name of dynamic system which sat-isfies certain rules. The states of each variable are only limited, and the rules of state change are local.
boundary conditions. There are generally three types of boundary conditions: reflection type, fixed value type, and periodic type [19]. In some cases, random forms can be used to simulate real-time natural phenomena, that is, to generate random numbers at the boundary in real time.
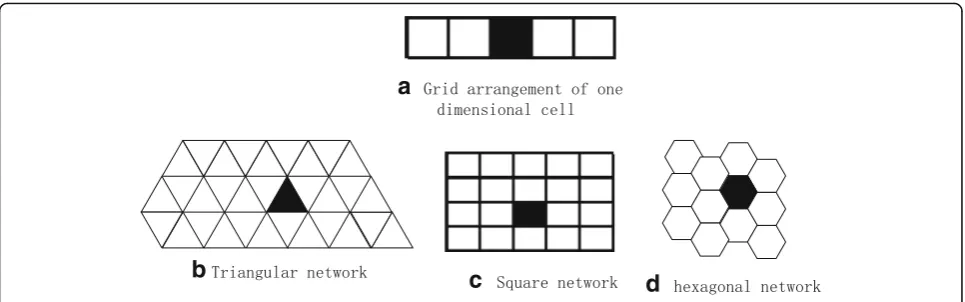
The cellular space and the cellular space represent only the static components of the system, and the dynamic sys-tem is formed by adding the evolution rules to the syssys-tem. These rules in CA are defined in a local space, and a cell will determine the state of the next moment according to its own state and the state of its neighbor’s cell; therefore, the definition of neighbor rules is the premise of CA oper-ation, and it must be clear which one cell neighbor has. One-dimensional CA can determine neighbors according to radius. Two-dimensional CA defines neighbors more complex, and there are two general ways: One is a von Neumann neighbor, where the cell’s neighbors are com-posed of four cells adjacent to each other from the top, bottom, left, and right. The radius is 1. The other is the Moorish neighbor, where the cell neighbors are composed of upper, lower, left, right, upper, lower right, lower left, and lower left cells [20].
The rule is the dynamic basis of CA evolution and the dynamic function to determine the state of the cell at the next moment, that is, [21].
f :Stiþ1¼ f S it;StN ð1Þ
wherefdenotes the evolution rule of the state andSti de-notes the state of the cell I at the t moment and the state, while StN represents the state of the neighbor cell of the cellIat the time oft.
2.2 Simulates the composite ceramic materials based on CA (simulation of grain structure evolution)
2.2.1 The physical significance of the model
Grain boundary energy is the driving force of grain growth, which is closely related to the curvature of grain boundary. The movement of grain boundary is determined by the
change of grain boundary energy and curvature of grain boundary. If the grain boundary energy is isotropic, the grain boundary energyEiof cellIcan be expressed as [22].
Ei¼ Jki
Xnn
k
1−δSiδSk
ð Þ ð2Þ
where Jki is a measure of the grain boundary energy between the cell i and the adjacent k, the total number of the adjacency ofn is the celli. δis the orientation of the Kronechaer symbol, Sk being the adjacent k. If the
orientation value of the cell Iis changed to the orienta-tion value of the cell j, then the change of the grain boundary energy is recorded asΔEi,j, that is, [23].
ΔEi;j¼Ej−Ei ð3Þ
2.2.2 Simulation of grain structure evolution
The simulation process of grain structure evolution con-sists of four main steps: discrete simulation space, initialization of lattice points, presupposition of parame-ters, and determination of evolution rules.
Discrete simulation space
In this paper, a two-dimensional square cell space is used to divide the simulated region, and the adjacent rela-tion is of the Moore-Moore-Moore type, as shown in Fig. 2. At this time, the neighbor of the cell is composed of eight cells located in the upper, lower, left, right, upper, lower and lower left, and the lower left of the eight adja-cent positions.
Initialization lattice
The initial lattice is to initialize the state of all the cells. At the beginning of the simulation, each cell is given a random orientation value. If the orientation value of the adjacent cell is the same, it will be
a
b
c
d
regarded as the same particle, and if different, it will be regarded as different grain. The state of the cell E is expressed as [24].
E tð Þ ¼f Að ðt−ΔtÞ;B tð−ΔtÞ;C tð−ΔtÞ;D tð−ΔtÞ;E tð−ΔtÞ; F tð−ΔtÞ;G tð−ΔtÞ;H tð−ΔtÞ;I tð −ΔtÞÞ
ð4Þ
whereΔtis the time step.
Prediction parameters
The prediction parameter is to give a predetermined value to each parameter in the simulation process.
Deterministic evolution rule
The evolution rules used in this paper contain four conditions:
(1) If the state of cellEattis the same as that of eight adjacent cells, then the state ofEremains
unchanged in the next time step.
(2) If any three of the nearest neighbor cells of cellE are statesaatt, the state ofEwill change toaat the next time step.
(3) If any three of the next nearest neighbor cells of cell
Eare statesbatt, the state ofEchanges tobin the next step.
(4) If the above conditions are not satisfied, a cell is randomly selected from the eight adjacent cells, and the grain boundary of the system can changeΔEi,jafter calculation. According to the transition probabilityP, the change of the cell is
determined, andPuses the following reorientation probability model:
P¼
1 ΔEi;j<0
0:5 ΔEi;j¼0
0 ΔEi;j>0
8 <
: ð5Þ
In each time step of the simulation, the order of the transition of cellular orientation state is as follows: con-dition 1, concon-dition 2, concon-dition 3, and concon-dition 4. When one of the conditions is satisfied, the correspond-ing orientation state transition is carried out, and the subsequent judgment steps can be omitted. Finally, all the other cellular orientation state transitions are judged in turn, and a time step of the cell state transition process is completed.
In this paper, the initial modeling is carried out ac-cording to the material performance parameters shown in Table 1, and the simulation is carried out according to the content of each component in Table2. The whole process includes discrete simulation space, initialization of lattice points, presupposition of parameters, and de-termination of evolution rules, programming, simula-tion, and result analysis.
2.3 Carry out CA modeling for sintering process of composite ceramics
In order to optimize the sintering process, a CA model of grain growth in the sintering process of composite ceramics was established, which can simulate the grain growth of ceramic materials. The growth index is solved by analyzing the relationship between grain size distribu-tion and simulated time. Generally, the CA modeling process of sintering process of composite ceramics mainly includes determining the initial conditions of simulation, determining the unit grain boundary energy, and pore initialization.
Determining the initial conditions of simulation
In this paper, a quadrilateral mesh structure of 600 × 600 is used, and periodic boundary conditions are used. The actual size of the side length of each cell is 0.12 μm. A Fig. 2Neighbor definition of Moore type for two-dimensional
cellular automata
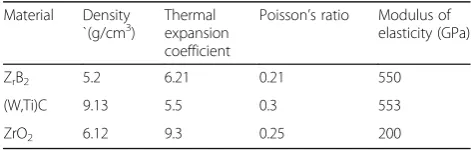
Table 1Each component performance parameters in the ZrB2/
(W,Ti)C composites
Material Density
`(g/cm3) Thermalexpansion coefficient
Poisson’s ratio Modulus of elasticity (GPa)
ZrB2 5.2 6.21 0.21 550
(W,Ti)C 9.13 5.5 0.3 553
random orientation number is given to each cell before the simulation. The orientation number of ceramic matrix is in the range of 1001≤S1i≤1500, and the orientation num-ber of other particles is in the range of 1≤S2i≤1000, which represents the value of each cell; crystallographic orienta-tion of different cells in grains. Two percent of sintering auxiliaries were used as inert particles to give a fixed orientation value. After the ratio of composite materials to sintering auxiliaries was set, the program was randomly distributed in the matrix. Here, it is assumed that the sin-tering auxiliaries neither migrate nor react and diffuse with other phases during the simulation process.
Determining the unit grain boundary energy
In the two ball densification model of simple cubic stacking, the relationship between two angles and grain boundary energy is
Jss¼2Jsv cosφ
2 ð6Þ
In formula: JSS is the grain boundary energy (J) be-tween solid phase and solid phase, JSV is the grain
boundary energy (J) between solid phase and gas phase, andφis the angle of two sides.
Pore initialization
The average size of stomata can be determined by the following formula.
da¼
2Dað1−fÞ
3f ð7Þ
In formula, da is the average diameter of pores (μm),
Dais the average diameter of powder particles (μm), and
f is the density of plain billet. In the simulated initialization structure, the porosity is 20%, then f= 0.8. According to formula (7), Da= 0.29Dacan be obtained.
It is necessary to initialize the structure first and then add the stoma to initialize the hole at 0. 29Da.
2.4 Image segmentation of ceramic kiln flame based on K-means clustering
The K-means clustering algorithm is iterative implemen-tation of image classification and extraction of all kinds of eigenvalues. Its basic ideas are as follows: First, the average value of each class is first removed, then the pixels are reclassified according to the newly generated mean, and then the previous steps are iterated to the new generated class. In this paper, the K-means cluster-ing algorithm based on criterion function is used for flame image segmentation. The general process consists of two steps:
2.4.1 Color space conversion
First, transform the RGB color space image into Lab color space. The purpose of image segmentation is to separate the target part. Based on the K-means clustering segmen-tation method, the segmensegmen-tation of the flame image of ceramic kiln firing zone is realized. This provides a good
Table 2Proportion of composition of composite materials
Sample name V((W,Ti)C) (%) V(ZrB2) (%) V(ZrO2) (%)
ZW0 0 93.3 6.7
ZW0 5 88.3 6.7
ZW10 10 83.68 6.32
ZW15 15 78.68 6.32
ZW20 20 73.8 6.2
ZW25 25 65.8 9.2
ZW30 30 62.4 7.6
ZW35 35 58.4 6.6
ZW40 40 52.4 7.6
technical means for feature extraction of flame image in ceramic kiln firing zone distributed into simple geometry. Therefore, the flame can be separated from the image by K-means clustering according to the color information. The commonly used color space models are HSV, RGB, and Lab. Among them, the Lab color model is a color model made by the CIE (International Lighting Commit-tee). Its color space is larger than the RGB space and can be expressed in all colors in nature. Therefore, this paper converts the RGB color space to XYZ color space. Then, the XYZ color space is converted to Lab color space.
2.4.2 Flame image segmentation using K-means clustering The general steps are as follows:
(1) Initialize. AnyKattribute value vector is taken as the center of the initial clustering. According to the maximum cycle number or the convergence error tolerance principle of the cluster center, the iteration termination condition is set.
(2) Iteration. According to the similarity criterion, the data objects are assigned to the nearest cluster center, andKclustering data sets are obtained. (3) Updated cluster center. The average value of each
point in the cluster dataset is calculated, and then, the average value of each class is used as the new clustering center to reassign the data object. (4) Judge whether clustering is completed. If the
clustering center is no longer changed or the sum
a
b
c
of square errors is local minimum, then the iteration is terminated and the clustering
segmentation is completed. Otherwise, the second and third steps are repeatedly executed until the suspension condition is satisfied.
3 Experimental results and discussions 3.1 CA simulation experiment of composites
3.1.1 Experiment
In this paper, three kinds of materials with different pro-portions of ZrB2/(W,Ti)C/(ZrO2) are used, as shown in Table1. The raw materials of ZrB2and (W,Ti)C were re-spectively milled in anhydrous ethanol for 50 h, then dried at 150 °C for 24 h, and then sifted in a vacuum dryer to obtain more uniform fine powder. The primary refined ZrB2 was used as the matrix material, the strengthening phase, ZrO2, was used as the toughening phase, and the addition of MgO sintering aid was carried out. The prepared raw materials were poured into a bea-ker with anhydrous ethanol as the medium, and the ultrasonic wave was oscillated and stirred for 30 min for prevention of material agglomeration. The mixture was milled with anhydrous ethanol for 200 h and dried in a vacuum drying box at 150 °C for 24 h. The homoge-neous fine powder suitable for sintering was obtained. The mixed raw material powder was put into the high strength graphite mold, and the hot pressing sintering process was adopted in vacuum environment.
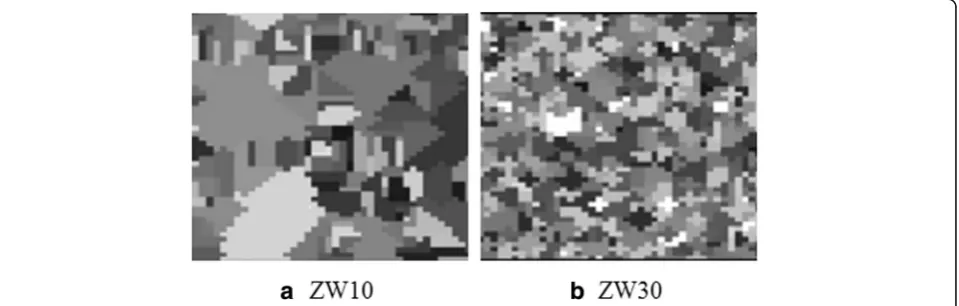
3.1.2 Comparison of results between ZW10 and ZW30 The simulation of microstructure of ZW series com-posite ceramics is shown in Fig. 2. From Fig. 3, it can be seen that when the content of (W,Ti)C increases gradually, the grain size decreases, the grain boundary becomes smooth and straight, the grain number is in-creasing, and the grain boundary length in the simu-lated region decreases gradually. From the grain shape, the grain turns from larger cells to three sides. In con-trast, the grain size of ZW30 is obviously smaller than the grain size of ZW10, and the distribution is more uniform, mainly because the proportion of ZW30 (W,Ti)C is more reasonable.
3.1.3 Comparison of relative density, flexural strength, and fracture toughness of ceramic materials with different proportions
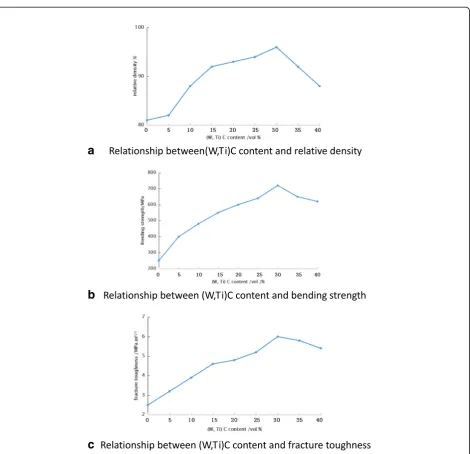
Figure 4 shows the curves of the relative density, flexural strength, and fracture toughness of ZW series ceramic materials with the change of (W,Ti)C content.
It can be seen from Fig. 4 that the density, bend-ing strength, and fracture toughness of ZW30 com-posite ceramics are the highest. The density, flexural strength, and fracture toughness of ZW0 composite ceramics are increased by 13.58 and 132%, respect-ively, so the ratio of ZW30 composite ceramic mate-rials is the best.
Fig. 5Microstructure evolution of grain growth from time to time from 500 to 2500 CAS
3.2 CA simulation of grain growth during sintering of composite ceramics
3.2.1 Experiment
The simulation object is the grain growth of ZrB2/ (W,Ti)C with 6.32% ZrO2 particles during sintering. According to the formula (5), at the initial stage of sintering, because the two balls did not penetrate, the two sided angle phi = 0, JSS/JSV = 3. The ratio of unit grain boundary energy is JS1S1:JS2S2:JS1V= 2 : 3 :
3 : 1. First, give the matrix a random orientation value.
The composite ceramics and sintering additives were randomly added to the matrix according to the set proportion. After running 300 CAS, the average grain diameter reached about 0.85 μm and the por-osity was initialized. At this time, 40% of the grains were randomly selected according to the number of grains, and the orientation value was assigned to 1501, which was defined as porosity. Because of the different grain size, the area of the simulated area is about 32%, that is, the density of the green is 0.68. Figure 4 is the microstructure image of composite ceramics with simulated time step. The white grain is ZrB2/(W,Ti)C grain, the gray grain is ZrO2 grain, the dark gray square grain is sintering aid, the light gray line is grain boundary, and the black area is pore.
It can be seen that the adjacent pores are through, and the distribution state is very similar to the distribution of pores in the billet.
3.2.2 Comparison of grain size distribution in different time steps
Figure 5 shows the grain size distribution of different simulated time steps. When the time step is 500 CAS, the distribution of grain size is relatively stable, the num-ber of grains of each size is normal distribution, the grain size of middle size is the majority, the grain size of smaller size is very small, and the case of abnormal grain growth is also rare. With the increase of simulation time, the grain size distribution is basically unchanged, and all of them accord with the normal distribution, which shows that the grain growth process is very stable.
3.2.3 Variation of average grain diameter with simulated time
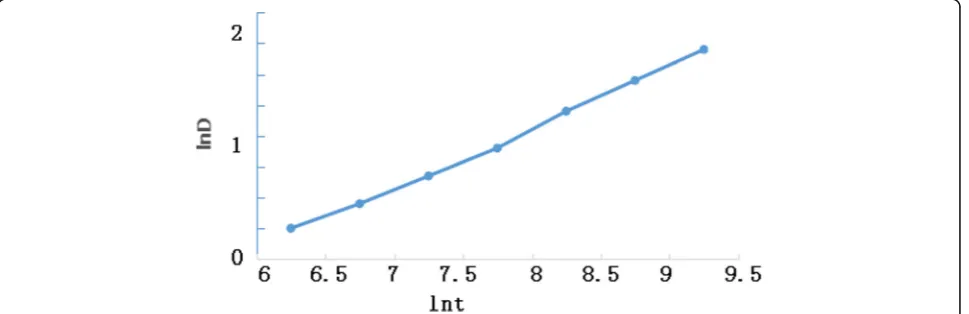
The curvature driven grain growth satisfies the following equation
Rg ¼ð Þkt n ð8Þ
where n is the grain growth index, the shear slope of the lnRg-lnt curve is obtained. The grain size in this paper is characterized by the diameterDa. As
a
b
Fig. 7Comparison betweenaCA method andbMC method for simulating grain growth process
a
b
Da
2 ¼ð Þkt
n ð
9Þ
As shown in Fig. 6, the logarithmic diagram of grain mean diameter with simulated time shows that the loga-rithmic diagram of grain mean diameter with time is ba-sically a straight line, and its slope is 0.82. It shows that the growth index simulated in this paper is slightly lower. The average grain size obtained in the simulation process may be slightly smaller than that of the real microstructure.
3.2.4 The comparison between CA method and MC method In order to verify the performance of CA method ap-plied to the simulation of grain growth in the sintering process of composite ceramics, CA method and MC method are used to simulate the grain growth in the sin-tering process of composite ceramics under the same conditions. The simulation results are shown in Fig.6, in which the time step is from 500 to 1500 CAS.
As can be seen from Fig.7, the grain size distribution in (a) diagram is more stable than that in (b) diagram. The number of grains of various sizes is normal distribu-tion, the majority of grains are of middle size, and the few grains of smaller size and the abnormal growth of grains are very few. And with the increase of simulation time, the grain size distribution in the (a) diagram is ba-sically unchanged, which is in good agreement with the normal distribution. And the crystal particles in (b) dia-gram are still increasing slowly. It can be seen that the grain growth process in (a) diagram is very stable. Therefore, the effect of CA simulation is more stable than that of MC simulation in the simulation of grain growth in the sintering process of composite ceramics.
3.3 Flame image segmentation in ceramic sintering process
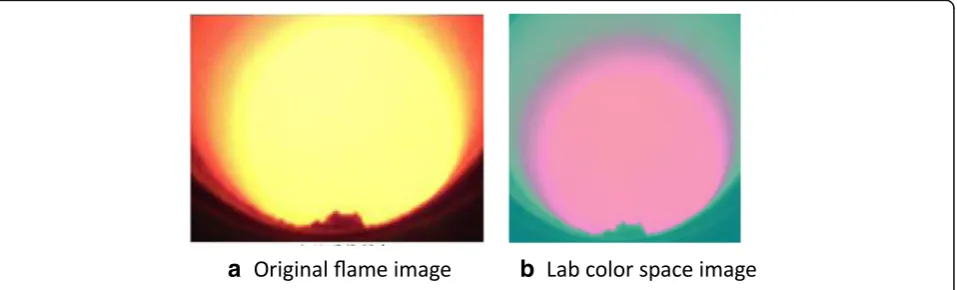
According to the characteristics of ceramic kiln flame image, the RGB color space image is first converted into Lab color space. The picture effect is shown in Fig. 8. Finally, according to the experimental results and experi-mental results, the K-means clustering segmentation of
ceramic kiln flame images has achieved good results whenKandnare taken as 3, as shown in Fig.8. Accord-ing to the K-means clusterAccord-ing method of Fig. 9, the image of ceramic kiln fired with flame is segmented well, and every part of the image is well distinguished after the segmentation.
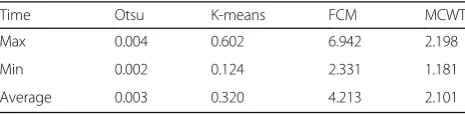
In order to quantify the segmentation results, PRI (Probabilistic Rand Index), VOI (variation of information), GCE (Global Consistency Error), and BDE (Boundary Dis-placement Error) are used to analyze and evaluate the seg-mentation results from different perspectives. PRI is the ratio of the total number of pixels to the total number of pixels between statistical machine segmentation and man-ual separation. VOI is used to measure the distance be-tween two segmented images, indicating the randomness of the segmented image relative to manual segmentation. GCE is used to measure the consistency of segmented im-ages compared with manual segmentation. BDE measures the edge average error of two segmented images, which is defined as the distance between a pixel on the edge of the automatic segmentation and the nearest pixel of the artifi-cially segmented image. In this experiment, 10 flame im-ages with different air volume are selected and segmented by Otsu, K-means, FCM, and MCWT, respectively. The mean and standard deviations of PRI, VOI, GCE, and BDE of each segmentation method are calculated, and the time required for segmenting the flame image is also calculated. The performance of the segmentation algorithm is evalu-ated objectively. The comparison results are shown in Table3and Fig.10.
As can be seen from Table 3 and Fig. 10, Otsu seg-mentation time is the shortest, but its segseg-mentation ac-curacy is too low to provide reliable information for flame detection. The K-means segmentation time is
c
d
e
Fig. 9c–eClustering segmentation results
Table 3Comparison of time required for segmentation of
flame images using different algorithms
Time Otsu K-means FCM MCWT
Max 0.004 0.602 6.942 2.198
Min 0.002 0.124 2.331 1.181
relatively short, the PRI of the algorithm is larger, and the VOI and BDE are smaller. It shows that the K-means algorithm has higher accuracy and better stability. The segmentation time is relatively short. Therefore, com-bined with various evaluation indexes, the K-means algo-rithm has the best segmentation effect.
4 Conclusions
It is difficult to densify its flexural strength, and its appli-cation range is limited by its low fracture toughness, so as to improve the flexural strength, fracture toughness, and hardness of ZrB2 ceramic material. In order to im-prove the flexural strength, fracture toughness, and hardness of ZrB2 ceramic material, it can be added to ZrB2ceramic material by adding a certain proportion of (W,Ti)C and optimizing sintering process. However, with the addition of (W,Ti)C and how to optimize the sinter-ing process of composite ceramic materials, the CA the-ory is used to simulate the composite materials and the relationship between grain distribution and microstruc-ture is analyzed in this paper. Choose the best propor-tion of composite ceramic materials. The grain growth in the sintering process of composite ceramic materials was also established based on long CA model. The grain growth of ceramic materials was simulated. The relation-ship between grain size distribution and simulation time was analyzed, and the growth index was calculated. Finally, in Lab color space, the K-means clustering is used to segment the flame image of the combustion
zone in ceramic kiln and the experiment is carried out. Fi-nally, a comparison experiment is carried out under differ-ent color modes. Through simulation experimdiffer-ents, it is found that:
(1) With the increase of (W,Ti)C content, the morphology of the grains continues to evolve. The grain size of ZW30 is obviously smaller than that of ZW10, and the distribution is more uniform, which is mainly due to the reasonable proportion of (W,Ti)C in ZW30 formula, and the grain size of ZW30 is smaller than that of ZW10, and the grain size of ZW30 is smaller than that of ZW10, and the grain size of ZW30 is more uniform than that of ZW30. (2) The density, flexural strength, and fracture toughness
of ZW30 composite ceramic material were improved by 13.58, 160, and 132%, respectively.
(3) With the increase of simulation time, the grain size distribution is basically unchanged, which accords with the normal distribution, and the simulation process of grain growth is very stable. The simulated grain growth indexnis 0.42.
(4) Based on K-means clustering method, the image seg-mentation of ceramic kiln fired with flame is presented.
Abbreviations
BDE:Boundary Displacement Error; CA: Cellular automata; CIE: International Lighting Committee; GCE: Global Consistency Error; HSV: Hue saturation value; PRI: Probabilistic Rand index; RGB: Red green blue; VOI: Variation of information
Acknowledgements
The authors thank the editor and anonymous reviewers for their helpful comments and valuable suggestions. I would like to acknowledge all our team members, especially Yiqin Sun.
Funding
This research was supported by the National Natural Science Foundation of China under grant no. 51407156, Public welfare Technology Application Research Programs of Science and Technology Department of Zhejiang province under grant no. 2016C33018, and the Project Grants 521 Talents Cultivation of Zhejiang Sci-Tech University and Key Laboratory for RF Circuits and Systems (Hangzhou Dianzi University), Ministry of Education.
Availability of data and materials Please contact author for data requests.
Authors’contributions
All authors take part in the discussion of the work described in this paper. These authors contributed equally to this work and should be considered co-first authors. Both authors read and approved the final manuscript.
Competing interests
The authors declare that they have no competing interests.
Publisher’s Note
Springer Nature remains neutral with regard to jurisdictional claims in published maps and institutional affiliations.
Author details 1
School of Information Science and Technology, Zhejiang Sci-Tech University, 928 Second Avenue, Xiasha Higher Education Zone, Hangzhou, Zhejiang, People’s Republic of China.2Key Laboratory for RF Circuits and Systems of Ministry of Education, Hangzhou Dianzi University, 1158, No. 2 Street, Xiasha Higher Education Zone, Hangzhou, Zhejiang Province 310018, People’s Republic of China.
Received: 22 July 2018 Accepted: 28 September 2018
References
1. L.Q. Chen, Phase-field models for microstructure evolution. Annu. Rev. Mater. Res.32(32), 113–140 (2002)
2. A.B. Bortz, M.H. Kalos, J.L. Lebowitz, A new algorithm for Monte Carlo simulation of Ising spin systems☆. J. Comput. Phys.17(1), 10–18 (1975) 3. H.W. Hesselbarth, I.R. Göbel, Simulation of recrystallization by cellular
automata. Acta Metall. Mater.39(9), 2135–2143 (1991)
4. Y. Liu, T. Baudin, R. Penelle, Simulation of normal grain growth by cellular automata. Scr. Mater.34(11), 1679–1683 (1996)
5. J. Geiger, A. Roósz, P. Barkóczy, Simulation of grain coarsening in two dimensions by cellular-automaton. Acta Mater.49(4), 623–629 (2001) 6. H.L. Ding, Y.Z. He, L.F. Liu, et al., Cellular automata simulation of grain
growth in three dimensions based on the lowest-energy principle. J. Cryst. Growth293(2), 489–497 (2006)
7. Y. He, H. Ding, L. Liu, et al., Computer simulation of 2D grain growth using a cellular automata model based on the lowest energy principle. Mater Sci Eng A429(1), 236–246 (2006)
8. S. Raghavan, S.S. Sahay, Modeling the grain growth kinetics by cellular automaton. Mater Sci Eng A445(6), 203–209 (2007)
9. W. Yu,Cellular Automata Modelling of Austenite Grain Coarsening during Reheating(University of Sheffield, 2002)
10. F. Hua, Y.S. Yang, D.Y. Guo, et al., Grain growth cellular automata model based on the curvature-driven mechanism. Acta Metall Sin40(11), 1210–1214 (2004) 11. X.Y. Jiao, X.J. Guan, Y.T. Liu, et al., Simulation of grain growth based on Cellular
Automata method[J]. Journal of Shandong University,35(6), 24–28 (2005) 12. X.F. Ma, X.J. Guan, Y.T. Liu, et al., Cellular automaton model for grain growth based
on modified transition rule[J]. Chin. J. Nonferrous Metals.18(1), 138–144 (2008). 13. M. Braginsky, V. Tikare, E. Olevsky, Numerical simulation of solid state
sintering[J]. Int J Solids Struct42(2), 621–636 (2005)
14. L. Nurminen, A. Kuronen, K. Kaski, Kinetic Monte Carlo simulation of nucleation on patterned substrates. Phys. Rev. B63(3), 035407 (2000)
15. C.C. Battaile, D.J. Srolovitz, J.E. Butler, A kinetic Monte Carlo method for the atomic-scale simulation of chemical vapor deposition: application to diamond. J. Appl. Phys.82(12), 6293–6300 (1997)
16. D. Raabe, L. Hantcherli, 2D cellular automaton simulation of the recrystallization texture of an IF sheet steel under consideration of Zener pinning. Comput. Mater. Sci.34(4), 299–313 (2005)
17. M. Cook, Universality in Elementary Cellular Automata[J]. Complex Systems.
15(1), 1–40 (2004)
18. D. Spencer, Cities and Complexity: Understanding Cities with Cellular Automata, Agent-Based Models, and Fractals[J]. J. Reg. Sci.83(2), 624–627 (2007) 19. A. Imre, G. Csaba, L. Ji, et al., Majority logic gate for magnetic quantum-dot
cellular automata[J]. Science.311(5758), 205–208 (2006)
20. J.I. Barredo, M. Kasanko, N. Mccormick, et al., Modelling dynamic spatial processes: simulation of urban future scenarios through cellular automata[J]. Landsc. Urban Plan.64(3), 145–160 (2003)
21. J.J. Meléndez-Mart́ıNez, A. Domı́Nguez-Rodrı́Guez, F. Monteverde, et al., Characterisation and high temperature mechanical properties of zirconium boride-based materials. J. Eur. Ceram. Soc.22(14), 2543–2549 (2002) 22. F. Monteverde, A. Bellosi, Effect of the addition of silicon nitride on
sintering behaviour and microstructure of zirconium diboride. Scr. Mater.46(3), 223–228 (2002)
23. L. Scatteia, D. Alfano, F. Monteverde, et al., Effect of the machining method on the catalycity and emissivity of ZrB2and ZrB2–HfB2-based ceramics. J.
Am. Ceram. Soc.91(5), 1461–1468 (2010)