R E S E A R C H
Open Access
A novel texture-based asymmetric visibility
threshold model for stereoscopic video
coding
Baozhen Du
1,2, Mei Yu
1*, Gangyi Jiang
1, Yun Zhang
3,4and Tianzhi Zhu
1Abstract
Asymmetric stereoscopic video coding is becoming increasingly popular, as it can reduce the bandwidth required for stereoscopic 3D delivery without degrading the visual quality. Based on the perceptual theory of binocular suppression, the left and right views of stereoscopic video are coded with different levels of quality. However, existing asymmetric perceptual coding approaches on stereoscopic video mainly focus on the threshold of whole image distortion. It is not so reasonable to use a single unified rather than adaptable perception threshold for a random natural stereoscopic image as the texture complexity typically varies in different blocks of image. In this paper, we generated an asymmetrically distorted stereoscopic image set with different texture densities and conducted a large number of subjective perceptual experiments. A strong correlation between the asymmetrical visibility threshold and texture complexity is revealed from the subjective experiments, and a texture-based asymmetrical visibility threshold model (TAVT) is established. Then, the model is extended to the hierarchical B picture (HBP) coding architecture and an asymmetric stereoscopic video coding method is proposed based on the TAVT model. Experimental results show that the proposed method can effectively reduce the unnecessary perceptual redundancy without visual quality degradation. Especially, it is more efficient for high bitrate configuration.
Keywords:Asymmetric coding, Texture complexity, Asymmetric visual threshold, Subjective perceptual experiment
1 Introduction
Nowadays, asymmetric coding is widely concerned in the field of stereoscopic video coding [1, 2].This approach is based on the perceptual theory of binocular suppression, which is a so-called masking effect on hu-man visual perception [3]. It is noticed that in the stereoscopic vision the view with relatively better quality contributes more to the overall stereoscopic image qual-ity [4]. Thus, theoretically, when one viewpoint of a stereoscopic image is coded in such a way that the high quality can be maintained, the other viewpoint of the stereoscopic image can then be compressed to a greater extent without inducing visible artifacts of stereoscopic perception. Therefore, the total bitrate of stereoscopic video can be reduced through the asymmetric coding.
Asymmetric stereoscopic video coding is mainly stud-ied from two aspects: the mixed resolution and the asymmetric quantization coding. A mixed resolution concept is first brought forth by Perkins, which assumes that stereoscopic perception will not be affected when one view is of high quality and the other view of lower quality [5]. The concept has been widely adopted since then in stereoscopic-based video. In order to reduce vis-ual discomfort and super-resolve the low qvis-uality views to the target full resolution, a virtual view assisted super resolution algorithm is proposed in [6]. The algorithm can recover the details in regions with edges while main-taining good quality at smooth areas by properly exploit-ing the high quality virtual view pixels and the directional correlation of pixels. The experimental re-sults demonstrate the effectiveness of this algorithm with a peak signal-to-noise ratio (PSNR) gain of up to 3. 85 dB. Researchers in [7] present a new depth encoding method called view up-sampling optimization to im-prove the quality of low resolution views. In the case of * Correspondence:[email protected]
1
Faculty of Information Science and Engineering, Ningbo University, Ningbo, China
Full list of author information is available at the end of the article
asymmetric blur-impaired images, the stereoscopic per-ception is dominated by the high quality view.
Based on the above considerations, it is found that the success of asymmetric coding depends on the type of encoding distortion. However, up to now much research works focus on the qualitative analysis of binocular suppression in stereoscopic perception. Only a few scholars have studied the problem of im-proving the efficiency of asymmetric coding from the aspect of the asymmetric quantization coding. Based on subjective perception experiment, researchers in [8] proposed the quantitative visibility threshold (VT) model and found that 2 dB will be a safe bound for asymmetric stereoscopic coding and where most of people cannot perceive the degradation of quality. The VT model in [8] can be further applied to asym-metric coding and save the total bitrate 9 to 34% [9].
How to set up a reasonable threshold model of stereo perception is the key to improve the efficiency of asym-metric coding. However, the visibility threshold pro-posed in [8] mainly focused on the whole image distortion, rather than the effect of the image content and local features on the visibility threshold. Obviously, if only a single unified perception threshold is used for natural stereoscopic images, visual perceptual redun-dancy cannot be maximally removed, because the tex-ture, brightness, and contrast characteristics in different blocks of the image are usually typically diverse.
On the other hand, traditional two-dimensional (2D) image/video just noticeable distortion (JND) researches have shown masking effects of texture [10] and luminance [11] for human perception. Such researches have suc-ceeded in characterizing effects of these factors on per-ceived thresholds using explicit JND models [12]. However, the mentioned JND model in [12] is originally developed for measuring the perceptible distortion of con-ventional 2D video which is not suitable for stereoscopic video. Unlike traditional 2D image/video, stereoscopic images/videos have additional spatial characteristics such as parallax [13] and depth [14] which also influence the perception of other characteristics such as texture of stereoscopic images/videos due to the effect of stereo-scopic masking. Therefore, JND model of 2D image/video cannot easily be applied to stereoscopic image/video. In order to remove visual perceptual redundancy, it is crucial to establish the relationship between the visibility thresh-old in stereoscopic perception and image factors, such as texture and luminance.
Texture is an important factor in image content [15]. In this paper, we focus on revealing the effect of texture on perceptual visibility threshold in stereoscopic image. Given the left view be considered as the dominant view, a hypothesis is preconditioned that texture factor affects the asymmetrical visibility threshold, which means that
human vision system cannot be aware of small textural quality change in stereoscopic image unless the degrad-ation exceeds a threshold. Based on a subjective percep-tual experiment, a TAVT model of quantization parameters (QP) is established to reveal the relationship between the asymmetrical visibility threshold and tex-ture complexity. Finally, an asymmetric coding scheme with adaptive quantization parameter based on TAVT model is proposed, in which the left view is encoded with normal quality, while the right view is encoded de-pending on the visibility threshold.
The remainder of this paper is organized as follows. We firstly present a framework of proposed stereoscopic video coding system in Section 2. Section 3 describes the subjective perception experimental procedure designed to verify hypothesis and establish the TAVT model. Sec-tion 4 describes the proposed TAVT-based stereoscopic video encoder is presented in detail, and the experimen-tal results are analyzed in Section 5. Finally, conclusions are drawn.
2 Framework of proposed stereoscopic video coding system
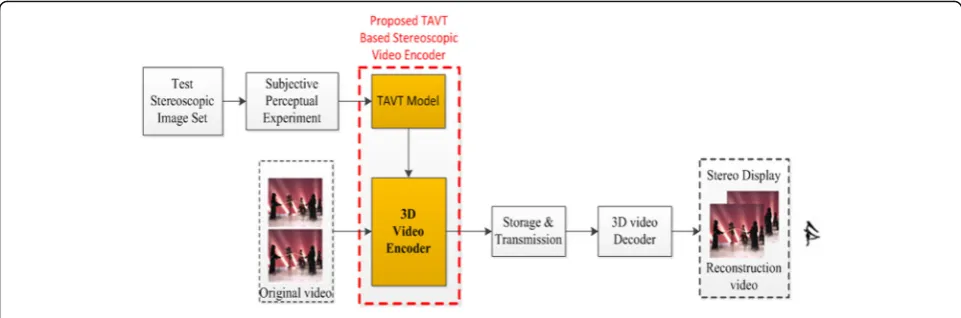
Figure 1 shows the framework of the proposed stereo-scopic video coding system. Firstly, the TAVT model is built and validated based on well-designed subjective experiments, and then the proposed TAVT-based stereo-scopic video encoder was developed. The original video is jointly coded into stereoscopic video bit stream by the proposed TAVT-based stereoscopic video encoder. After stored and transmitted to the client, bit stream is decoded and the reconstruction video sequence is dis-played on the stereoscopic display device for viewers.
In this framework, the establishment of the TAVT model is primary and essential. The model mainly in-clude three steps including the generation of test stereo-scopic image sets, subject perceptual experiment, and non-linear fitting model, which will be presented in detail in Section 3. We apply the proposed TAVT into the traditional 3D video encoder and then a novel TAVT-based stereoscopic video encoder is derived with the target of maintaining the perceptual quality of the stereoscopic video and a high bitrate saving. The pro-posed TAVT stereoscopic video encoder will be intro-duced in detail in Section 4.
3 Texture-based asymmetrical visibility threshold model
some details regarding the implementations are also pre-sented. Finally, to verify the validity and performance, the TAVT model is tested with natural stereoscopic im-ages at the end of this section.
3.1 Generation of test stereoscopic image set
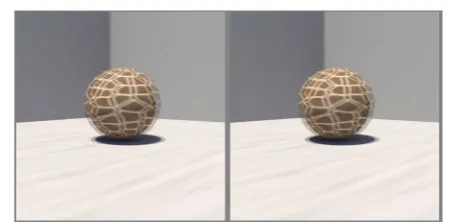
With natural stereoscopic images, it is difficult to derive a set of stereoscopic images in which only the texture changes, whereas other factors (color, background lumi-nance, disparity, and contrast) remain unchanged. Con-sequently, instead of using natural images to analyze the stereo-vision perceptual threshold, we use stereoscopic images with different textures generated by computer graphic software, i.e., three-dimensional modeling soft-ware Maya2015. In the experiments, we adopt a ball as the key object,Moriginal stereoscopic images are gener-ated with the same type of texture but with M rank densities, respectively. As such, the density of the ball in M original stereoscopic images varies from sparse to dense and the background is the same. These Maya-generated stereoscopic images are regarded the original stereoscopic images in our experiments. The left view images of four original stereoscopic images are shown in Fig.2.
To generate the distorted stereoscopic images, high ef-ficiency video coding software (HM14.0) [16] was used to encode the stereoscopic images with intra-frame
configuration. Stereoscopic image pairs were formed by asymmetrically encoding the left and right view images. First, N QP grades for left view (QPl) were selected to encode the left view of each original stereoscopic image. Second, for each QPl, we usedkQP grades for right view (QPr) to encode the right view of each original stereo-scopic image to obtain the encoded right view with dif-ferent levels of quality. The values of the kQPr grades were{QPl, QPl+δ, QPl+ 2δ,…, QPl+ (k−1)δ}, where δ was the interval of the right view encoding quantization parameter. Here,δis defined as follows:
δ¼ round QPmaxk−QPl
; QPl<QPmax−kþ1
1 ; otherwise
8 <
: ;
ð1Þ
where QPmax is the maximum quantization parameter. We set the QPmax as 51 in our experiment. A com-pressed stereoscopic image pair is first generated wherein the left and right views are compressed with the same QPl (denoted hereafter as the “reference
stereo-scopic image”). Then, we compressed the left view with a fixed QPland the right view with a QPrlarger than the
QPl. The two images were then combined into a new
stereoscopic image (denoted hereafter as the “degraded stereoscopic image”). Corresponding to one QPlgrade of
Fig. 2Left view of four original stereoscopic images with different textural density:a,b,canddrepresents different textural density rank, respectively. Fromatod, the texture density of "ball" increases gradually
each original stereoscopic image, a single reference stereoscopic image and (k-1) degraded stereoscopic im-ages were generated and classified as a stereoscopic image set for the paired comparison subjective experi-ment. Therefore, M×N groups of stereoscopic image sets were generated for the subjective experiment: M
original stereoscopic images corresponding to N QPl
grades. In this experiment, M is set to six, N is set to four,k is set to 13 and QPlis set to 20, 26, 32, and 38,
respectively.
For each original stereoscopic image, the average local variance (ALV) is used to evaluate the texture complex-ity. We define the texture complexity of an image as follows
TALV ¼
1
N
XH=8
i
X
W=8
j
signð Þ i;j σ2ð Þi;j
" #
; ð2Þ
where W represents the width of the original image, H
represents the height of the original image, respective-ly,(i,j) denote theith rowjth column 8 × 8 block in the original image, σ2(i,j) denotes the variance of the ith row jth column 8 × 8 block, Nrepresents the number of all 8 × 8 blocks’pixels in the target region which is easy to get by statistics, sign(i,j) denote sign function which indicate whether the block is in the target area, when the block is in the target area, the sign(i,j) value is 1, otherwise the value is 0. In the subjective experiments, the participants were asked to focus on the small ball as the target region, regardless of the unchanged image background, because only the texture density of the ball is changed and we could calculate ALV of the ball region to represent the texture complexity of the image. Furthermore, the average texture complexity of the stereoscopic image is defined as
TALV ¼g Tð ALVl;TALVrÞ ¼αTALVlþβTALVr; ð3Þ
whereTALVland TALVrdenote the complexity of the
tex-tural area in the left and right views, respectively,αand
βare scaling factors.
3.2 Subjective test environment and methodology In this paper, we applied the Paired Comparison Method (PCM) to study the asymmetrical visibility threshold. We simultaneously displayed two stereoscopic images on the projection screen [17], in which left view image was the same and the quality of right view image were different. Participants were asked to compare the two stereoscopic images with the same content and pointed out which of them is of higher subjective stereo quality. According to Recommendation ITU-R BT.500–11 [18], the experimental environment was conducted in a visual lab with ambient illumination, such that the color
temperature and ambient sound could be strictly con-trolled. Thus, we set the light illumination to less than 200 lx and the illumination of the background wall to less than 20 lx. We used Samsung’s UA65F9000AJ Ultra-HD stereo TV (65 in., 16:9, resolution 1920 × 1080) as the stereo display device. When watching the images, the participants wore shutter glasses at a viewing dis-tance of approximately four times the height of the screen (approximately 2.8 m).
There were 20 participants invited to take part in this experiment. The average age of them was 25 years old. Participants were non-expert and had almost no experi-ence in stereo visual subjective scoring. The visual acuity of all participants were normal or corrected, and all of them passed the color vision test [19]. Each participant scored the M×N groups of stereoscopic image sets. Comparison clips from each group are displayed on the stereo television side by side, as shown in Fig. 3. The sequences were displayed in random order. The ob-servers were asked to rank the quality of each compari-son clip on the screen. Each clip was displayed for 10 s, and the observers were given a 5 s break between clips.
For the sake of prudence, the observers ranked the im-ages by choosing between three options: the quality of the left stereoscopic image is better (denoted by “left better”), the right stereoscopic image is better (denoted by “right better”), or the quality of two images is the same (denoted by “comparable”). Observers were also instructed that when they could not determine which image was of higher quality within 15 s, it should be considered that the two stereoscopic images are compar-able, and that neither left better nor right better should be selected.
3.3 Definition of visibility threshold for asymmetrical coding
When the participant determined whether the subjective quality of the reference stereoscopic image is better than that of the test stereoscopic image, the participant is considered to have perceived the distortion; otherwise, there is no perceptible distortion. We define the critical noticeable point that half of the observers perceive
distortion while the other half do not (i.e., the probabil-ity of perceiving distortion is 50%). We denote the corre-sponding QPr for the right view at the critical observation point as QPTh. Because QPTh may be not necessarily identical to the QPr value used in the experi-ment, we calculated QPTh with linear interpolation, as follows:
QPThjP¼50%¼
QPαPβ−0:5þQPβð0:5−PαÞ
Pβ−Pα ; ð4Þ
where point α is the case that is closest to the critical observation point but the corresponding probability of perceiving distortion (Pα) is less than 50% in subjective
experiment, pointβis the case that is closest to the crit-ical observation point but the corresponding probability of perceiving distortion (Pβ) is larger than 50% in
sub-jective experiment, QPα and QPβ, respectively refer to
the corresponding quantization parameter of the right view forαandβ.
Moreover, we define QPTAVTas the difference between QPTh and QPl at the critical observation point. Here, QPTAVTrefers to the asymmetrical visibility threshold of the quantization parameters, revealing the visibility threshold for the right view with respect to the left view
QPTAVT¼QPTh−QPl: ð5Þ
3.4 Experimental data analysis and non-linear fitting model
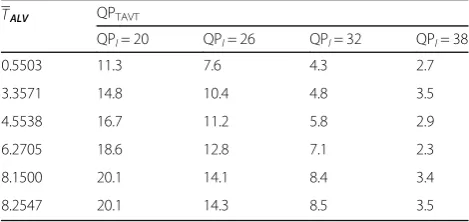
After conducting the subjective experiment and per-forming statistical analysis on the results, the M×N QPTAVT threshold values are obtained for different tex-ture complexities from varying QPlvalues. The QPTAVT values are summarized in Table1. The value ofTALV
re-fers to the average texture complexity of each original stereoscopic image.
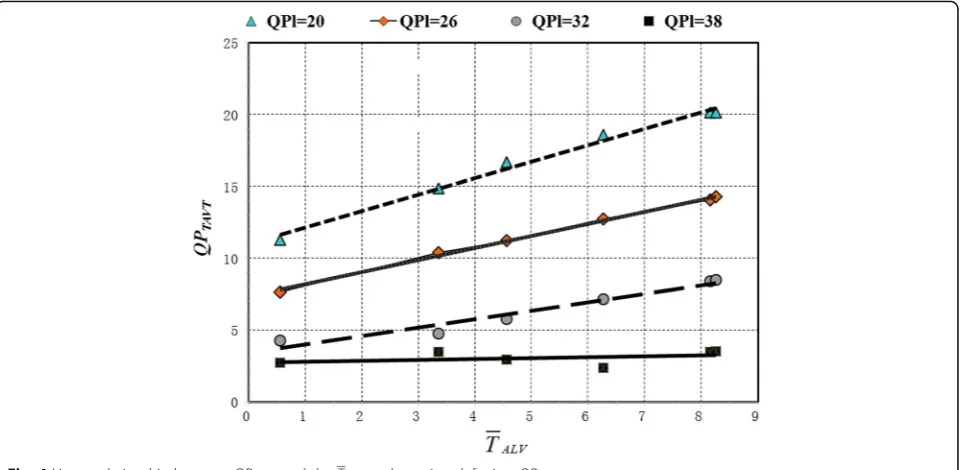
Given the linear fitting relationship between QPTAVT and the TALV under different QPl values, we have the following three key observations.
1) As shown in Fig.4, there is a strong correlation between QPTAVTand the texture complexity. An increase in the complexity of the texture results in a corresponding increase in the threshold of the QPTAVT.
2) When QPlis 20, 26, or 32, QPTAVTandTALV exhibited an approximate linear relation that increased monotonically, with the three sets of curves showing a similarly parallel relation. Thus, it can be concluded that when the left view
quantization parameter is lower, the linear
relationship between the perceptual threshold value QPTAVTand the texture complexity is approximate. Given a certain texture complexity, the smaller the QPlis, the greater the perceptual threshold value QPTAVTbecomes. This means that, for any given texture complexity, when the left view quantization parameter value is lower, the threshold value of tolerance is higher. This is mainly due to the superior quality of the left view image. Even when the right view image is distorted more seriously, the subjective perception of the stereoscopic image quality will not be affected.
3) When QPlis 38, the range of QPTAVTvaried between 2 and 4. Therefore, there is no obvious linear relationship between the perceptual threshold and the texture complexity when the left view image has a large QP (i.e., low quality). This is mainly because the significant degradation of the left image is caused from higher encoding
quantization parameters and in this case the effect of stereoscopic masking decreased rapidly. Therefore, the distortion will be easily detected when the quality of the right view image is greatly reduced.
Finally, with two-order non-linear fitting of the QPTAVT data in Table 1, the formula for TAVT model used to describe the relationship between QPTAVT,TALV,
and QPlis given as follows:
QPTAVT¼ f TALV;QPl
¼aþbTALVþcQPlþd TALV
2
þeTALVQPlþf
QPl2: ð6Þ
Furthermore, the coefficient of the recommended values and 95% confidence intervals are shown in Table 2, which mathematically described the TAVT model.
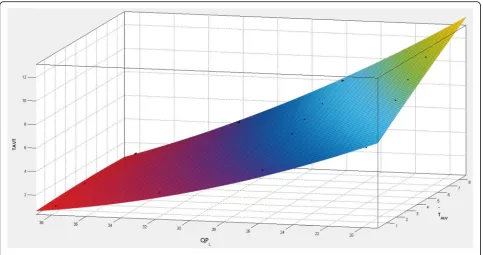
The diagram of TAVT model are shown in Fig. 5, which intuitively revealed the fact that, QPTAVTis posi-tively correlated with theTALV, given a certain QPl. This means that for each block in the stereoscopic images,
Table 1QPTAVTvalues with varying texture complexities based
on QPl
TALV QPTAVT
QPl= 20 QPl= 26 QPl= 32 QPl= 38
0.5503 11.3 7.6 4.3 2.7
3.3571 14.8 10.4 4.8 3.5
4.5538 16.7 11.2 5.8 2.9
6.2705 18.6 12.8 7.1 2.3
8.1500 20.1 14.1 8.4 3.4
the asymmetrical threshold can be calculated by the TAVT model as long as the texture complexity is obtained.
3.5 Verification and evaluation of TAVT model with natural stereoscopic images
To test validity and evaluate the performance of the TAVT model, we designed three experiments in this sec-tion. In the first experiment, the reliability and validity of the TAVT model to the natural stereo images was proved by using subjective experiments. In the second experiment, the QP threshold symmetric and asymmet-ric coding was compared and analyzed to demonstrate the advantages of the TAVT model. In the third experi-ment, the coding performance using TAVT model for stereoscopic images was tested, thus proving that the model can saves more bitrates of stereoscopic images under the same subjective quality.
3.5.1 The reliability and effectiveness test for TAVT model To test validity and effectiveness of the proposed TAVT model on natural stereoscopic images, the same PCM subjective experiment as above (Section 3.2) has been performed for 30 natural stereoscopic images as shown in Fig. 6. The 30 pieces of natural stereoscopic images include 19 stereoscopic images in NBU 3D IQA database [20] and 11 pieces of randomly selected stereoscopic frames from several stereoscopic test sequences, such as the 1st/100th/158th/247th/493rd frame of the Balloons sequence, the 2nd/47th/92nd/126th/178th/277th frame of the Newspaper sequence.
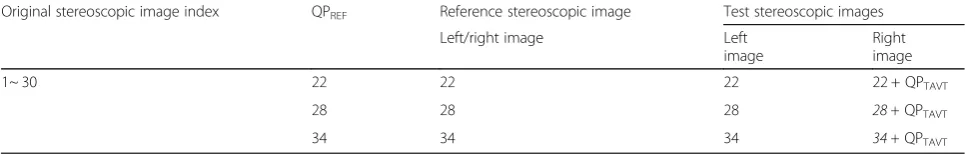
The reference stereoscopic image was obtained by using symmetric intra coding with the base QPREF. The test stereoscopic image was obtained by asymmetric intra coding, wherein the coding QP of left view was the same as the reference image with QPREF, while the cod-ing QP of right view was determined by QPREFand the TAVT model. For the right view of test stereoscopic image, by analyzing and calculating the texture complex-ity of each largest coding unit (LCU), the QPTAVT threshold of the corresponding LCU was obtained by the TAVT model, and then QP of each LCU was adap-tively adjusted based on QPREF. Corresponding to refer-ence stereoscopic image, a single test stereoscopic image were generated and classified as a comparison clip for the paired comparison subjective experiment. Consider-ing the subjective experiment completeness and work-load, three basic QPREFs were selected, namely, 22, 28, 34, used for performance measurement model in differ-ent quality levels. Therefore, 90 groups of comparison clips were generated for the experiment. Details of the
Fig. 4Linear relationship between QPTAVTand theTALVunder various left view QPl
Table 2Coefficient of the recommended values and 95% confidence intervals
Model parameters Recommended values 95% confidence intervals
A 30.05 (24.86, 35.24)
B 2.355 (1.89, 2.819)
C −1.211 (−1.564,−0.8588)
D 0.0007561 (−0.03232, 0.03383)
E −0.05863 (−0.07037,−0.0469)
F 0.01265 (0.006686, 0.01861)
Fitting performance R-square 0.9942
Fig. 5TAVT model
selection of QP for subjective experiment are shown in Table3.
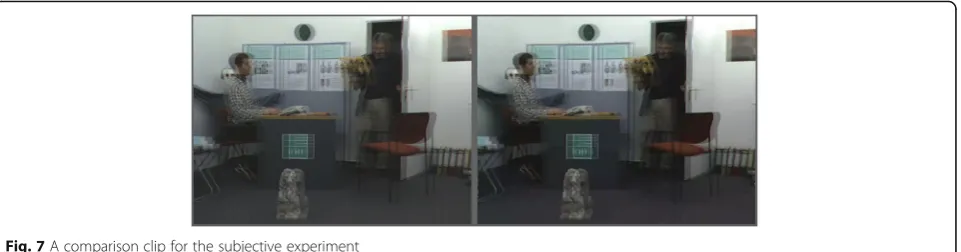
Following the subjective experiment standard [17,18], 50 observers (nine of them were with average three-dimensional subjective scoring experience and the rest were naive) were invited to the subjective evaluation of the image quality. On each trial of the experiment, ob-servers watched two stereoscopic images of each com-parison clip. Observers were then given time to vote on the comparative quality of two stereoscopic images using quality comparison scales, shown in Table 4, where “0” indicates the two stereoscopic images are with the same perceptual quality and “1” indicates that they are differ-ent. The subjective experiments were strictly imple-mented. Figure 7 shows the subjective test screen for one comparison clip, where the left and right images are randomly placed reference or test stereoscopic images. In addition, the comparison clips were played also ran-dom order.
Table 5 shows the statistical and analytical results of this subjective experiment. Fifty observers participated in the subjective experiment. Each observer scored 90 comparison clips. Statistically, each scoring trial is inde-pendent and irrelevant. In the 4500 scoring trials, there are 4478 scoring trials having the comparison scale ‘0’ which means that the observer considered the subjective qualities of the two images were the same. There were only 22 scoring trials that the observers considered the subjective qualities of the reference and test images are different. That is to say, the effective rate of the TAVT model is 99.51%.The proportion of scoring ‘1’accounted for 0.49%, which can be considered a small probability event that is almost impossible to happen in one experi-ment. Furthermore, the statistical mean of all scoring re-sults is 0.005, approaching zero indefinitely. The confidence interval for the statistical mean is [0.0030, 0. 0070], of which the confidence level is 1-α. In statistics,
α reflects the significance level and the value is 0.05 in this paper. The subjective quality of the test stereoscopic
images with asymmetric TAVT model coding is infinitely close to that with symmetric coding, thanks to the stereoscopic visual masking effect. Therefore, the TAVT model shows its effectiveness and reliability through this subjective experiment.
3.5.2 Comparison and analysis of QP threshold for symmetric and asymmetric coding
Traditional JND researches have shown that, due to the masking effect of the image [10–12], bitrate can be re-duced without causing a subjective quality degradation when working within the JND range. This means that even if the asymmetric stereoscopic masking effect is not taken into account, as long as a larger QP is used to symmetrically encode the image in a certain range of JND, human eyes are still unable to observe the subject-ive quality changes of degraded reconstructed images. Since this effect always exists when we observe the image, so we need to conduct experiments to analyze the threshold of the symmetric encoding which just increases QP symmetrically. If the symmetric threshold is less than the proposed asymmetric threshold, the pro-posed TAVT model is superior to symmetric coding, otherwise, the proposed TAVT model has no obvious advantages and practical application value. Therefore, through this experiment, we compare the QP threshold of symmetric coding with the asymmetric threshold.
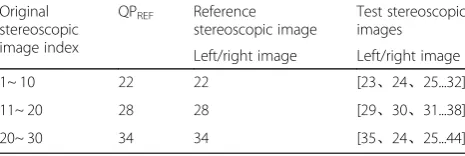
The subjective experiment was carried out as similar as Section 3.5.1, with same experimental environment, same natural stereoscopic image set as shown in Fig. 6 and 35 observers were invited to the subjective experi-ment. Both the reference images and the test images were obtained by using symmetric intra coding. For each original image, we encode the original image with QPREF to obtain a reference image of a certain quality grade. Corresponding to this reference stereo image, we obtained 10 different degraded stereoscopic images by using 10 levels of QP encoding for the original image. The 10 levels of QP were QPREF+ 1、QPREF+ 2... QPREF + 10. Therefore, corresponding to one original stereo-scopic image, a single reference stereostereo-scopic image and 10 degraded stereoscopic images were generated and classified as a stereoscopic image set for the paired com-parison subjective experiment. Therefore, 30 groups of stereoscopic image sets were generated for the subjective
Table 3The selection of QP for subjective experiment
Original stereoscopic image index QPREF Reference stereoscopic image Test stereoscopic images
Left/right image Left
image
Right image
1~ 30 22 22 22 22 + QPTAVT
28 28 28 28 +QPTAVT
34 34 34 34 +QPTAVT
Table 4Comparison scales for subjective quality evaluation
Comparison scale The meaning of comparison scale
0 The subjective quality of two images is same
experiment. To compare with the TAVT model and tak-ing into account the completeness and workload of sub-jective experiments, 3 QPREFs were adopted to evaluate JND of symmetric encoding quantization parameters (QPSE_JND), which takes 22, 28, and 34, respectively. The selection of QP for subjective experiment is shown in Table6.
The procedure of the subjective experiment was also similar to that in Section 3.2. Comparison clips of each group were displayed on the stereo television side by side. Each observer should compare the reference image with the test image of each comparison clips and made his/her decision. The observer ranked the images by choosing among three options: “left better,” “right bet-ter,” or “comparable.” To avoid visual inertia, the refer-ence image and the test image were displayed in random order. Through data statistics and analysis on all subject-ive scoring data, we finally obtained QPSE_JND of each group of stereoscopic image set, as shown in Table7.
As can be seen from Table7, there is indeed a masking effect inside the image. When base QPREF is small, the QPSE_JND is relatively large. But as QPREF increases, the QPSE_JND decreases. Taking the fifth stereoscopic image set as an example, for the reference image coded with QPREF= 22, QPSE_JND for the test image can reach 3.94. This means that the observers cannot perceive the dif-ference of subjective quality between the redif-ference image and the corresponding test image if QP of the test one is less than 25.94.
In addition, we calculated the average QPTAVTof right image for test stereo image, calculated by the TAVT model. As mentioned above, there is a corresponding QPTAVT value for each LCU by the TAVT model. In order to facilitate the analysis, the average QPTAVT is represented by the mean of QPTAVTvalue of all LCUs in
the right image for test stereo image. After calculation and statistics, the average QPTAVTof each group stereo-scopic image set is shown in Table8.
As can be seen from Table 8, when base QPREF is small and images are of high quality, the average QPTAVT is large. As the base QPREFincreases, the aver-age QPTAVT decreases. For the fifth test stereo image, when using asymmetric encoding, if QP of the left view is 22, the average QPTAVTfor the right image can reach 10.13, which means the QP of the right image can be up to 32.13 on average. Even so, the subjective quality deg-radation can hardly be perceived according to the TAVT model, benefiting from the stereoscopic visual masking effect.
By further comparison of two kinds of thresholds in Table 7 and Table 8, it is easy to find that, for each group of stereoscopic image set, the symmetric thresh-old (statistical mean of QPSE_JND in Table 7) was less than the corresponding asymmetric threshold (average QPTAVT in Table8) on the whole. When QPREF is rela-tively small, the gap between two thresholds is large. When the QPREFincreases, the gap becomes smaller but the average QPTAVT is still larger than QPSE_JND. This means that when encoding a stereoscopic image, the TAVT model using asymmetric encoding can tolerate greater perceptual distortion than symmetric coding without perceptual quality of the stereoscopic image degradation. Therefore, the proposed TAVT model has obvious advantages over the symmetric coding method.
3.5.3 Coding performance using TAVT model for stereoscopic image
To further evaluate TAVT performance, we test coding performance over natural stereoscopic image set as shown in Fig. 6 with Intra-frame coding. Four QPBASEs
Fig. 7A comparison clip for the subjective experiment
Table 5The comparative subjective quality evaluation results Number of
observers
Comparison clips for each observer
Total number of scoring trials
Comparison scale
Number of scoring trials
Proportion Statistical mean
95% confidence interval for statistical mean (α= 0.05)
50 90 4500 0 4478 99.51% 0.005 [0.0030, 0.0070]
are selected for coding the stereoscopic images, which are 22, 27, 32, and 37, respectively. Two adopted coding schemes are as follows:
Sym: symmetric coding.
Asym-TAVT: asymmetric coding in which the QP of left view is QPBASEwhile the coding QP of each LCU for right view is determined by QPBASEand the TAVT model.
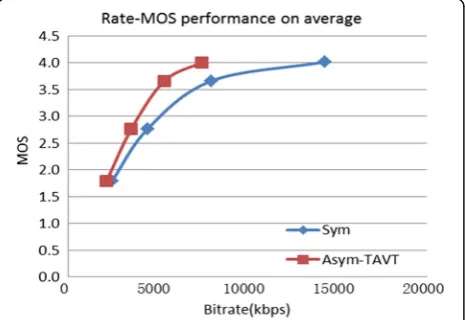
Following the subjective experiment standard [17,18], subjective experiment on validating and evaluating the TAVT model was implemented. The experimental envir-onment was the same as the Section 3.5.1, and 35 observers were invited for subjective experiment. According to the quality of the broadcasting stereo-scopic images, the subjective experiment observers gave their subjective scores after viewing each image, and then the Mean Opinion Score (MOS) was obtained for each test stereoscopic image. The obtained subjective scoring criteria are presented in Table9. To evaluate the efficiency of the proposed scheme, we used the Bjonte-gaard delta bitrate based on MOS (BDBRMOS) to indi-cate bitrates comparison under the same subjective quality. Finally, based on all of test stereoscopic images, the bitrates coded by two schemes, statistical mean of MOS and BDBRMOSare illustrated Table10.
Table10shows that, with the same QPBASE, the bitrate required for asymmetric coding scheme with TAVT is much less than symmetric coding scheme, especially for small QPBASE. BDBRMOS indicates the bitrate savings of the TAVT asymmetric coding method compared with the symmetric coding method, with the same subjective quality. From Table 10, TAVT asymmetric coding method can achieve 24.1% bitrate saving on average.
The Rate-MOS curves in Fig. 8 more intuitively illus-trate the improvement of coding performance of TAVT asymmetric coding method. It can be seen that, com-pared with the symmetric coding method, the TAVT asymmetric coding method can achieve better Rate-MOS coding performance.
Therefore, even the TAVT model is derived from the unnatural stereoscopic images, it is proved to be effect-ive through masseffect-ive tests on natural stereoscopic images. TAVT model provides a more accurate JND profile in the human visual systems (HVS), since it is capable of exploiting stereo masking properties of human eyes without jeopardizing the visual quality. By analyzing the texture complexity of image blocks, the asymmetric cod-ing perceptual threshold can be calculated accurately, through which the bitrate of right view can be greatly saved while the subjective quality of the stereoscopic image is not reduced. Perceptual redundancy is further removed, mainly because of the due consideration of the
Table 6The selection of QP for subjective experiment
Original stereoscopic image index
QPREF Reference stereoscopic image
Test stereoscopic images
Left/right image Left/right image
1~ 10 22 22 [23、24、25...32]
11~ 20 28 28 [29、30、31...38]
20~ 30 34 34 [35、24、25...44]
Table 7QPSE_JNDof each group of stereoscopic image set for
symmetric coding
QPREF The index 30 groups of stereoscopic image sets
statistical mean of QPSE_JND
95% confidence interval for statistical mean of QPSE_JND (α= 0.05)
22 1 4.14 [4.02, 4.26]
2 4.26 [4.11, 4.41]
3 4.31 [4.15, 4.47]
4 4.51 [4.34, 4.68]
5 3.94 [3.86, 4.02]
6 4.54 [4.37, 4.71]
7 4.43 [4.26, 4.60]
8 4.46 [4.29, 4.63]
9 4.34 [4.17, 4.51]
10 4.40 [4.23, 4.57]
28 11 2.63 [2.46, 2.80]
12 2.29 [2.13, 2.45]
13 2.43 [2.26, 2.60]
14 2.23 [2.08, 2.38]
15 2.71 [2.55,2.87]
16 2.69 [2.53, 2.85]
17 2.86 [2.74, 2.98]
18 2.34 [2.17, 2.51]
19 2.74 [2.59, 2.89]
20 2.37 [2.20, 2.54]
34 21 1.17 [1.04, 1.30]
22 1.31 [1.15, 1.47]
23 1.97 [1.87, 2.07]
24 1.03 [0.97, 1.09]
25 1.94 [1.86, 2.02]
26 1.43 [1.26, 1.60]
27 1.77 [1.62, 1.92]
28 1.34 [1.17, 1.51]
29 1.11 [1, 1.22]
compound masking effect. Consequently, TAVT model can be applied to further improve coding efficiency for stereoscopic video encoder.
4 The proposed TAVT-based stereoscopic video encoder
It is well known that stereoscopic video coding scheme adopts a classical HBP architecture, which improves the time scalability and efficiency of coding compression [21,22]. In addition, a variable quantization of asymmet-ric coding strategy is used in HBP coding architecture. However, in HBP architecture, the entire frame is encoded with a single QP, and the characteristics of video content does not taken into consideration with arbitrary frames for the different local texture, bright-ness, and contrast differences [23]. In this section, we proposed a novel TAVT-based stereoscopic video en-coder, which can adjust QP value adaptively based on the texture complexity of each LCU.
4.1 TAVT-based stereoscopic video encoder
As shown in Fig.9, the left view frame adopts the trad-itional independent view coding method, while the right view frame can be encoded by the proposed asymmetric coding scheme. Firstly on-line calculate the LCU texture complexity and obtain the maximum tolerable QPTAVT threshold, then adaptively adjust QP of the right view coding, and finally execute dependent view coding. In
this framework, a key extension of TAVT model for HBP is deduced in Section 4.2.
4.2 Extension of TAVT model for HBP
The TAVT model is induced by intra coding image, which means that the model is suitable for intra frame coding. However, the inter frame coding method based on HBP coding architecture is more common and prac-tical proposal in stereoscopic video coding. Different from intra frame coding, a large number of motion esti-mation and disparity estiesti-mation are used in HBP coding framework. In this section, we have given the extension the TAVT model to the inter frame model, which makes the model more suitable for HBP architecture.
Assume that we have a uniform quantization step Q, the encoded distortion caused by quantization can be theoretically modeled [24] as
D Qð Þ ¼X þ∞
i¼−∞
Z
iþ0:5 ð ÞQ
i−0:5 ð ÞQ
u−C ið Þ
j j2
fUð Þu du; ð7Þ
whereuis the original input signal,Qis the quantization step size. C(i) is the reconstructedu value derived after quantization and inverse quantization, fU(u) denotes the
probability density function.
The transformed residuals for HEVC assumes Lapla-cian distribution with the zero mean [25], which can be presented as
fUð Þ ¼u λ
2e
−λj ju; ð8Þ
where λ¼pffiffiffi2=σ is the parameter of Laplacian distribu-tion, σ is standard deviation of the transformed residuals.
From Eq.(7) and Eq. (8), the encoded distortionD(Q) is [26].
Table 8Average QPTAVTof each group stereoscopic image set
QPREF The index 30 groups of stereoscopic image sets
Average QPTAVT
QPREF The index 30 groups of stereoscopic image sets
Average QPTAVT
QPREF The index 30 groups of stereoscopic image sets
Average QPTAVT
22 1 10.47 28 11 7.43 34 21 3.39
2 11.24 12 6.46 22 3.45
3 10.7 13 7.04 23 4.34
4 11.96 14 6.35 24 3.46
5 10.13 15 7.18 25 4.38
6 11.35 16 7.39 26 3.43
7 11.79 17 7.43 27 4.49
8 11.84 18 6.41 28 3.32
9 10.41 19 7.42 29 3.77
10 11.62 20 6.29 30 4.09
Table 9Subjective scoring criteria
Video quality Subjective score
Excellent 5
Good 4
Fair 3
Poor 2
D Qð Þ ¼X þ∞
i¼−∞
Z
iþ0:5 ð ÞQ
i−0:5 ð ÞQ
u−C ið Þ j j2 1ffiffiffi
2
p σe
−pffiffi2
σj judu; ð9Þ
In [26], Eq. (9) is further simplified as
D Qð Þ≈gσ2;Q¼ σ 2Q2
12σ2þQ2¼ Q2
12þQ2=σ2: ð10Þ
D (Q)is a function ofσ2and quantization stepQ. Therefore, for I frame intra coding, distortion can be expressed as
DIð ÞQI ≈g σI2;QI
¼ QI2
12þQI2=σ I2
; ð11Þ
where QIis quantization step size inI frame intra
cod-ing,σI2is the variance of the transformed residuals in I
frame intra coding.
For B/P frame inter coding, distortion can be expressed as
DBPðQBPÞ≈g σBP2;QBP
¼ QBP2
12þQBP2=σBP2
; ð12Þ
where QBP is quantization step size in B/P frame inter coding,σBP2is the variance of the transformed residuals in B/P frame inter coding.
In coding experiments, if we want to maintain the same distortion for different coding types(I/B/P frame coding), the equation is established as follows:
DIð Þ ¼QI DBPðQBPÞ: ð13Þ
The conversion relationship between QBP and QI can be obtained as follows:
QBP2¼ f QI;σI2;σBP2
¼ 12QI2
12−QI2ð1=σBP2−1=σI2Þ
: ð14Þ
The value of σI2 and σBP2 can be easily obtained by coding statistics. SinceQ isquantization step and can be written as
Q¼2ðQP−4Þ=6: ð15Þ
From Eq. (14) and Eq. (15), conversion between B/P frame quantization parameters and Iframe quantization parameter can be re-written as
QPBP¼h QPI;σI2;σBP2
¼3 log2 122
QPI−4
ð Þ=3
12−2ðQPI−4Þ=3 1=σ
BP2−1=σI2
ð Þ
þ4; ð16Þ
where QPBP is quantitative parameters by using B/P frame inter encoding, QPIis quantitative parameters by
usingIframe intra encoding. From Eq. (16), the percep-tual coding thresholdQPBPof B/P frame can be obtained from the corresponding perceptual threshold QPI used
in the intra frame encoding.
From Eq. (6) and Eq. (16), the I frame quantization threshold QPTAVT can be converted B/P frame quantization threshold and can be re-written as
QPTAVT BP¼h QPTAVT;σI2;σBP2
¼3 log2 122
f Tð ALV;QPlÞ−4
ð Þ=3
12−2ðf Tð ALV;QPlÞ−4Þ=3 1=σ
BP2−1=σI2
ð Þ
þ4;
ð17Þ
whereQPTAVT_BPis quantitative threshold used for B/P-frame inter encoding, QPTAVT is quantitative threshold ofIframe intra encoding and can be calculated from Eq.
Table 10Rate-MOS performance of two schemes
QPBASE Sym Asym-TAVT BDBRMOS
Bitrate (kbps) statistical mean of MOS Bitrate (kbps) Statistical mean of MOS
22 14,300.43 4.019 7463.70 4.012 −24.1%
27 7990.23 3.664 5371.80 3.664
32 4437.12 2.767 3521.98 2.762
37 2450.98 1.796 2142.02 1.790
(6). Therefore, when inter-frame coding is performed, we can compute the inter coding threshold QPTAVT_BP by Eq. (17) very easily, which is more suitable for HBP coding architecture.
5 Experimental results and discussions on TAVT-based stereoscopic video encoder
The recent HEVC-based video coding reference software HTM13.0 was utilized to evaluate the proposed asym-metric stereoscopic coding schemes. The detailed infor-mation of the test sequences is provided in Table11. Six stereoscopic video sequences with various motion prop-erties and camera arrangement, including Kendo, GT_ Fly, Poznan_Street, Poznan_Hall2, Shark, Undo_Dancer, various motion properties, and camera arrangement are adopted, as shown in Table11. The number of frames in each sequence is 200~ 300, and two views of the se-quences are selected for encoding. All the experiments were defined under the common test conditions (CTC) random access configuration [27]. Test conditions were set as follows: HEVC codecs were configured with 8 bit data processing and HBP coding architecture, the max-imum coding CU has a fixed size of 64 × 64 pixels, and a maximum CU depth level of 4, resulting in a minimum CU size of 8 × 8 pixels. Intra frame period was 24 and GOP length was 8. The search range of motion estima-tion was configured with 64, four base QP values, 22, 27, 32, and 37 were used in our experiments. For each sequence, 100 frames were encoded for each view.
5.1 Performance on bitrate saving
In order to objectively measure how the proposed method affects 3D-HEVC performance, three schemes were conducted as given below:
Scheme I: original HTM HPB-based stereoscopic video coding.
Scheme II: stereoscopic video coding with VT model in Wang [8].
Scheme III: proposed TAVT-based stereoscopic video coding.
The performance comparison of the three schemes in right view bitrate saving is shown in Table 12. Let scheme I be a benchmark, we can obtain the saving per-centage of the schemes II and III with respect to scheme I, where bitrate saving between the original HTM encoder and compared algorithms are com-puted as
ΔR¼ðRHTM−RÞ=RHTM100½ %; ð18Þ
where R is bitrate of compared algorithms scheme,
RHTMis bitrate of the original HTM, i.e., scheme I. From Table 12, we can see that scheme II saves bitrate by 1.90 to 26.81% (12.43% on average), while scheme III saves bitrate by 0.06 to 33.95% (14.30% on average).The bitrate saving of scheme III is 1.87% higher than that of scheme II. Therefore, the pro-posed coding scheme III can achieve a higher bitrate saving, especially for smaller QP. When base coding quantization parameter QP is 22, scheme III can achieve bitrate saving ranging from 26.63 to 46.53% (33.95% on average), while scheme II saving bitrate ranging from 19.84 to 39.64% (26.81% on average). This is because when base QP is smaller, reconstruc-tion quality of the left view is better after encoding, which can tolerate more deterioration of reconstruc-tion quality for right view. Compared to a single uni-fied QP threshold of the scheme II, the scheme III
Fig. 9The proposed TAVT-based stereoscopic video encoder
Table 11Detailed information of test sequences
Sequences Provider Input view Video characteristic
Kendo Nagoya University 3–4 1024 × 768, 30fps, 300 frames
GT_Fly Nokia 1–5 1920 × 1088, 25fps, 250 frames
Poznan_Street Poznan University 3–4 1920 × 1088, 25fps, 250 frames
Poznan_Hall2 Poznan University 5–6 1920 × 1088, 25fps, 200 frames
Shark NICT 1–5 1920 × 1088, 25fps, 300 frames
analyses the texture complexity for each coding CU and adaptively adjusts the QP for the right view based on TAVT model. According to the results, when QP increased, the left view coding quality is re-duced, and the stereoscopic masking effect is no lon-ger significant. Therefore, the stereo visual perception redundancy is reduced accordingly. The quantitative threshold value obtained by scheme III is gradually close to the threshold obtained by scheme II, so the saving bitrate is gradually approaching.
By further analyzing the rate saving performance of three coding schemes in Table 12, we found that the bitrate savings performance is great difference for dif-ferent test sequences. In Poznan_Street sequences (abundant texture, static background, and foreground with slow motion) and Undo_Dancer sequences
(abundant texture, little parallax, and scene with slow motion), the bitrate saving percentage is 46.53 and 42.31% (with base QP = 22). In Poznan_Hall2 se-quences (abundant flat region, large parallax) and Kendo sequences (violent scene movement), the bitrate saving percentage is 27.40 and 26.63% (with base QP = 22). Therefore, the proposed coding algo-rithm of scheme III is more suitable for those se-quences in which the texture are abundant and the scene move slowly with little parallax.
5.2 RD performance evaluation of objective quality Setting scheme I as the benchmark, the rate-distortion (RD) performances of schemes II and III are shown in Table 13. Not only the classical objective quality evalu-ation metric PSNR but also structural similarity index
Table 12The comparison of the bitrate saving performance of the three coding schemes
3D sequences QP Bitrate (kbps) ΔR(%)
Scheme I Scheme II Scheme III Scheme II Scheme III
Kendo 22 314.436 242.407 230.693 22.91 26.63
27 119.424 105.175 103.666 11.93 13.20
32 54.826 51.262 51.770 6.50 5.57
37 29.071 28.464 29.078 2.09 −0.02
GT_Fly 22 835.426 614.126 557.582 26.49 33.26
27 246.536 202.960 200.020 17.68 18.87
32 77.578 73.986 74.084 4.63 4.50
37 31.876 31.570 31.914 0.96 −0.12
Poznan_Street 22 1698.762 1025.426 908.394 39.64 46.53
27 384.906 304.574 295.814 20.87 23.15
32 127.966 117.668 118.514 8.05 7.39
37 52.350 50.872 52.176 2.82 0.33
Poznan_Hall2 22 656.564 491.244 476.698 25.18 27.40
27 195.836 168.718 169.342 13.85 13.53
32 83.378 78.420 79.860 5.95 4.22
37 41.812 40.870 41.820 2.25 −0.02
Shark 22 1101.391 882.893 797.345 19.84 27.61
27 433.618 386.830 374.455 10.79 13.64
32 183.406 174.151 174.970 5.05 4.60
37 84.002 82.778 83.846 1.46 0.19
Undo_Dancer 22 1525.504 1116.582 880.100 26.81 42.31
27 479.224 406.590 371.424 15.16 22.49
32 173.054 163.408 159.410 5.57 7.88
37 74.432 73.076 74.434 1.82 0.00
Average 22 26.81 33.95
27 15.05 17.48
32 5.96 5.69
37 1.90 0.06
measurement (SSIM) is used to evaluate video quality in this paper. Compared with PSNR, SSIM is found to be a better indicator of perceived image quality than mean-squared error which is the theoretical basis of PSNR [28, 29]. PSNR and SSIM value of six reconstructed video sequences with different QP are shown in Table 13. Bjontegaard delta bitrate based on PSNR (BDBRPSNR) and Bjontegaard delta bitrate based on SSIM (BDBRSSIM) are adopted to illustrate RD performance separately.
As can be seen from the Table 13, the BDBRPSNR of scheme II ranges from −0.8 to −9.5%, while the BDBRPSNRof scheme III ranges from 1.0 to−13.4%. The average BDBRPSNR of scheme III is −5.7%, which is slightly inferior to scheme II with −5.8% of average BDBRPSNR gain. However, the BDBRSSIM of scheme II ranges from −0.9 to −9.4%, while the BDBRSSIM of scheme III ranges from−0.7 to −12.0%. BDBRSSIM per-formance of scheme III is superior to scheme II and the average BDBRSSIM of two schemes is −6.7 and−5.9%.
By further analyzing the RD data in Table 13, the bad RD performance (BDBRPSNRand BDBRSSIM) of Poznan_ Hall2 sequence affect the overall scheme III RD per-formance greatly. The BDBRPSNRand BDBRSSIMdegrades of scheme III in Poznan_Hall2 and Kendo sequence mainly due to their sequence characteristic (large paral-lax and abundant flat region in Poznan_Hall2 and vio-lent scene motion in Kendo) which cause the estimated TAVT value inaccurate and smaller. Comprehensively analyzed the rate distortion performance of the two schemes, the RD performance of scheme III is better than scheme II. Different from single view video, stereo-scopic video quality is also affected by the binocular per-ception. Because the human eye is the final receptor of the video, the subjective evaluation results are more accurate than objective evaluation results to reflect the quality of reconstructed stereoscopic video. In order to make a more accurate comparison of the three schemes, a perceptual evaluation experiment is carried out in the following section.
Table 13SSIM value of six reconstructed video sequences under different QP
3D sequences QP Scheme I Scheme II Scheme III Scheme II Scheme III
PSNR SSIM PSNR SSIM PSNR SSIM BDBRPSNR BDBRSSIM BDBRPSNR BDBRSSIM
Kendo 22 43.92 0.9841 43.62 0.9837 43.41 0.9835 −5.1% −5.6% −3.3% −4.6%
27 42.00 0.9810 41.85 0.9808 41.78 0.9807
32 39.69 0.9763 39.61 0.9762 39.61 0.9762
37 37.20 0.9694 37.17 0.9694 37.19 0.9694
GT_Fly 22 41.28 0.9672 41.09 0.9666 41.01 0.9665 −9.1% −9.4% −9.6% −10.4%
27 39.31 0.9555 39.24 0.9552 39.23 0.9552
32 37.48 0.9434 37.47 0.9433 37.47 0.9433
37 35.60 0.9281 35.59 0.9281 35.60 0.9281
Poznan_Street 22 40.03 0.9604 39.49 0.9569 39.21 0.9560 −3.5% −5.6% −1.3% −5.7%
27 38.39 0.9488 38.15 0.9475 38.08 0.9474
32 36.56 0.9321 36.46 0.9314 36.47 0.9316
37 34.63 0.9112 34.61 0.9112 34.63 0.9113
Poznan_Hall2 22 42.18 0.9655 41.96 0.9642 41.88 0.9641 −0.8% −0.9% 1.0% −0.7%
27 41.33 0.9619 41.20 0.9614 41.18 0.9615
32 40.12 0.9574 40.04 0.9572 40.07 0.9573
37 38.59 0.9513 38.56 0.9512 38.58 0.9513
Shark 22 42.42 0.9828 42.23 0.9824 42.04 0.9822 −7.1% −6.2% −7.8% −7.0%
27 39.62 0.9729 39.56 0.9727 39.52 0.9727
32 36.81 0.9573 36.79 0.9572 36.79 0.9572
37 34.16 0.9357 34.16 0.9357 34.16 0.9357
Undo_Dancer 22 39.79 0.9702 39.53 0.9693 39.24 0.9687 −9.5% −8.0% −13.4% −12.0%
27 37.02 0.9492 36.95 0.9488 36.90 0.9486
32 34.51 0.9169 34.49 0.9167 34.49 0.9168
37 32.21 0.8711 32.21 0.8709 32.21 0.8710
5.3 Rate-MOS performance of subjective perception quality assessment
A subjective quality evaluation method of Double Stimu-lus Continuous Quality Scale (DSCQS) video quality is used to evaluate the reconstructed video quality [17]. Following the subjective experiment standard [18], 35 observers (six of them are with 3D video subjective scor-ing experience and the rest are naive) are invited to the subjective perception quality assessment of recon-structed stereoscopic video. In the scoring process, five labels,“excellent,” “good,” “fair,” “poor,” and“bad” corre-sponding to score 5 to 1, were given to quantify the quality of each test video. According to the quality of the broadcasting video, the subjective experiment ob-servers gave the corresponding subjective scores and fi-nally get MOS for each test video. Through statistics and calculation, the statistical mean of MOS, 95%
confidence interval for statistical mean of MOS and BDBRMOSare illustrated Table14.
The proposed scheme III can achieve better BDBRMOS performance ranging from −6.6 to −11.4%, while the BDBRMOSof scheme II ranges from 0.4 to−3.0%. With-out the subjective quality degradation for these sequences, the average BDBRMOS of scheme III is −8.7% which is superior to scheme II with −1.3% of average BDBRMOS gain. Especially for the Poznan_Street and Undo_Dancer sequence, the high gain of −9.8 and−11.4% can be ob-tained. Therefore, we can find that the proposed scheme III achieves more considerable bitrate saving for these test sequences when compared with the schemes II and I. The Rate-MOS curves in Fig.10illustrate the improvement of coding performance of scheme III intuitively. It can be seen that, the scheme III achieve better Rate-MOS coding performance than the other two schemes.
Table 14The MOS and BDBRMOSfor each test video sequence
3D sequences
QP MOS BDBRMOS(%)
Scheme I Scheme II Scheme III Scheme
II
Scheme III Statistical
mean of MOS
95% confidence interval (α= 0.05)
Statistical mean of MOS
95% confidence interval (α= 0.05)
Statistical mean of MOS
95% confidence interval (α= 0.05)
Kendo 22 3.314 [3.152, 3.476] 3.286 [3.129, 3.443] 3.286 [3.129, 3.443] −1.3% −7.5%
27 2.886 [2.775, 2.997] 2.857 [2.735, 2.979] 2.886 [2.775, 2.997]
32 2.343 [2.178, 2.508] 2.229 [2.083, 2.375] 2.314 [2.152, 2.476]
37 1.829 [1.698, 1.96] 1.771 [1.625, 1.917] 1.800 [1.661, 1.939]
GT_Fly 22 4.514 [4.34, 4.688] 4.457 [4.283, 4.631] 4.486 [4.312, 4.66] −0.8% −6.6%
27 4.286 [4.129, 4.443] 4.257 [4.105, 4.409] 4.286 [4.129, 4.443]
32 3.571 [3.399, 3.743] 3.514 [3.34, 3.688] 3.543 [3.369, 3.717]
37 2.771 [2.625, 2.917] 2.743 [2.591, 2.895] 2.800 [2.661, 2.939]
PoznanStreet 22 3.771 [3.625, 3.917] 3.714 [3.557, 3.871] 3.743 [3.591, 3.895] −3.0% −9.8%
27 3.429 [3.257, 3.601] 3.400 [3.229, 3.571] 3.400 [3.229, 3.571]
32 2.914 [2.816, 3.012] 2.829 [2.698, 2.96] 2.886 [2.775, 2.997]
37 2.257 [2.105, 2.409] 2.229 [2.083, 2.375] 2.257 [2.105, 2.409]
Poznan_Hall2 22 3.400 [3.229, 3.571] 3.343 [3.178, 3.508] 3.371 [3.203, 3.539] −2.1% −8.6%
27 2.714 [2.557, 2.871] 2.629 [2.461, 2.797] 2.686 [2.524, 2.848]
32 2.229 [2.083, 2.375] 2.171 [2.04, 2.302] 2.229 [2.083, 2.375]
37 1.486 [1.312, 1.66] 1.429 [1.257, 1.601] 1.514 [1.34, 1.688]
Shark 22 4.543 [4.369, 4.717] 4.486 [4.312, 4.66] 4.514 [4.34, 4.688] −1.2% −8.5%
27 4.086 [3.988, 4.184] 4.029 [3.971, 4.087] 4.086 [3.988, 4.184]
32 3.543 [3.369, 3.717] 3.514 [3.34, 3.688] 3.543 [3.369, 3.717]
37 2.943 [2.862, 3.024] 2.886 [2.775, 2.997] 2.914 [2.816, 3.012]
UndoDancer 22 4.429 [4.257, 4.601] 4.371 [4.203, 4.539] 4.429 [4.257, 4.601] 0.4% −11.4%
27 4.057 [3.976, 4.138] 3.971 [3.913, 4.029] 4.029 [3.971, 4.087]
32 3.600 [3.429, 3.771] 3.571 [3.399, 3.743] 3.600 [3.429, 3.771]
37 2.686 [2.524, 2.848] 2.629 [2.461, 2.797] 2.657 [2.492, 2.822]
6 Conclusions
Stereoscopic video coding is one of the most important technologies in three-dimensional video applications. In this paper, the influence of texture features on stereo-scopic perceptual threshold is revealed and an asymmet-ric stereoscopic video coding scheme with texture-based asymmetrical visibility threshold model is proposed. In the proposed coding scheme, a hypothesis is first pro-posed and a subjective perception experiment is executed to verify the hypothesis. Based on the subjective percep-tual experiment, we reveal the relationship between the asymmetrical visibility threshold and texture complexity and build our asymmetric stereoscopic video coding scheme. The proposed scheme has the following charac-teristics. The method takes the perceptual capabilities of
human vision system into account, which achieves sig-nificant bitrate saving while maintaining perception quality very well, especially in the applications of small QP and high bitrate. Future work related to the stereo-scopic perceptual video coding should focus on two as-pects. One is the research on the stereoscopic TAVT model that can assess more stereoscopic perceptual fea-tures. The other is exploring the application of the pro-posed model in the field of rate control and super-high resolution video coding.
Abbreviations
ALV:Average local variance; BDBRMOS: Bjontegaard delta bitrate based on
MOS; BDBRPSNR: Bjontegaard delta bitrate based on PSNR;
BDBRSSIM: Bjontegaard delta bitrate based on SSIM; CTC: Common test
conditions; DSCQS: Double Stimulus Continuous Quality Scale;
Fig. 10The Rate-MOS performance comparisons of three schemes:a"Kendo,"b"GT_Fly,"c"Poznan_Street,"d"Poznan_Hall2,"e"Shark,"
HBP: Hierarchical B picture; HVS: Human visual systems; JND: Just noticeable distortion; LCU: Largest Coding Unit; MOS: Mean Opinion Score; PCM: Paired Comparison Method; PSNR: Peak signal-to-noise ratio; QP: Quantization parameters; SSIM: Structural Similarity Index Measurement; TAVT: Texture-based Asymmetrical Visibility Threshold model; VT: Visibility threshold
Acknowledgements
The authors would like to thank the editors and anonymous reviewers for their valuable suggestions and comments.
Funding
This work was supported by Natural Science Foundation of China (61671258, U1301257, 61471348), K.C. Wong Magna Fund of Ningbo University,the General Scientific Research Project of the Education Department of Zhejiang Province(Y201636754), Guangdong Natural Science Foundation for Distinguished Young Scholar under Grant 2016A030306022, Shenzhen Science and Technology Development Project under Grant
JSGG20160229202345378, and Shenzhen International Collaborative Research Project under Grant GJHZ20170314155404913.
Availability of data and materials
Data would not be shared and available right now. Reason for not sharing the data and materials is that the work submitted for review is not completed. The research is still ongoing, and those data and materials are still required by the author and co-authors for further investigations. We will share the data online after the paper is published. People with any questions are welcome to contact us.
Authors’contributions
BD designed the proposed algorithm and drafted the manuscript. MY designed and conducted the subjective experiments. GJ offered useful suggestions and helped to modify the manuscript. YZ participated in the algorithm design and tested the proposed algorithm. TZ conducted the subjective experiment and performed the statistical analysis. All authors read and approved the final manuscript.
Competing interests
The authors declare that they have no competing interests.
Publisher’s Note
Springer Nature remains neutral with regard to jurisdictional claims in published maps and institutional affiliations.
Author details
1Faculty of Information Science and Engineering, Ningbo University, Ningbo,
China.2Electronic and Information College, Ningbo Polytechnic, Ningbo, China.3Shenzhen Institutes of Advanced Technology, Chinese Academy of Sciences, Shenzhen, China.4Department of Computer Science, City University of Hong Kong, Hong Kong, China.
Received: 1 December 2016 Accepted: 10 April 2018
References
1. JC Chiang, JR Wu, Asymmetrically frame-compatible depth video coding. Electron. Lett.51, 1780–1782 (2015)
2. C-H Lin, K-L Chung, J-J Chen, Y-H Chiu, Y-N Chen, Fast and quality-efficient scheme for asymmetric multi-view video plus depth coding under the bitrate constraint. J. Vis. Commun. Image Represent.
30, 350–362 (2015)
3. AE Rey, B Riou, D Muller, S Dabic, R Versace,“The mask who wasn’t there”: Visual masking effect with the perceptual absence of the mask. J. Exp. Psychol. Learn. Mem. Cogn.41, 567–573 (2015)
4. P. Aflaki, M. M. Hannuksela, J. Häkkinen, P. Lindroos, and M. Gabbouj, Subjective study on compressed asymmetric stereoscopic video, 2010 IEEE International Conference on Image Processing(Hong Kong, 2010), pp. 4021–4024, doi:https://doi.org/10.1109/ICIP.2010.5650661. 5. MG Perkins, Data compression of stereopairs. IEEE Trans. Commun.
40, 684–696 (1992)
6. Z Jin, T Tillo, C Yao, J Xiao, Y Zhao, Virtual-view-assisted video super-resolution and enhancement. IEEE Transactions on Circuits and Systems for Video Technology26, 467–478 (2016)
7. M Joachimiak, MM Hannuksela, M Gabbouj, View upsampling optimization for mixed resolution 3D video coding. Multidim. Syst. Sign. Process.27, 763–783 (2016)
8. X Wang, G Jiang, J Zhou, Y Zhang, F Shao, Z Peng, et al., Visibility threshold of compressed stereoscopic image: Effects of asymmetrical coding. The Imaging Science Journal61, 172–182 (2013)
9. F Shao, G Jiang, X Wang, M Yu, K Chen, Stereoscopic video coding with asymmetric luminance and chrominance qualities. IEEE Trans. Consum. Electron.56, 2460–2468 (2010)
10. X Shang, Y Wang, L Luo, Y Zuo, Z Zhang, Fast mode decision for multiview video coding based on just noticeable distortion profile. Circuits, Systems & Signal Processing34, 301–320 (2015)
11. Z. Chen and H. Liu, JND modeling: Approaches and applications, 2014 19th International Conference on Digital Signal Processing( Hong Kong, 2014), pp. 827–830.doi:https://doi.org/10.1109/ICDSP.2014.6900782.
12. J Kim, S Bae, M Kim, An HEVC-compliant perceptual video coding scheme based on JND models for variable block-sized transform kernels. IEEE Transactions on Circuits and Systems for Video Technology
25, 1786–1800 (2015)
13. S-P Lu, B Ceulemans, A Munteanu, P Schelkens, Spatio-temporally consistent color and structure optimization for multiview video color correction. IEEE Transactions on Multimedia17, 577–590 (2015)
14. F Shao, W Lin, W Lin, G Jiang, M Yu, R Fu, Stereoscopic visual attention guided seam carving for stereoscopic image retargeting. J. Disp. Technol.
12, 22–30 (2016)
15. G. Georgiadis, A. Chiuso, and S. Soatto, Texture representations for image and video synthesis, 2015 IEEE Conference on Computer Vision and Pattern Recognition (CVPR) (Boston, MA, 2015), pp. 2058–2066, doi:https://doi.org/ 10.1109/CVPR.2015.7298817.
16. K. McCann, B. Bross, W.-J. Han, I. K. Kim, K. Sugimoto, G. J. Sullivan, High efficiency video coding (HEVC) test model 14 (HM14) encoder description,
http://phenix.int-evry.fr/jct/. Accessed 26 Mar 2014.
17. ITU-T Recommendation P.910, Subjective video quality assessment methods for multimedia applications, International Telecommunication Union, Geneva, Switzerland, 1999
18. ITU-R Recommendation BT.500-11, Methodology for the subjective assessment of the quality of television pictures, International Telecommunication Union, Geneva, Switzerland, 2002
19. P Aflaki, MM Hannuksela, M Gabbouj, Subjective quality assessment of asymmetric stereoscopic 3D video, signal. Image and Video Processing9, 331–345 (2015)
20. J. Zhou, G. Jiang, X. Mao, M. Yu, F. Shao, Z. Peng, et al., Subjective quality analyses of stereoscopic images in 3DTV system, Visual Communications and Image Processing (VCIP), 2011 IEEE, (Tainan, 2011), pp. 1–4. doi:https:// doi.org/10.1109/VCIP.2011.6115913.
21. W-J Tsai, Y-C Sun, P-J Chiu, Robust video coding based on hybrid hierarchical B pictures. IEEE Transactions on Circuits and Systems for Video Technology24, 878–888 (2014)
22. M Paul, W Lin, C-T Lau, BS Lee, A long-term reference frame for hierarchical B-picture-based video coding. IEEE Transactions on Circuits and Systems for Video Technology24, 1729–1742 (2014)
23. Q Zhang, M Chen, H Zhu, X Wang, Y Gan, An efficient depth map filtering based on spatial and texture features for 3D video coding. Neurocomputing
188, 82–89 (2016)
24. N Kamaci, Y Altunbasak, RM Mersereau, Frame bit allocation for the H.264/AVC video coder via Cauchy-density-based rate and distortion models. IEEE Transactions on Circuits and Systems for Video Technology15, 994–1006 (2005) 25. J. Si, S. Ma, S. Wang, and W. Gao, Laplace distribution based CTU level rate
control for HEVC, in Visual Communications and Image Processing (VCIP) (VCIP) (Kuching, 2013), pp. 1–6. doi:https://doi.org/10.1109/VCIP.2013. 6706333.
26. L. Xu, X. Ji, W. Gao, and D. Zhao, Laplacian distortion model (LDM) for rate control in video coding, in Advances in Multimedia Information Processing– PCM 2007: 8th Pacific Rim Conference on Multimedia, (Hong Kong, China, 2007). pp. 638–646.
28. Z Kotevski, P Mitrevski, inICT Innovations 2009, ed. by D Davcev, J M Gómez. Experimental comparison of PSNR and SSIM metrics for video quality estimation, vol 2010 (Springer, Berlin), pp. 357–366