ORIGINAL PAPER
Driver behaviour and driver experience of partial and fully
automated truck platooning
–
a simulator study
Magnus Hjälmdahl1&Stas Krupenia1&Birgitta Thorslund1
Received: 20 January 2016 / Accepted: 4 January 2017 / Published online: 2 February 2017
#The Author(s) 2017. This article is published with open access at SpringerLink.com
Abstract
Introduction This paper builds our knowledge of truck driver behaviour in and experience of automated truck platooning, focusing on the effect of partially and fully automated truck platoons on driver workload, trust, acceptance, performance, and sleepiness.
Methods Twenty-four male drivers experienced three condi-tions in a truck driving simulator, i.e., baseline, partial auto-mation, and full automation: the baseline condition was driv-ing with standard cruise control; partial automation was auto-mated longitudinal control ten metres behind the truck in front, with the driver having to steer; and full automation was automated longitudinal and lateral control. Each condi-tion was simulated in three situacondi-tions: light traffic, heavy traf-fic, and heavy traffic plus fog.
ResultsThe experiment demonstrated that automation affects workload. For all workload measures, partial automation pro-duced higher workload than did the full-automation or base-line condition. The two measures capturing trust, i.e., the Human Trust in Automated Systems Scale (HTASS) and Cooper–Harper Scales of Workload, Temporal Load, Situation Awareness, and Trust, were consistent and indicated that trust was highest under the baseline condition, with little
difference between partial and full automation. Driver accep-tance of both levels of automation was lower than accepaccep-tance of baseline. Drivers rated their situation awareness higher for both partial and full automation than for baseline, although both levels of automation led to higher sleepiness.
Conclusions Workload was higher for partial than for full automation or the baseline condition. Trust and acceptance were generally highest in the baseline condition, and did not differ between partial and full automation. Drivers may be-lieve that they have more situation awareness during automat-ed driving than they actually do. Both levels of automation lautomat-ed to a higher degree of sleepiness than in the baseline condition. The challenge when implementing truck platooning is to de-velop a system, including human–machine interaction (HMI), that does not overburden the driver, properly addresses driver sleepiness, and satisfies current legislation. The system also must be trusted and accepted by drivers. To achieve this, the development of well-designed HMI will be crucial.
Keywords Platooning . Automated driving . Human– machine interaction (HMI) . Trust . Workload . Sleepiness
1 Introduction
Over the last few years, the development of automated driving products has increased significantly. While the technical is-sues are being researched and prototypes are being prepared for on-road evaluations, we still lack knowledge of the effects of these technologies on the driver, vehicle, and driver– vehi-cle interaction.
Electronically coupled road trains in which several vehicles follow a lead vehicle, driven more or less automatically, were already mentioned in the Program for European Traffic with Highest Efficiency and Unprecedented Safety Highlights
•Workload is higher for Partial automation (driver has to steer) than for baseline (Standard Cruise Control) and Full automation
•Trust is lower for the automated systems than for the CC
•Sleepiness is higher for Partial and Full automation than for Baseline. Sleepiness is higher for Full automation than for Partial.
* Birgitta Thorslund [email protected]
(PROMETHEUS) in 1998, and several research projects have been developing the technology and examining its effects (e.g., the SARTRE, IQFleet, PATH, Energy ITS, and GCDC projects). These projects have demonstrated that while platooning technology is mature, questions remain regarding the involved human–machine interaction (HMI) and the driver role in the platoon.
The driving forces behind vehicle automation are often attributed to comfort, convenience, safety, and better use of time, to mention just a few, but there are also potential prob-lems. The main benefit of vehicle platoons, and especially truck platoons, is the reduced fuel consumption, and Davila [6] found consumption reductions of up to 12% for trucks when driving in platoons.
With the automation of one or several driving tasks, driving may become radically simplified; this entails potential mental underload, meaning that that the driving task may become oversimplified, resulting in boredom, cognitive underload, and eventually increased drowsiness and loss of situation awareness. In the long run, there is also a risk of skill degen-eration [22].
While little previous research examines automated truck driving, some examines automated car driving and, despite the differences mentioned, several similarities can be expected between the two. In a study of driver response to sudden events in semi- and highly automated car driving, Martens et al. [17] found that there was no difference in response be-tween the automation modes compared with the control con-dition (i.e., manual driving). Martens et al. [17] concluded that the drivers retained proper situation awareness. In contrast, Merat and Jamson [18] found that car driver response to crit-ical events was much slower in automated than manual driv-ing. Regarding situation awareness, some studies have found that drivers are more prone to attend to non-driving tasks, such as in-vehicle entertainment, in automated driving [3,11]. Jamson et al. [11], however, suggested that this may not nec-essarily reduce their preparedness for unexpected events, as the studied drivers paid more attention to the road during heavy traffic. A recent study demonstrated that not only were drivers less prepared to handle unexpected events when driv-ing autonomously, but that the greater the automation the worse they performed [27]. These somewhat contradictory results indicate a need for more research into how automation affects driver ability to control the vehicle.
According to the literature, the relationship between auto-mation and sleepiness is clearer. Increased fatigue and distress have been observed after a drive in an automated car [20], and it has been suggested that automation may produce high levels of fatigue [21]. Funke et al. [7] found that if drivers, during automated driving, were still required to control lateral posi-tion, subjective ratings of workload and distress improved.
Some studies find that workload is unaffected by automa-tion. For example, in the KONVOI project, Wille et al. [31]
concluded that there was no critical difference in the subjec-tive workload of truck drivers driving in automated versus non-automated truck convoys. Martens et al. [17] achieved the same result for car drivers in control of semi- and highly automated driving. Merat et al. [19] found an interaction effect between automation and workload through a non-visual sec-ondary task in which manual and highly automated driving were affected more than was semi-automated driving.
The varying and sometimes contradictory research results regarding driving automation may stem from the large variation in the types of automated systems tested, varying in the driver tasks automated, in how the HMI is designed, and in the in-structions given to the driver. Another factor contributing to the difference may be that the methods used to study user experi-ence themselves vary. As automation could fundamentally change the task of driving (fromBdriving^toBsupervising^), current methods for assessing user experience of in-vehicle technologies will likely be of limited use in assessing automated driving. This is where the Autonomous Driving Evaluation Methodology and Scenarios (ADEMAS) project underlying this study comes into play. It evaluates various methods of studying user experience and, based on the results, will develop a framework for evaluating the user experience of automated driving and highly automated systems.
2 Research aim
This paper endeavours to build our knowledge of the role of the HMI and drivers in platooning by reporting a subset of the results of the ADEMAS project concerning driver experience. The methodological framework from the same project is re-ported by Krupenia et al. [13]. The aim is to examine the effects of partially and fully automated platooning on driver workload, trust, acceptance, performance, and sleepiness using a minimal HMI.
As the study investigated driver experience of automated driving, its focus was on continuous driving rather than critical events or system failures in which the driver rapidly needs to take over control.
3 Method
3.1 Participants
The truck drivers for this experiment were recruited partly from a trucking company owned by Scania Transportlaboratorium (henceforthBScania^) and partly from the Swedish Road and Transport Research Institute (VTI) participant database. In to-tal, 24 male drivers participated in the experiment, nine from Scania and 15 from the participant database. The inclusion criterion was that most of the participants’driving should have been regional or long haul, so that the highway scenario used in the experiment would be representative of their everyday driving.
3.2 Apparatus and material
3.2.1 Workload
For workload, the first measure used is the Driver Activity Load Index (DALI; [23]). DALI is an adapted version of the NASA-TLX and comprises six subscales, each extending from low to high: (1) Effort of attention, (2) Visual demand, (3) Auditory demand, (4) Temporal pressure, (5) Interference, and (6) Situation Stress.
The second measure of workload is based on the Subjective Workload Assessment Technique (SWAT), which comprises Time Load, Mental Effort Load, and Psychological Stress Load ([25]; cited in [24]). ASWAT, a variant of SWAT with
continuous dimensions and equal weights, was used [15]. ASWATis easier to administer and more sensitive for low
men-tal workloads.
In addition to these two subjective measures, the Peripheral Visual Detection Task (PDT) was used [29]. The PDT is an objective measure of the mental workload and visual distrac-tion experienced by drivers.
3.2.2 Supervisory control
Supervisory control can be considered a scheme by which automatic subsystems use information sensed from the phys-ical world together with information obtained by a human operator to influence the operators’interactions in the real world via the control system (adapted from Sheridan [26]). The present study used the Control Rating Scales [14], origi-nally developed for use in aviation [9].
3.2.3 Trust
The Human Trust in Automation Scale [12] comprises twelve items capturing both trust and distrust and scored using seven-point Likert scales [16]. The Trust score captures calmness and security while the Distrust score captures fear and worry [16]. In the present study, mean trust and mean distrust scores were created from the participants’answers.
3.2.4 Driver acceptance
User acceptance was investigated using two standard ques-tionnaires, the Acceptance Scale for Advanced Transport Telematics (AATT; [28]) and the Questionnaire for User Interface Satisfaction (QUIS; [4]). These two questionnaires provided User Acceptance, User Satisfaction, and Overall Reactions to the product indices.
AATT is a simple, standard tool for assessing the acceptance of new technologies [28] and comprises nine items scored on a five-point scale. Data from the nine questions are reduced to two subscale scores, i.e., Usefulness and Satisfaction.
QUIS [4] assesses subjective responses regarding accep-tance and opinions regarding human–computer interfaces. The full QUIS comprises 11 sections, though the current study used only the Overall reactions section. This section com-prises six items, each rated on a polar nine-point scale, for example, ranging from terrible [1]–wonderful [9] or frustrat-ing [1]–satisfying [9]. Of these six items, one relating to com-puting power was removed due to lack of relevance.
3.2.5 Sleepiness
Sleepiness was measured using the Karolinska Sleepiness Scale (KSS), which has nine grades and ranges from 1 = very alert to 9 = very sleepy (i.e., great effort to keep alert, fighting sleep) [1]. KSS is the measure of driver sleepiness that is least affected by between-individual variation [2].
3.2.6 Driving simulator
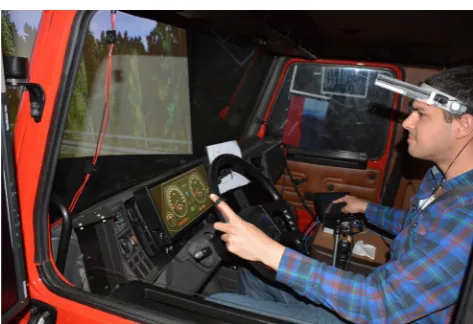
The study was conducted in the VTI Simulator II, whose visual system consists of six SXRD projectors giving a 120-degree forward field of vision. Each projector has a resolution of 1920 × 1080 pixels, giving the simulator very high visual acuity. The images are warped and blended using automatic calibration software. Rear-view mirrors are simulated with two LCD displays.
The simulator has a vibration table and a motion system that can provide both linear and tilt motion. The vibration table allows road unevenness to be simulated at higher fre-quencies, while the tilt motion is used, for example, to simu-late the long accelerations that occur when driving through bends, accelerating longitudinally, or braking. Because the simulator’s tilt motion affects both the compartment/cab and the projection screen, while the vibration table affects only the compartment/cab in relation to the screen, it is possible to create a realistic road experience (Fig.1).
3.2.7 Driving performance measures
position (SDLP), steering wheel reversal rate (SWRR), and reaction to events (i.e., braking or steering).
3.3 Scenario
The road consisted of a highway on-ramp (1.3 km) and then highway driving for 62.8 km. Once the driver had driven onto the highway and reached the cruising speed of 82 km/h, he either turned on the CC or connected to the platoon, which conveniently passed just as he approached the highway.
3.4 Systems
Three systems were used in this experiment: CC, partial auto-mation, and full automation. The CC was a standard Scania CC implemented in the driving simulator; however, the drivers were unable to set the speed themselves, which was preset to 82 km/ h. When the drivers had entered the highway, they pressed the CC button and the vehicle accelerated/slowed to 82 km/h, just as if they had pressed the resume button on the CC.
The partial and full automation modes were developed at VTI. When the partial automation system was activated, the truck accelerated to catch up to the truck in front (or slowed if it was closer than ten metres to the truck in front, which was never the case). When the truck was within ten metres of the truck in front, it followed at that distance, with some minor variation: going uphill, the truck could follow a few metres farther behind, and downhill it could be a little closer. The system was activated using the same button as was the CC. In addition, a display indicated the system status.
The fully automated system was similar to the partially automated system in how it was activated and controlled; the difference was that the system also activated the steering, meaning that the drivers could release the steering wheel and did not need to do anything for the 45-min drive.
The partially automated system could be overridden by braking or accelerating, while the fully automated system
could also be overridden by steering; if either system was overridden, it had to be activated manually again.
3.5 Design and procedure
This experiment used a 3 × 3 within-subject design and there were three automation conditions: partial automation, full au-tomation, and baseline condition. Each condition was simu-lated in three situations: light traffic, heavy traffic, and heavy traffic plus fog. The baseline condition was driving with stan-dard cruise control (CC). All drivers drove under all three conditions, whose order was balanced. The three situations were always presented in the same order, i.e., light traffic came first, then heavy traffic, and finally heavy traffic with fog.
When arriving at VTI, all participants were welcomed, were informed about the experiment, and signed an informed consent. The drivers then completed background question-naires while the experiment leader applied electrodes to mea-sure galvanic skin response (GSR) and electro cardiogram (ECG), which were used in the ADEMAS project but are not reported here. All questionnaires were completed on an iPad2 using web questionnaire software for SPSS.
After questionnaire completion and the electrode measure-ments, the participants were moved into the simulator where they were shown the layout of controls for system operation and how the controls worked. The Peripheral Detection Task (PDT) was also demonstrated.
Once the drivers were in place, they received ten minutes of training, during which they familiarized themselves with the simulator and learned how to set the cruise control and to drive. During the familiarization drive, participants also expe-rienced the PDT. After finishing the training, participants completed a short questionnaire, i.e., the Driver Activity Load Index (DALI) weightings, without leaving the simulator. When the DALI weightings were completed, the first ex-perimental condition started. During the baseline drive, par-ticipants commenced driving on the on-ramp, turning on the CC when they had entered the highway, and then drove for 45 min. During the partially and fully automated drives, par-ticipants started with one training run on how to connect to the platoon, after which they drove for about 30 s before restarting, connecting to the platoon by themselves, and then driving for 45 min.
4 Analysis
Workload measures was performed only once for each condi-tion. Therefore, one-way repeated-measures ANOVAs were used to identify any effects of Automation level. Pairwise comparisons of automation level were corrected with Tukeys method when sphericity was assumed and otherwise with Bonferroni. The alpha level was 5%.
General estimating equations (GEEs) were used to model correlated data for the driving performance measures and sleepiness. Within-participant predictor variables were condition(baseline and partial automation only; note that full automation is not included in the analysis because both lateral position and steering wheel movements are automated in full automation) andsituation(i.e., light traffic, heavy traffic, and heavy traffic with fog).Order,representing the chronological order of the conditions, was included as a covariate. The working correlation matrix was set to exchangeable because symmetry was assumed. The outputs are Wald statistics (χ2), indicating the significance, and regression coefficients (B), presenting the relationships between the predictor variables. All results have a confidence interval of 95% and signifi-cances are at thep< 0.05 level.
5 Results
5.1 Workload
Looking at the effect of automation level on workload mea-sured by ASWAT and DALI, the results indicate that automa-tion significantly affected DALI, i.e., F(2, 36) = 9.57, p< 0.01, η2= 0.35. Post-hoc tests for the DALI indicated no significant difference between responses in the baseline and partially automated conditions (p= 0.06), no significant difference between responses in the baseline and fully auto-mated conditions (p = 0.12), and significantly higher re-sponses in the partially automated than fully automated con-dition (p< 0.01; Fig.2).
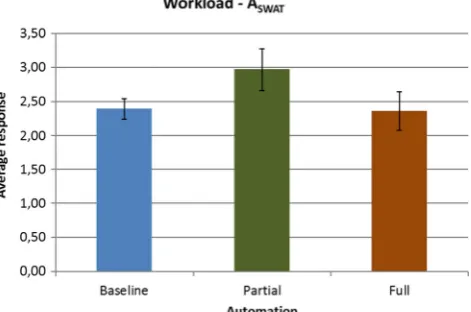
In contrast, Automation Level had only a marginally sig-nificant effect on ASWAT, i.e., F(2, 40) = 2.89, p = 0.07,
η2
= 0.13. Post-hoc tests for the ASWATindicated marginally
higher responses in the partially automated than baseline con-dition (p= 0.08), no significant difference between responses in the baseline and fully automated conditions (p= 0.96), and
no significant difference between responses in the partially and fully automated conditions (p= 0.14; Fig.3).
In addition, the following were observed: a significant re-lationship between DALI Total and ASWATTotal, which are
the mean values of the measures, (r= 0.63), a marginally significant relationship between DALI Temporal demand and ASWATTime Pressure (r= 0.20), and a significant
rela-tionship between DALI Effort of Attention and ASWAT
Concentration (r= 0.37).
In addition to the subjective measurements of workload, PDT was used as an objective measure. However, Automation Level had no main effect on the PDT reaction time or PDT hit rate.
5.2 Supervisory control
When looking at the effects of automation level on workload measured with the Cooper-Harper scale no significant effect was observed, i.e.,F(2, 40) = 2.18,p= 0.12,η2= 0.10, so no Post-hoc tests were conducted (Fig.4).
Automation significantly affected the Cooper–Harper Temporal Load, i.e.,F(2, 40) = 3.28, p = 0.05,η2= 0.14. Post-hoc tests for the Cooper–Harper Temporal Load scale indicated significant difference between responses in the base-line and partially automated conditions (p= 0.049), no signif-icant difference between responses in the baseline and fully automated conditions (p= 0.845), and marginally higher re-sponses in the partially automated than fully automated con-dition (p< 0.07 = 0.16; Fig.5).
Automation significantly affected the Cooper–Harper Situation Awareness, i.e.,F(2, 40) = 7.54,p< 0.01,η2= 0.27. Post-hoc tests for the Cooper–Harper Situation Awareness scale indicated significantly higher responses in the partially automat-ed than baseline condition (p < 0.01), significantly higher re-sponses in the fully automated than baseline condition (p= 0.02), and no significant difference between responses in the partially and fully automated conditions (p= 0.75; Fig.6).
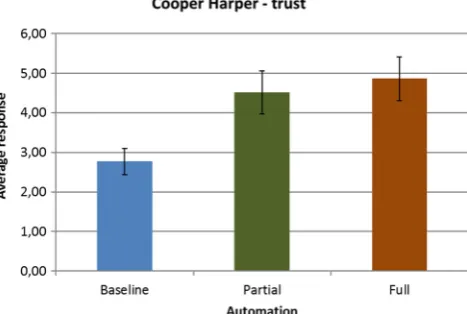
For the Cooper–Harper Trust scale, Mauchly’s test in-dicated that the assumption of sphericity had been violat-ed, i.e., χ2(2) = 6.94, so corrected values (Greenhouse– Geisser, ε) are reported. The results indicated that auto-mation significantly affected the Cooper–Harper Trust scale, i.e., F(1.53, 30.63) = 6.09, p = 0.01, η2 = .23. Post-hoc tests for the Cooper–Harper Trust scale indicated marginally higher responses in the partially automated than baseline condition (p = 0.06), significantly higher responses in the fully automated than baseline condition (p = 0.03), and no significant difference between re-sponses in the partially and fully automated conditions (p= 1.00; Fig. 7).
Additionally, the following were observed: no significant relationship between Cooper–Harper Mental Load and DALI Effort of Attention (r=−.001); a significant relationship be-tween Cooper–Harper Temporal Load and DALI Time Pressure (r = 0.28); a significant relationship between Cooper–Harper Mental Load and ASWAT Concentration
(r= 0.27), and no significant relationship between Cooper– Harper Temporal Load and ASWATTime Pressure (r= 0.08).
5.3 Trust
Three trust measures were calculated using the raw data. First, consistent with Wang et al. [30], a Global Trust score was calculated using 11 of the original Jian et al. [12] items (the original item eight was omitted from this Global Trust score). Second, consistent with Lyons et al. [16], two subscales were calculated, Trust and Distrust. Consequently, three one-way repeated-measures ANOVAs were used to identify any effect of Automation Level on Global Trust, the Trust subscale, and the Distrust subscale.
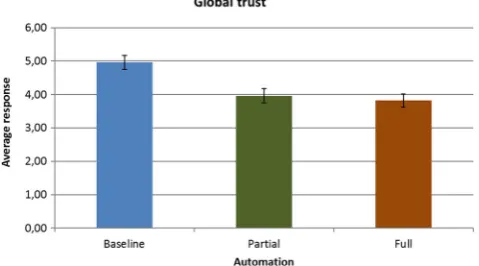
For the Global Trust score, Mauchly’s test indicated that the assumption of sphericity had been violated, i.e., χ2
(2) = 7.83, so corrected values (Greenhouse–Geisser, ε) are reported. Automation significantly affected Global Trust, i.e.,F(1.50, 29.91) = 14.86,p< .001,η2= .43. Post-hoc tests comparisons for Global Trust indicated significantly higher responses in the baseline than the partially automated condi-tion (p< .005), significantly higher responses in the baseline than the fully automated condition (p< .005), and no signif-icant difference between responses in the partially and fully automated conditions (p= 1.00; Fig.8).
Fig. 6 Situation Awareness as measured by the Cooper–Harper scale
Fig. 5 Temporal Load as measured by the Cooper–Harper scale Fig. 4 Mental load as measured by the Cooper–Harper scale
For the Trust subscale score, Mauchly’s test indicated that the assumption of sphericity had been violated, i.e., χ2
(2) = 7.30, so corrected values (Greenhouse–Geisser,ε) are reported. The results indicated a significant effect of A u t o m a t i o n o n t h e Tr u s t s u b s c a l e , i . e . , F( 1 . 5 2 , 30.33) = 12.03,p < 0.01, η2= 0.38. Post-hoc tests for the Trust subscale indicated significantly higher responses in the baseline than the partially automated condition (p< 0.01), sig-nificantly higher responses in the baseline than the fully auto-mated condition (p< 0.01), and no significant difference be-tween responses in the partially and fully automated conditions (p= 1.00; Fig.9).
Automation significantly affected the Distrust subscale score, i.e.,F(2, 40) = 9.55,p< .001,η2= .32. Post-hoc tests for the Distrust subscale indicated significantly higher re-sponses in the baseline than the partially automated condition (p< 0.01), significantly higher responses in the baseline than the fully automated condition (p< 0.01), and no significant difference between responses in the partially and fully auto-mated conditions (p= 0.92; Fig.10).
Additionally, the following were observed: a significant relationship between Global Trust and Trust (r= 0.94); a sig-nificant relationship between Global Trust and Distrust (r = 0.81); a significant relationship between Trust and Distrust (r = 0.58); a significant relationship between Cooper–Harper Trust and Global Trust (r= 0.68); a significant relationship between Cooper–Harper Trust and the Trust sub-scale (r = 0.58,); and a significant relationship between Cooper–Harper Trust and the Distrust subscale (r= 0.71).
5.4 Driver acceptance
For the AATT Usefulness subscale score, Mauchly’s test in-dicated that the assumption of sphericity had been violated, i.e.,χ2(2) = 6.327, so corrected values (Greenhouse–Geisser, ε) are reported.
Automation significantly affected AATT Usefulness, i.e., F(1.60, 31.17) = 7.138,p< .005,η= .26). Followup compar-isons for the AATT Usefulness subscale indicated
significantly lower responses in the partially automated than baseline condition (p< .01), significantly lower responses in the fully automated than baseline condition (p< .01), and no significant difference between responses in the partially and fully automated conditions (p= 1.000; Fig.11).
For the AATT Satisfaction subscale score, Mauchly’s test indicated that the assumption of sphericity had been violated, i.e.,χ2(2) = 0.109, so corrected values (Greenhouse–Geisser, ε) are reported.
Automation significantly affected AATT Satisfaction, i.e., F(1.656, 33.110) = 10.712,p< .001,η= .35. Followup com-parisons for the AATT Satisfaction subscale indicated signif-icantly lower responses in the partially automated than base-line condition (p< .01), significantly lower responses in the fully automated than baseline condition (p < .005), and no significant difference between responses in the partially and fully automated conditions (p= 0.932; Fig.11).
Automation significantly affected QUIS, i.e., F(2, 40) = 6.734, p < .005,η= .25. Followup comparisons for the QUIS subscale indicated significantly higher responses in the baseline than partially automated condition (p< .05), significantly higher responses in the baseline than fully auto-mated condition (p< .05), and no significant difference be-tween responses in the partially and fully automated condi-tions (p= 0.784; Fig.12).
Fig. 8 Global Trust score
Fig. 9 Trust subscale
Additionally, the following were observed: a significant relationship between AATT Satisfaction and QUIS (r = −0.894) and a significant relationship between AATT Usefulness and QUIS (r= 0.795).
5.5 Driving performance measures
For lateral position, a significant main effect ofconditionwas that partial automation led to positioning approximately 10 cm farther right than did the baseline condition (χ2 = 19.27 and B= 0.12); there was no main effect for situation ororder. Conditionandsituationhad significant interaction effects on lateral position, such that the heavy traffic with fog (positioned farthest left in the baseline condition) was more affected (χ2 = 8.55 andB= 0.05) by partial automation than was lateral position (ending up farthest right).
A significant main effect ofcondition was revealed for SDLP such that partial automation led to significantly more variation in lateral position than did the baseline condition (χ2 = 27.37 andB= 0.06). Neithersituationnororderhad a significant main effect, and neitherconditionnorsituationhad a significant interaction effect on SDLP.
Conditionhad a significant main effect on SWRR, such that partial automation led to approximately eight more rever-sals per minute than did the baseline condition (χ2 = 88.50 and B = 7.87). Conditionand situationhad no interaction effect, andorderhad no main effect on SWRR.
5.6 Sleepiness
Conditionhad a significant main effect on KSS ratings, such that full automation led to significantly higher KSS ratings than did the baseline condition (χ2 = 13.18 andB = 1.40). Situationhad a significant main effect, such that both heavy traffic (χ2 = 114.92 andB= 0.75) and heavy traffic with fog (χ2 = 114.92 andB= 1.48) led to significantly higher KSS ratings than did light traffic.Condition andsituation had a significant interaction effect, such that heavy traffic with fog led to significantly higher KSS ratings than did light traffic only with partial or full automation but not in the baseline condition (χ2 = 9.67 andB= 0.58; see Fig.13).Orderhad no main effect on KSS ratings.
6 Discussion
This paper set out to study how various levels of automation in truck platooning affected the drivers’experience and how well this could be studied. The aim was to examine the effects of partially and fully automated platooning on drivers’workload, trust, acceptance, performance, and sleepiness.
The experiments indicated that automation does affect workload and that the overall tendency is the same for all measures, with partial automation producing a higher Fig. 11 Acceptance scale for Advanced Transport Telematics (AATT)
workload than does full automation or the baseline condition (i.e., cruise control). According to DALI, the workload is sig-nificantly higher for partial than full automation, and ASWAT
indicates the same pattern, with partial automation producing a marginally higher workload (p= 0.085) than does the base-line condition. There was a significant correlation between the DALI and ASWATmeasures. The Cooper–Harper Scales did
not indicate any difference in Mental Load, but the Temporal Load was higher (trend but not significant) with partial than full automation. This is in line with the results of Funke et al. [7], who found that workload and distress were alleviated in automated car driving when the driver retained lateral control. This could be because the drivers had to work harder at steering during partial automation than during the baseline condition, resulting in a significantly higher SWRR. In a study in which the driver’s preview difference (i.e., distance to the preceding truck) was varied, Damveld and Happee [5] found that with a shorter preview distance (i.e., 15 m or less), drivers experienced deteriorated lateral performance and increased steering activity. That finding is relevant to this study in which the preview distance was limited to ten metres, which could explain why the drivers had to work harder at steering during partial automation.
The present results regarding trust indicate that all trust measures are positively correlated, indicating that trust is gen-erally highest in the baseline condition with no difference between partial and full automation.
The same goes for driver acceptance of the system, where there was no difference between the two levels of automation, which were both rated as worse than the baseline condition. This result applies to both the AATT and QUIS measures, which were significantly correlated.
This study included no objective test of the drivers’ situa-tion awareness, though the Cooper–Harper Scales indicated that the drivers rated their situation awareness higher in both partial and full automation than in the baseline condition. Despite this, several studies have demonstrated that with au-tomation, car drivers are less prepared for unexpected events [18,27]. Studies have also demonstrated that with automation, car drivers are more willing to engage in non-driving tasks such as in-vehicle entertainment, paying less attention to the road ahead [3,10,11]. Although the literature treats car drivers and our study treats truck drivers, whose driving tasks differ, this finding may nevertheless indicate that drivers, whether of cars or trucks, believe that they have more situation awareness than they actually do, using theirBspare^attentional resources for non-driving activities.
Numerous studies have demonstrated that fatigue or sleep-iness increases with vehicle automation, and this study is no exception. There was a significant difference between baseline and full automation in that sleepiness was higher during full automation.Situation also had a main effect, in that heavy traffic and heavy traffic with fog led to more sleepiness than
did light traffic. There was also an interaction effect in that sleepiness increased more rapidly during partially and fully automated driving than in the baseline condition, suggesting that both levels of automation led to more sleepiness. Funke et al. [7] found that although full automation increased sleep-iness, sleepiness did not increase if the drivers retained lateral control. The present study found that retention of lateral con-trol did not prevent sleepiness, although it did help mitigate or delay its effects. One should bear in mind that in this study the treatment and baseline conditions differ not only in the degree of automation but also in the presence of another truck ten metres in front of the driver. It may be that the reduced visual stimuli due to a truck blocking their forward field of vision makes the drivers more fatigued than if they had a full forward view. This possibility cannot be confirmed based on this study, but may explain the difference between the present results and those of Funke et al. [7].
This study implies that, in designing a truck platooning system, two main factors must be considered, workload and sleepiness. The fully automated truck platoon has the advan-tage of being less exhausting for the drivers. The drivers do become sleepier, however, with full than with partial automa-tion, though they also become sleepier with partial automation than in the baseline condition, so sleepiness is something that must be considered for all levels of automation. The disadvan-tage of fully automated truck platooning is that it is more technically advanced and also has legal consequences. Gasser and Westhoff [8] identified five levels of automation, with partial automation, in which the driver must continuously monitor the system and be prepared to take over control at any time, being possible under current legislation. That does not necessarily exclude both lateral and longitudinal automation, but one can argue that driver preparedness to take over control at any time will be considerably compromised if the driving task is fully automated. In a similar study in the MODAS project, Krupenia et al. [13] found that, compared with a no-HMI condition, the full-no-HMI condition supported higher trust and a lower workload. These findings, along with those of the present study, together identify a need for well-designed HMIs in automated driving. Just adding automation that relieves the driver of some driving tasks without a well-designed HMI that keeps the driver an equal member of the driver–vehicle unit will likely lead to higher workload, more sleepiness, and lower trust.
6.1 Method discussion and research outlooks
Assituationwas not counterbalanced, the effect ofsituationin that heavy traffic and heavy traffic with fog led to more sleep-iness, may be an effect of the increased workload induced by traffic and weather, an effect of time on task, or a combination of both.
The treatment and baseline conditions differ not only their degree of automation but also in the presence of another truck ten metres in front of the driver. The reduced visual stimuli may make the drivers more fatigued, and this could be inves-tigated in a separate study. Also, the results may differ if looking at long term effects.
The indication that drivers are under the impression that they have more situation awareness than they do, leading them to use theirBspare^attentional resources for non-driving ac-tivities, merits further investigation.
7 Conclusions
Workload was higher for partial than for full automation or the baseline condition. Trust and acceptance were generally highest in the baseline condition, and did not differ between partial and full automation. Drivers may believe that they have more situation awareness during automated driving than they actually do. Both levels of automation led to a higher degree of sleepiness than in the baseline condition. The challenge when implementing truck platooning is to develop a system, including human–machine interaction (HMI), that does not overburden the driver, properly addresses driver sleepiness, and satisfies current legislation. The system also must be trusted and accepted by drivers. To achieve this, the develop-ment of well-designed HMI will be crucial.
Acknowledgements This work was supported by the Virtual Prototyping and Assessment by Simulation (ViP) competence centre (www.vipsimulation.se), co-financed by VINNOVA– the Swedish Governmental Agency for Innovation Systems (grant number 2007-03083) and the ViP partners.
Open AccessThis article is distributed under the terms of the Creative C o m m o n s A t t r i b u t i o n 4 . 0 I n t e r n a t i o n a l L i c e n s e ( h t t p : / / creativecommons.org/licenses/by/4.0/), which permits unrestricted use, distribution, and reproduction in any medium, provided you give appro-priate credit to the original author(s) and the source, provide a link to the Creative Commons license, and indicate if changes were made.
References
1. Åkerstedt T, Gillberg M (1990) Subjective and objective sleepiness in the active individual. Int J Neurosci 52:29–37
2. Åkerstedt T, Ingre M, Kecklund G, Anund A, Sandberg D, Wahde M, Philip P, Kronberg P (2010) Reaction of sleepiness indicators to
partial sleep deprivation, time of day and time on task in a driving simulator–the DROWSI project. J Sleep Res 19:298–309 3. Carsten O, Lai FCH, Barnard Y, Jamson AH, Merat N (2012)
Control task substitution in semiautomated driving: does it matter what aspects are automated? Hum Factors 54:747–761
4. Chin JP, Norman KL, Shneiderman B (1987) Subjective user eval-uation of CF PASCAL programming tools. Technical Report (CAR-TR-304). College Park, MD: Human-Computer Interaction Laboratory, Center for Automation Research, University of Maryland
5. Damveld H, Happee R (2012) Identifying driver behaviour in steering: effects of preview distance. In: Spink AJ, Grieco F, Krips OE, Loijens LWS, Noldus LPJJ, Zimmerman PH (eds) Measuring behaviour. Utrecht, The Netherlands, pp 44–46 6. Davila A (2013) SARTRE - report on fuel consumption. In
Deliverable No: 4.3, Doc Id: SARTRE_4_003_PU. Retrieved f r o m : h t t p : / / w w w. s a r t r e - p r o j e c t . e u / e n / p u b l i c a t i o n s / Documents/SARTRE_4_003_PU.pdf
7. Funke G, Matthews G, Warm JS, Emo AK (2007) Vehicle automa-tion: a remedy for driver stress? Ergonomics 50:1302–1323 8. Gasser T, Westhoff D (2012) BASt-study: Definitions of
Automation and Legal Isues in Germany. In (Vol. 2013).
http://onlinepubs.trb.org/onlinepubs/conferences/2012 /Automation/presentations/Gasser.pdf
9. Harper RP, Cooper GE (1986) Handling qualities and pilot evalua-tion. J Guid Control Dyn 9:515–530
10. Jamson AH, Merat N, Carsten O, Lai F (2011) Fully-Automated Driving: The Road to Future Vehicles. InDriving Assessment 2011: 6th International Driving Symposium on Human Factors in Driver Assessment, Training, and Vehicle Design
11. Jamson AH, Merat N, Carsten OMJ, Lai FCH (2013) Behavioural changes in drivers experiencing highly-automated vehicle control in varying traffic conditions. Transp Res Part C: Emerg Technol 30:116–125
12. Jian JY, Bisantz AM, Drury CG (2000) Foundations for an empir-ically determined scale of trust in automated systems. Int J Cogn Ergon 1(4):53–71
13. Krupenia S, Hjälmdahl M, Ahlström C, Bodin I, Fors C, Thorslund B, Wahlberg L. (2017). ADEMAS - Autonomous driving evalua-tion methodology and scenarios. In L. Nilsson (Ed.),ViP publication. Olaus Magnus väg 35, SE-581 95 Linköping, Sweden: VTI
14. Lintern G, Hughes T (2008) Developing a supervisory control rat-ing scale: Interim report. For Air Force Research Laboratory [AFRL-RHÖWP-TR-2008-0054]
15. Luximon A, Goonetilleke RS (2001) A simplified subjective work-load assessment technique. Ergonomics 44(3):229–243
16. Lyons JB, Stokes CK, Eschleman KJ, Alarcon GM, Barelka AJ (2011) Trustworthiness and IT suspicion an evaluation of the Nomological network. Hum Factors 53(3):219–229
17. Martens M, Wilschut E, Pauwelussen J (2008) Semi-Autonomous Driving: Do Drivers Still Respond to Unexpected Events? Proceedings from 15th World Congress on Intelligent Transport Systems and ITS America Annual Meeting, 5485–5496
18. Merat, N., & Jamson, A. H. (2009). How Do Drivers Behave in a Highly Automated Car?.Proceedings of the International Driving Symposium on Human Factors in Driver Assessment, Training and Vehicle Design, 5, 514–521.
20. Neubauer C, Matthews G, Langheim L, Saxby D (2012) Fatigue and voluntary utilization of automation in simulated driving. Hum Factors: J Hum Factors Ergon Soc 54:734–746
21. Neubauer C, Matthews G, Saxby D, Langheim L (2010) Simulator Methodologies for Investigating Fatigue and Stress in the Automated Vehicle.Advances in Transportation Studies, pp 7–18. 22. Parasuraman R, Sheridan TS, Wickens CD (2000) A model for types and levels of human interaction with automation. IEEE Trans Syst Man Cybern Part A: Syst Hum 30(3):286–297 23. Pauzie A, Manzano J, Dapzol N (2007) Drivers behaviour and
workload assessment for new in-vehicle technologies design. Proceedings of the 4th International Driving Symposium on Human Factors in Driver Assessment, Training, and Vehicle Design, Stevenson, WA, USA
24. Potter SS, Bressler JR (1989) Subjective workload assessment tech-nique (SWAT): a user's guide. Wright-Patterson Air Force Base: Armstrong Aerospace Medical Research Laboratory
25. Reid GB, Nygren TE (1988) The subjective workload assessment technique: a scaling procedure for measuring mental workload. In: Hancock P, Mishtake N (eds) Human mental workload, Amsterdam
26. Sheridan TB (1988) Trustworthiness of command and control sys-tems. In: Proceedings of the 2nd IFAC/IFIP/IFORS/IEA Symposium on Man-Machine Systems, Oulu, Finland, June 27. Strand N, Nilsson J, Karlsson ICM, Nilsson L (2014)
Semi-automated versus highly Semi-automated driving in critical situations caused by automation failures. Transp Res F 27:218–228 28. van der Laan JD, Heino A, de Waard D (1997) A simple procedure
for the assessment of acceptance of advanced transport telematics. Transp Res C 5(1):1–10
29. Van Winsum, W., Martens, M. & Herland, L. (1999) The effects of speech versus tactile driver support messages on workload, driver behaviour and user acceptance. Report TNO Human Factors Research Institute, Soesterberg, the Netherlands
30. Wang L, Jamieson GA, Hollands JG (2009) Trust and reliance on an automated combat identification system. Hum Factors 51(3): 281–291