ORIGINAL PAPER
Analyzing the moderating effects of respondent
type and experience on the fuel efficiency improvement
in air transport using structural equation modeling
Vedant Singh1&Somesh K. Sharma2
Received: 11 February 2016 / Accepted: 19 April 2016 / Published online: 30 April 2016 #The Author(s) 2016. This article is published with open access at SpringerLink.com
Abstract
Introduction The limited nature of oil, and hence aviation fuel is increasingly becoming a restraining factor for the air trans-port industry. Also, fuel efficiency is crucial for commercial air transport as fuel is one of the most costly operating param-eters for an airline.
MethodologyThis study employs structural equation model-ling (SEM) approach to identify key dimensions influencing fuel efficiency in air transport (FEAT) and to explore the cor-relational relationships among constructs from the perspec-tives of fuel efficiency improvement. Self-administered ques-tionnaires were used to collect data from 375 aviation experts. Correlation, multi-group moderation analysis, and interaction using structural equation model were used to analyses these data.
ResultsThe results and applications of SEM evolve a va-riety of findings; aircraft technology & design, aviation operations infrastructure, socioeconomic & political mea-sures, and alternative fuels & fuel properties, and aviation infrastructure are proved to be the five key influential di-mensions affecting the fuel efficiency and have a positive effect on the FEAT. In addition, the moderating effect of industry type and experience were established. The results also showed that no significant interaction effect between dimensions of FEAT.
Conclusions The findings of this research can provide air transport valuable information for designing appropriate strat-egy for fuel efficiency improvement.
Keywords Fuel efficiency in air transport (FEAT) . Multi-group moderation, Structural equation modelling (SEM) . Environmental impact
1 Introduction
The limited nature of oil, and hence aviation fuel is increas-ingly becoming a restraining factor for the air transport indus-try. Now, airlines are more attentive than ever to raise fuel efficiency due to rising fuel prices and competition among them [20, 36]. According to the projections of Penner [63] the global passenger air traffic, as measured in revenue pas-senger km, is estimated to grow by about 5 % per year be-tween 1990 and 2015, whereas total aviation fuel consump-tion, including passenger, freight, and military is projected to increase by 3 % per year. In addition, the fuel consumption of air transport industry has increased at a rate of more than 6 % over the previous 10 years, although, fuel production has de-veloped slowly, increasing at less than 6 % over the same period [20,53]. Also, the mean price of jet fuel has increased over the previous 10 years, which was above $120 a barrel [36,53]. The growing demand of jet fuel and high price will force air transport to improve fuel efficiency. Therefore, air-lines are adopting fuel efficient aircrafts, modifying operating practices, and implementing the socioeconomic & policy measures to improve the fuel efficiency of airlines [13,83]. The International Air Transport Association (IATA) seeks to raise fuel efficiency across the air transport industry by 1.5 % per annum up to 2020 [37], while the International Civil Aviation Organization (ICAO) is attempting for a 2 % per
* Vedant Singh [email protected]
1
Department of Mechanical Engineering, Abhilashi University, Chail-Chowk, Mandi 175028, HP, India
2 Department of Mechanical Engineering, National Institute of
annum improvement up to 2050 [38]. An improved fuel effi-ciency of airliners, and the consequent lower carbon emission, will reduce the operating cost of an airline along with envi-ronmental impact [62].
Fuel efficiency in air transport (FEAT) can be defined as ratio of fuel consumed in liters to revenue tonne kilometer (RTK) [4,13,51]. Fuel efficiency of transport aircrafts mainly depends upon two main factors i.e., technology & design, and aircrafts operations [4,51]. Further, aircraft technology & de-sign depends upon the engine efficiency, aerodynamic effi-ciency, and structural effieffi-ciency, while the aircraft operations relies on ground efficiencies, and airborne efficiencies [4,73, 74]. In case of aircraft technology & design, aerodynamic features such as blended wing body (BWB), flying wing, higher aspect ratios, and engines with higher bypass ratios are installed on modern jets to improve the fuel efficiency [1]. Aviation operations contain air traffic management proce-dures such as performance-based navigation, continuous de-scent approaches, reduced vertical separation minimum (RVSM) and various air traffic flow management systems, beside improved aircraft operating techniques [13,26].
For the previous few years, existing literature related to estimating air transport fuel efficiency have been limited. Inside the range of air transport fuel efficiency literature, Lee et al. [51] analyzed the relationship between aircraft fuel effi-ciency and cost, and estimated the aviation emissions reduc-tion potential based on analytical and statistical models. Babikian et al. [4] compared the fuel efficiency of different aircraft types, and emphasized that differences in fuel efficien-cy could be described largely by differences in aircraft opera-tions. Peeters et al. [62] analyzed the fuel efficiency of com-mercial aircraft since their initiation in the 1930s, and results showed that the last piston-powered aircrafts were at least twice as fuel-efficient as the first jet-powered aircraft. Williams (2007) highlighted the engineering options for the improvement in aircraft fuel efficiency, and these options had included the changes to airframes, engines, avionics, air traffic control systems, airspace design, and improved market based measures. Morrell [56] investigated the potential for greater fuel efficiency by utilizing larger aircraft and different opera-tional practices. Lee [50]; Lee and Mo [52] have presented the key technologies and policy issues for the induction of energy efficient, environmentally friendly innovations in aircraft sys-tems. Zou et al. [83] used ratio based, deterministic and sto-chastic frontier approaches to investigate fuel efficiency of transport aircrafts, and the results showed that potential cost savings of airlines. Singh and Sharma [74] explored the air-craft technology, operations, alternative fuels, socio-economic measures, and infrastructural factors for fuel efficiency im-provement. Chandra et al. [13] compared fuel efficiencies of selected airlines around the globe, and results found that, the average fuel efficiency of the airlines reported was is 0.4 L/ RTK (revenue tonne kilometer), respectively. Also, this study
has investigated the variances in fuel efficiency among airlines from different regions. Li et al. [53] employed the virtual frontier dynamic range adjusted measure to estimate the ener-gy efficiency of 22 airlines during the period of 2008–2012, and the results showed that the aggregate airline energy effi-ciency consistently increased from 2008 to 2012. Baklacioglu [5] employed a genetic algorithm-optimized neural network topology to predict the fuel flow-rate of a transport aircraft using real flight data, and results showed that the saving in fuel energy, and reducing flight costs.
While all these studies have evaluated the fuel efficiency of different airlines or aircrafts, a comprehensive examination of the relationship between fuel efficiency and its factors, has not been seen in the literature. Only the study of Singh and Sharma [73] analyzed the relationship between fuel efficiency and its factors using structural equation modelling (SEM). However, this study has not analyzed relationships between depend and independent factors of fuel efficiency. Also, mod-erating effect of industry type respondents and experience, and interaction effect were not discussed in the study of Singh and Sharma [73]. In this study, SEM approach using moderating and interaction effect is proposed to evaluate the relationships between the factors of fuel efficiency. Moreover, SEM has drawn the attention of many researchers as a com-monly adopted technique used to examine data about many airline disciplines including passenger loyalty [3], passenger’s overall satisfaction with an airport [6], a comprehensive rela-tionship marketing model [15], low cost carrier travelers [18], airline performance [42], airline service quality [48,75], fuel consumption optimization [73], cabin safety [14,34], custom-er loyalty [22,54], job satisfaction [17,57,81] and carbon offset scheme [16].
Therefore, the aims of this study are to explore the holistic relationships among the factors of FEAT, and to examine their effects using multigroup moderation and interaction. To achieve these goals, the critical factors related to fuel efficiency were extracted based on literature reviews, and a questionnaire was constructed for the assessment of FEAT. Self administrat-ed surveys of 375 experts of aviation were performadministrat-ed using the questionnaires to evaluate fuel efficiency perceptions in air transport. Based on the survey results, the conceptual fuel ef-ficiency model was tested using structural equation modeling. In the time of rising fuel prices and mounting environmental concerns, the FEAT model could help us to frame future strat-egies to improve fuel efficiency of air transport industry.
2 Hypotheses and research model
2.1 Hypotheses
Based on a review of existing literature on FEAT, five key factors that have direct effects on fuel efficiency improvement are identified as aircraft technology & design (ATD), aviation operations (AO), socioeconomic & policy measures (SEP), alternative fuels & their properties (AFP), and aviation infra-structure (AI) [4,26,50–52,62,73,74]. Our hypotheses in-clude five dimensions namely: ATD, AO, SEP, AFP, and AI. The detailed theoretical basis of the hypotheses, and observed variables will be analyzed in the following section.
2.1.1 Aircraft technology & design
ATD is an important dependent factor related to the fuel effi-ciency. According Williams (2007); Parker [61]; Graham et al. [24] and Miyoshi and Ibáñez [55] the technological advance-ment has resulted in a positive trend of fuel efficiency. ATD was measured from engine efficiencies, aerodynamic efficien-cies, and structural efficiencies [4,51]. Engine efficiencies were expressed in term of engine thrust specific fuel consump-tion (TSFC), lower value of TSFC result in better fuel effi-ciency [4,25]. Aerodynamic efficiencies were evaluated in term of lift/drag (L/D) ratio [74]; higher value of lift/drag ratio can result in improved fuel efficiency. Structural efficiencies were assessed in term of ratio of operating empty weight (OEW) to maximum takeoff weight (MTOW) [4,73]. The use of advanced composite material has reduced the structural weight of aircrafts [76]. Therefore, our construct include the TSFC, L/D ratio, OEW, and MTOW for the measurement of ATD dimension.
2.1.2 Aviation operations
AO is another important dependent factor related to the fuel efficiency. According to Peeters et al. [62] and Hileman et al. [32] improved aviation operations have resulted in better val-ue of fval-uel efficiency. The relationships between operational efficiency and efficiency are expressed by payload fuel effi-ciency equation [21,32]. Therefore, aircraft operational effi-ciency were measured in terms of parameters such as aircraft range [4,51], fuel weight, reserve fuel weight, payload, air-craft speed, crew weight, takeoff filed length, and landing filed length ([2,4,5,27,29,65]). Aircraft range is the total distance that an aircraft can fly with full fuel tank. We can improve the aircraft fuel consumption by optimizing the aircraft range. Optimized fuel weight, reserve fuel weight, and crew weight have also contributed toward the improved fuel efficiency [2,27]. The payload rate is another operational performance indicator that is commonly used to assess fuel burn. Air transport emission can be reduced with increased
payload (reduce the number of empty seats flown) while op-timizing the flight frequencies. Also, optimized aircraft speed [5], has also improved the fuel efficiency of airliners [4,65]. Optimum values of takeoff filed length, and landing filed length also affects positively the fuel efficiency. So, therefore we have included the aircraft range, fuel weight, reserve fuel weight, payload, aircraft speed, crew weight, takeoff filed length, and landing filed length to measure AO construct.
H2 (AOI)–The effective aviation operation & infrastruc-ture contribute positively towards the ERP.
2.1.3 Alternate fuels & their properties
AFP is another important independent factor related to the fuel efficiency. A viable alternative aviation fuel can stabilize fuel price fluctuation and reduce the reliance from the crude oil. Due to the high growth rate of aviation sector, supply security of fuel, and environmental impact of fuel has caused the avi-ation industry to investigate the potential use of alternative fuels [8]. Presently, it appears that a blend of kerosene and synthetic fuel will be possible for use in existing and near-term aircraft [7]. While, future mid-term aircraft may use a blend of bio-fuels and synthetic fuels in ultra-efficient airplane designs, and future long term engines and aircraft in the 50-plus year horizon may be specifically designed to use alterna-tive fuels with low to zero carbon content, such as liquid hydrogen or liquid methane [82]. Hence, based on past stud-ies, we tried to balance several factors when selecting AFP measures. The AFP parameters including fuel availability, net calorific value, energy density, aromatic content, carbon con-tent, thermal stability, and flash point [7,8,33,41,73,74] were shown to influence fuel efficiency, and hence were in-corporated in the current study.
fuels can be selected on the basis of compatibility with aircraft operations, fuel production technology, chemical, and physi-cal properties of fuel. Therefore, we hypothesized that:
H1:The AFP is positively related to ATD. H2:The AFP is positively related to AO.
2.1.4 Socioeconomic & policy measures
SEP is another important independent factor related to the fuel efficiency. The SEP was analyzed from several dimensions. Based on past studies, we tried to balance several factors when selecting SEP measures. The SEP parameters including social demand, fuel cost, voluntary measures, demand shift, passen-ger load factor, charging carbon emission, and taxing aviation fuel [12,46,52,68,69,72,74] were shown to influence fuel efficiency, and hence were incorporated in the current study.
Currently, the social demand for fuel efficient and low-emission aircraft is not strong enough because the general public is not well aware of the effects of aviation emissions on the global climate [52]. Also, the fuel cost is the main driver for improvements to aircraft fuel efficiency [4,74]. When fuel cost soar, airlines actively adopt advanced aircraft with greatly improved fuel efficiency. Another potential fuel efficiency measure is voluntary agreement [80] to meet envi-ronmental targets and funding of research to better understand the impact of aircraft higher fuel consumption. Demand shift [68] relates to another set of parameters affecting the FEAT, which account for changes in travelers’mode choice behavior (such as high speed trains, urban rail transit) or reduction of demand due to non-travel alternatives (such as video-conferencing, virtual meetings) [31] etc. In addition, the charging carbon emission is another most essential indicator affecting FEAT [9]. Finally, fuel tax [46] was also included in the study, which affects the fuel efficiency. Furthermore, high fuel prices may inspire manufacturers to focus on ATD which reduce fuel burn, rather than maximizing passenger comfort. These parameters could influence the success of SEP mea-sures aimed at reducing aviation’s fuel burn through techno-logical intervention. Also, the study of Singh and Sharma [73] had shown that the positive correlation exist between SEP and AO. Therefore, we hypothesized that:
H3:The SEP is positively related to ATD. H4:The SEP is positively related to AO.
2.1.5 Aviation infrastructure
AI also another important independent factor related with the fuel efficiency. Infrastructure improvements present a major opportunity for fuel efficiency improvement. Congestion at
the airport and inappropriate air traffic management raised the fuel burn of an aircraft [4]. We have included the indepen-dent variables- origin airport, destination airport, flight profile, runway design, taxiway, apron, and weather conditions, as suggested by Senzig et al. [67]; Upham et al. [77]; Kazda and Caves [45]; IATA [37]; Salah [66]; Simaiakis et al. [71]; Singh and Sharma [74] for AI construct. There are a number of ways that airports, airlines and air traffic management pro-viders can improve the air transportation system to minimize fuel burn. These include improving the use of the airspace, air traffic control, and operations. Further, improving the use of airspace and air traffic control includes the flexible use of airspace, route redesign, using the new tools and programmes to find most effective route, and reduced separation between the aircraft [26,32]. Also, developed AI has contributed to the ATD and AO for fuel improvement [26,74].
Finally, the study of Singh and Sharma [73] had analyzed the positive correlation between AFP, AFP-SEP, and AI-SEP. Therefore, we hypothesized that:
H5:The AI is positively related to ATD. H6:The AI is positively related to AO. H7:The AI is positively correlated to AFP. H8:The AFP is positively correlated to SEP. H9:The AI is positively correlated to SEP.
2.1.6 Respondents’type as a moderating effect on SEP and ATD
Respondents type have different understandings of outcomes they expect to get from FEAT because of the different nature of their functioning industry; also they are exposed to different organization environment i.e. aviation or academic, which may influence them in answering the survey questionnaires. Kim [47] examined the moderating effects of job relevance and experience on mobile wireless technology acceptance; the results found that significant moderating effect of job rele-vance. Therefore, we insisted that individuals’understanding about the importance of FEAT to their industry type would strengthen the relationship between SEP and ATD toward the FEAT. Thus, we hypothesized:
H3a:Industry type moderates the positive effect of SEP on ATD such the effect is stronger for aviation industry respondents than for academic respondents.
2.1.7 Experience as a moderating effect on SEP and AO
moderating effect of firm age on the relationships of airline performance, economic situation and internal operation. The results analyzed that significant moderating effect of lower age group and higher age group. It was, however, vital to examine closely at the influence of prior experience. Thus, to examine a user’s beliefs concerning BI on MWT, prior experience was considered by adding.
Therefore, we observed that there was a moderating effect of user experience (lower experience group, higher experience group) on the importance of SEP and AO as determinants of FEAT. Thus, we hypothesized:
H4a:Experience moderates the positive effect of SEP on AO such that the effect is stronger for higher experienced respondents than for lower experienced respondents.
2.1.8 Interplay between SEP, ATD, and AFP
We argue that when SEP measures are low, then there will be positive relationship between ATD and AFP for FEAT. Low or optimum SEP measures do not put pressure on airline to raise the ticket prices, to improve the technologies, and to adopt the suitable alternative fuel for fuel efficiency improve-ment [32,52]. In contrast, high SEP measures do not maintain a focus on travel demand rather than ATD and AFP. Thus, we hypothesized:
H1b: An increase in SEP will strengthen the negative relationship between ATD and AFP.
2.1.9 Interplay between SEP, AO, and AI
Finally, we argue that when SEP measures are low, then there will be positive relationship between AO and AI for FEAT. Low or optimum SEP measures create the opportunities for AI improvements, and implementation of successful measures AO for better fuel efficiency [26,50]. In contrast, high SEP measures put pressure on airlines. Thus, we hypothesized:
H6b: An increase in SEP will strengthen the negative relationship between AO and AI.
2.2 Research model
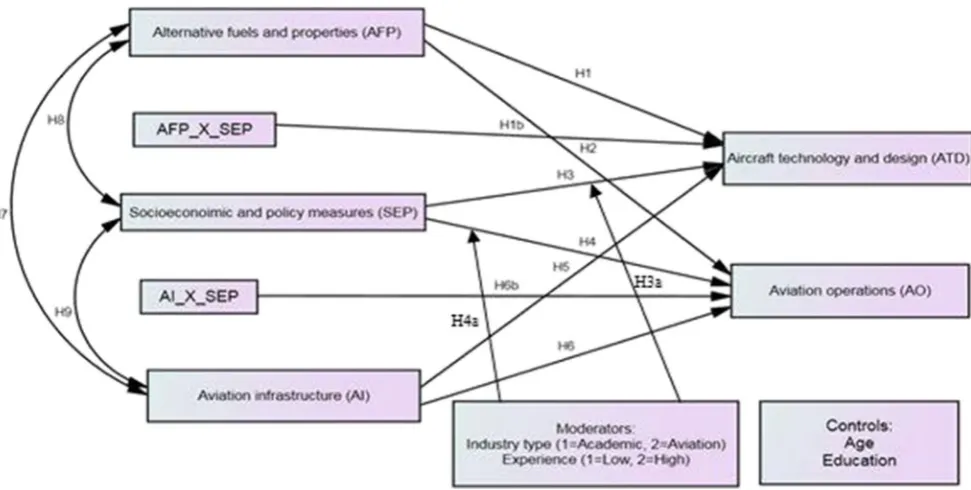
The conceptual research model of FEAT is shown in Fig.1. Because ATD, AO, AFP, SEP, and AI are represented by more than one measure, and these measures are related, each of the measurements can be represented by a latent variable. The above hypotheses reveals that AFP, SEP, and AI have a pos-itive and direct effect on ATD and AO. Therefore, hypotheses
H1, H2, H3, H4, H5, and H6 have a positive and direct effect on FEAT. Also, as shown in Fig.1hypotheses H3a, industry type respondents (1=Academic, 2=Aviation) is a full mediator of the impact of SEP on ATD. In addition, as depicted in Fig.1 hypotheses H4a, respondent’s experience (1=Low, 2=High) is a full mediator of the impact of SEP on AO. Finally, hypoth-eses H1b and H6b shows the interplay between AFP X SEP →ATD, and AI X SEP→AO.
The current study includes age and education level into the research model as control variables. This is important, because these variables may be significantly related to study constructs and may have confounding effects on the hypothesized rela-tionships. Further description of the decision variables is given in the appendix A.
3 Methodology
3.1 Instrument development
A survey instrument was developed in order to test the re-search model. Initially, the measurement items were reviewed by five aviation experts who were asked to comment on the appropriateness of the research constructs. Based on the as-sessment from the experts, redundant and ambiguous items were either changed or eliminated. New items were finally accepted and included in the questionnaire. Hence, the content validity of the survey instrument was considered as appropri-ate. The questionnaires along with a covering letter mention-ing objectives of the study were sent to various persons of government and private organizations dealing with the avia-tion. The specific sampling strategy was stratified random sampling. The main reasons for using a specific sampling strategy were to increase the precision in FEAT research and to reduce the sample variation and error.
aged between 45 and 54 years. The rest were older than 55. With respect to educational level, One hundred two (27 %) respondents had the graduation degree, while 129 (34 %) had the masters degree. The rest had PhD degrees. One hundred and sixty-six (44 %) respondents were from aca-demic organization and 209 (56 %) respondents were from aviation organization. One hundred and fifty-nine (42 %) respondents had the experience between 3 and 15 years, and 131 (26 %) had the experience between 16 and 30 years. The rest had the experience more than 31 years. In addition, the participants are divided into two major experience group i.e. low experience (between 3 and 15 years) and high experience (16 years and above). Furthermore, sample have included the occupation detail of respondents i.e. 39 directors (10 %), 63 managers (17 %), 96 research scientists (26 %), 11 aircraft pilots (3 %), 37 (10 %) professors, 48 (13 %) assoc. professors, 55 (15 %), asst. professors, 14 (4 %) lecturers, and 12 (3 %) senior lecturers. Table 1 shows the demographic characteristics of the sample.
3.2 The measuring instruments
The proposed model incorporates five constructs related to ATD, AOI, AFP, SEP, and AI. In total, 33 questions were used to measure the five constructs. Since the five con-structs in the proposed model of FEAT are unobserved variables, observed variables are designed as survey instru-ment to measure the five constructs. The questionnaire composed of two parts. The first part was provided with demographic characteristics of the sample as shown in
Table 1 and in the second part responses to the questions were based on a five-point Likert scale ranging from B1= strongly disagrees^ to B5= strongly agree^. The second part covers with the measurement of ATD with 4 items, AO with 8 items, SEP with 7 items, AFP with 7 items, and finally, the fifth construct with 7 items.
3.3 Techniques of data analysis
Structural equation modelling (SEM) is a multivariate tech-nique that allows the simultaneous estimation of multiple equations comprising factor analysis, multiple regression analysis, and path model analysis [28]. SEM is a handy statis-tical tool for evaluating the whole set of relationships among the latent constructs that are indicated by multiple measures defining a research model and for differentiating between the indirect and direct relationships between the latent constructs [24,73,79].
SEM includes two types of factor: exploratory and con-firmatory factor analysis. Exploratory factor analysis (EFA) is employed to obtain the structure of a set of mea-sured data [28]. EFA assesses the construct validity during the initial development of an instrument [73]. While in confirmatory factor analysis (CFA) is used to validate the hypotheses unobserved variables and latent variables [28]. In conducting SEM analysis, EFA was used to extract the principal factors, and CFA was then employed to validate the factor structure of the FEAT elements. SEM for FEAT perception was proposed using the factor structure from the CFA results. The AMOS 20.0 software package was employed to examine CFA and SEM.
4 Data analysis
4.1 Data screening
Data screening is the procedure of checking the data for errors and fixing or removing these errors. We have conducted the data screening in order to ensure the data is useable, reliable, and valid for testing causal theory.
Missing data:ATD2 and AFP3 had one missing value, which we imputed with the median. Missing values, occur when no data value is stored for the variable in an observation. The missing values can arise due to carelessness in observation, errors made during data entry, data loss due to misplacement etc. We have used median imputation because ATD2 and AFP3 are an ordinal variables (were measured using a Likert scale). In addition, controlling for outliers and maintaining
the normal distribution help in controlling the diversi-ty of the data.
Normality:The normality testing used in SEM is based on the value of skewness and kurtosis [10,28]. If the absolute kurtosis value of skewness and kurtosis is be-tween +2 and−2, the endogenous variables normality is acceptable [10,59]. As Table2displays, skewness ranges between−.047 and−1.000 and kurtosis values range be-tween 1.967 and−.182; the absolute value of kurtosis and skewness are less than ±2. Hence, the normality of the endogenous variables is acceptable. Additionally, the standard deviation of all the items was above 0.5 on five point scale. Therefore, their responses exhibit enough variance for better analysis.
Table 1 Demographic characteristics of the sample
Demographic categories Frequency Percentage (%)
Gender
Male 288 77
Female 87 23
Age (years)
24–34 126 34
35–44 97 26
45–54 65 17
55 and above 87 23
Education level
Graduation 102 27
Masters 129 34
Ph.D or Doctorate 144 38
Industry type
Academics 166 44
Aviation 209 56
Experience level
3–15 159 42
16–30 131 35
31 and above 85 23
Occupation
Directors 39 10
Managers 63 17
Research scientists 96 26
Aircrafts pilots 11 3
Professor 37 10
Associate professors 48 13
Assistant professors 55 15
Lecturer 14 4
Senior lecturer 12 3
Table 2 Normality test of FEA decision variables
Decision variables Skewness Kurtosis Std. Deviation
AFP1 .316 −.364 .831
AFP2 .122 −.782 .893
AFP3 .318 −.445 .885
AFP4 −.265 −.725 .927
AFP5 −.058 −.879 .946
AFP6 −.093 −.923 .955
AFP7 .069 −.637 .897
SEP1 −.699 1.019 .704
SEP2 −.724 1.374 .703
SEP3 −.590 .978 .705
SEP4 −.597 1.232 .682
SEP5 −.592 .963 .701
SEP6 −.605 1.097 .662
SEP7 −.374 −.006 .687
AI1 −.406 −.215 .927
AI2 −.456 −.182 .930
AI3 −.630 .267 .909
AI4 −1.000 1.331 .829
AI5 −.283 −.441 .956
AI6 −.665 .336 .859
AI7 −.773 .698 .861
ATD1 −.893 1.901 .670
ATD2 −.660 1.243 .650
ATD3 −.325 1.946 .549
ATD4 −.567 1.328 .631
AO1 −.739 1.048 .761
AO2 −.897 1.967 .723
AO3 −.614 1.028 .733
AO4 −.729 1.021 .762
AO5 −.690 1.124 .713
AO6 −.748 .711 .811
AO7 −.511 .728 .740
4.2 Exploratory factor analysis
We conducted an EFA using maximum likelihood with promax rotation to see if the observed variables loaded togeth-er as expected, wtogeth-ere adequately correlated, and met crittogeth-eria of reliability and validity. Maximum likelihood estimation was chosen in order to determine unique variance among items and the correlation between factors, and also to remain con-sistent with our subsequent CFA. Maximum Likelihood also provides a goodness of fit test for the factor solution. Promax was chosen because the dataset is quite large (n= 375) and promax can account for the correlated factors. We have ad-dressed each of these below for the final five-factor model depicted in the pattern matrix below.
4.2.1 Adequacy
Before conducting the exploratory factor analysis (EFA), the Bartlett’s test of sphericity and Kaiser–Meyer–Olkin (KMO) measure of sampling adequacy were used to assess the suit-ability of the questionnaire. The results reveal that KMO=0.937 and Bartlet’s test is significant atα= 0.000 with a Chi-square of 9779.544, indicating the suitability of conducting exploratory factor analysis, according to Kaiser [44]. After EFA, the individual items AFP1, AO6, and AO8 had the low communalities less than 0.400. Therefore, they were removed from the study.
In this study, factor loadings of 0.50 and higher will be considered practically significant [28, 30]; Lai and Chen [49]. Also, the AO1, and AO7 were not sufficiently loaded to their factor, so were also neglected. Finally, after removing these items, the communality for each item were sufficiently high (all above 0.500), thus indicating the chosen variables were adequately correlated for a factor analysis. Additionally, the reproduced matrix had only 4 % non-redundant residuals greater than 0.05, further confirming the adequacy of the var-iables and 5-factor model.
4.2.2 Reliability
Reliability for each of the factor was calculated using Cronbach’sαcoefficient. The Cronbach’sαcoefficient ranged from 0.849 to 0.938, as shown in Table3. All the factors’
reliability values were above the cut-off criterion of 0.7 recom-mended by Nunnally [60]; Hair et al. [28]; Cortina [19].
4.2.3 Validity
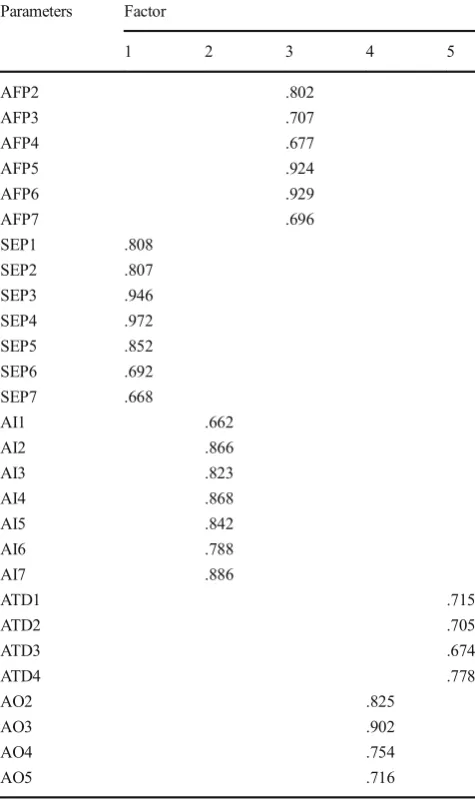
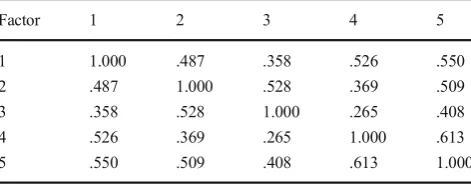
The Table4below illustrates a very clean factor structure in which convergent and discriminant validity are evident by the high loadings within factors, and no cross-loadings between factors. The factors demonstrate sufficient convergent validity, as their loadings were all above the 0.600 for a samples size of 375. Table4shows the factor loadings for each of the factor. Also, the factors demonstrate sufficient discriminant va-lidity, as the correlation matrix Table 5shows no correla-tions above 0.700. Finally, this five-factor model had a
Table 3 Relibility of
FEAT factors Factor Label Cronbach’s alpha
ATD 0.892
AO 0.849
AFP 0.915
SEP 0.912
AI 0.938
Table 4 Pattern matrix
Parameters Factor
1 2 3 4 5
AFP2 .802
AFP3 .707
AFP4 .677
AFP5 .924
AFP6 .929
AFP7 .696
SEP1 .808
SEP2 .807
SEP3 .946
SEP4 .972
SEP5 .852
SEP6 .692
SEP7 .668
AI1 .662
AI2 .866
AI3 .823
AI4 .868
AI5 .842
AI6 .788
AI7 .886
ATD1 .715
ATD2 .705
ATD3 .674
ATD4 .778
AO2 .825
AO3 .902
AO4 .754
AO5 .716
Extraction Method: Maximum Likelihood
total variance explained of 67.105 %, with all five extract-ed factors having eigenvalues above 1.0. The five factors in terms of FEAT perceptions derived from EFA were sim-ilar to those in previous studies [73, 74]. This confirmed that fuel efficiency perception can be summarized as ATD, AO, AFP, SEP, and AI.
4.3 Confirmatory factor analysis
4.3.1 Model fit
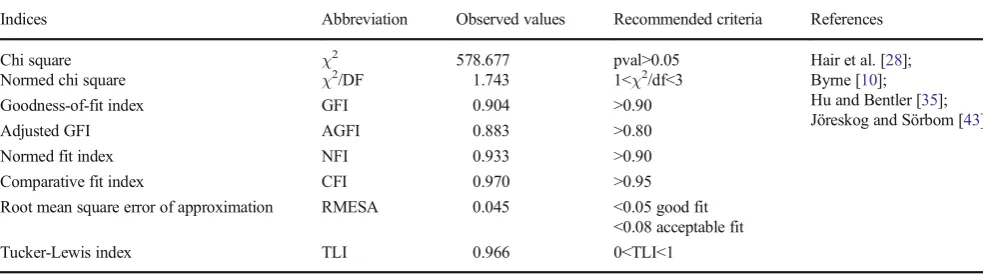
All the constructs have items with significant load-ings≥0.70. Modification indices were consulted to deter-mine if there was opportunity to improve the model. Accordingly, we covaried the error terms between e2-e5, e3-4, e6-e7, e12-e13, e12-e14, e13-e14, e18-19, and e23-24. Figure2 shows the measurement model of FEA. The Table6 below indicates that the goodness of fit for our measurement model is sufficient.
4.3.2 Validity and reliability
& To test for convergent validity (CV) we estimated the av-erage variance extracted (AVE). Table 7shows that the AVE are ranging from 0.588 to 0.687, so all values are above the recommended 0.50 levels [23], indicating that the convergent validity of the measurement model is confirmed.
& To test for discriminant validity we compared the square root of the AVE (on the diagonal in the Table7below) to all inter-factor correlations. Table7shows that the mean shared variance (MSVs) < AVEs. This was significantly lower than their individual AVEs. The results have dem-onstrated evidence of discriminate validity for the study constructs (Table7).
& We also computed the composite reliability (CR) for each construct. In all cases the CR was above the minimum threshold of 0.70 [28], indicating we have reliability in our constructs.
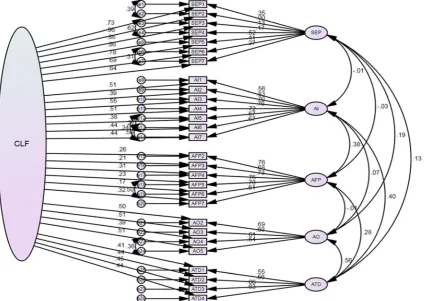
4.3.3 Common method bias
Because the data for both independent variables and depen-dent variables was collected using a single instrument (a sur-vey), we conducted a common method bias test to determine if a method bias was affecting the results of our measurement model. Figure 3 shows the Common Latent Factor (CLF) based model. The test we used was the Bunmeasured latent factor^ method recommended by Podsakoff et al. [64] and Siemsen et al. [70] for studies that do not explicitly measure a common factor (as in this work). Comparing the standard-ized regression weights before and after adding the CLF shows that none of the regression weights are dramatically affected by the CLF—i.e., the deltas are less than 0.200 and the CR and AVE for each construct still meet minimum thresholds. Nevertheless, to err on the conservative side, we have opted to retain the CLF for our structural model (by imputing composites in AMOS while the CLF is present), and thus we have CMB-adjusted values.
4.3.4 Invariance tests
Since we are planning on moderating the structural model with two categorical variables, we conducted configurable and metric invariance tests.
& Industry type:The model fit of the unconstrained mea-surement models (with groups loaded separately) had ad-equate fit (χ2/DF = 1.587; CFI =0.964), indicating that the model is configurally invariant. After constraining the models to be equal, we found the chi-square difference test to be significant (p= 0.000). Thus, our measurement model meets criteria for metric invariance across industry type as well.
& Experience: The model fit for experience was equally good (χ2/DF = 1.605; CFI =0.964). The chi-square differ-ence test was again significant (p= 0.000).
4.4 SEM analysis
4.4.1 Multivariate assumptions
Linearity:We tested linearity by performing curve esti-mation regression for all direct effects in our model. The results show that the relationships between variables are sufficiently linear (i.e., all p-values were less than 0.05). Multicollinearity: We tested the Variable Inflation Factor (VIF) for all of the exogenous variables simulta-neously. The VIFs were all less than 2.0, indicating that the exogenous variables are all distinct.
Table 5 Factor correlation matrix
Factor 1 2 3 4 5
1 1.000 .487 .358 .526 .550
2 .487 1.000 .528 .369 .509
3 .358 .528 1.000 .265 .408
4 .526 .369 .265 1.000 .613
5 .550 .509 .408 .613 1.000
Extraction Method: Maximum Likelihood
Fig. 2 Measurement model of FEAT
Table 6 Goodness of fit statistics in CFA
Indices Abbreviation Observed values Recommended criteria References
Chi square χ2 578.677 pval>0.05 Hair et al. [28];
Byrne [10]; Hu and Bentler [35]; Jöreskog and Sörbom [43]
Normed chi square χ2/DF 1.743 1<χ2/df<3
Goodness-of-fit index GFI 0.904 >0.90
Adjusted GFI AGFI 0.883 >0.80
Normed fit index NFI 0.933 >0.90
Comparative fit index CFI 0.970 >0.95
Root mean square error of approximation RMESA 0.045 <0.05 good fit <0.08 acceptable fit
4.4.2 Model fit of structural model
Figure 4 displays the outcomes of the initial structured model with standardized parameters while controlling for age, and education for DVs. The fitted structural model demonstrates adequate fit. In order to achieve good fit, we additionally covaried the error terms of the DVs and controls, as we wanted to account for their correlation without adding theoretical complexity to our model. While there may exist causal relationships between these variables, this is not the focus of this model. Table8shows the Goodness of fit statistics of structural model. Additionally, the controls did not have a significant impact on either dependent variable, except the respondents age
had a slight negative effect on ATD and AO (standardized beta for ATD and AO =−0.018*,−0.003*).
4.4.3 Hypotheses testing of the research model
All hypotheses were tested while controlling for age, and ed-ucation. Controlling for variables that may influence the rela-tionship between ATD, AO, AFP, SEP, and AI helps to min-imize unrelated effects. Furthermore, it helps to improve the robustness and validity of the results.
The relationship between two DVs, i.e., ATD, AO and three IVs, i.e., AFP, SEP, AI is determined by the proposed model. The proposed model hypotheses that the ATD, AO, and AFP, SEP, and AI are directly and indirectly interrelated. The standardized path loadings and their statistical signifi-cance are shown in Table8. It was found that nine paths out of fourteen specific hypotheses were statistically significant except for H2, H5, H9, H1b, and H6b.
The path coefficients in the SEM are shown in Fig.5and the results of the hypothesis testing are summarized in Table9. Table9show that hypothesis H1 is supported, because AFP has a positive impact on ATD (β= 0.101,p< 0.01). This im-plies that selection of suitable AFP depends upon the devel-opment of ATD, which contributes to the improvement of air transport fuel efficiency. Hence, this confirms that H1 is sup-ported. Also, the path coefficient between AFP and AO is Table 7 Reliability and validity in CFA
CR AVE MSV ASV AO SEP AI AFP ATD
AO 0.884 0.658 0.423 0.230 0.811 SEP 0.938 0.687 0.339 0.256 0.541 0.829 AI 0.934 0.669 0.296 0.240 0.369 0.502 0.818 AFP 0.912 0.634 0.296 0.174 0.262 0.377 0.544 0.796 ATD 0.851 0.588 0.423 0.306 0.650 0.582 0.524 0.434 0.767
Note; For Composite reliability (CR>.70); Convergent validity (CR>AVE>.50); Discriminate validity (MSV<AVE);MSVMaximum shared variance,ASVAverage shared variance [28]
0.035 (p> 0.05), which is a positive but not significant rela-tion, indicating that AFP has no significant positive impact on AO. This confirms that H2 is not supported. The path coeffi-cient between SEP and ATD is 0.368 (p< 0.01), which is a significant positive correlation, indicating that when air trans-port adopt and implement the SEP measures for ATD, their adoption and implementation increases fuel efficiency of air-lines, which supports hypothesis H3.
The path coefficient between SEP and AO is 0.0467 (p< 0.01), which is a significant positive correlation, indicat-ing that when air transport regulate and implement the SEP measures for optimal AO, their regulation and implementation increases fuel efficiency of airlines, which supports hypothesis H4. The path coefficient between AI and ATD is 0.042 (p> 0.05), which is a positive but not significant correlation, indicating that AI has no significant positive impact on ATD. This confirms that H5 is not supported. The path coefficient between AI and AO is 0.609 (p< 0.01), which is a significant positive correlation, indicating that proper planned AI in-creases the productivity of AO, which contributes to the im-proved fuel efficiency. Hence, this confirms that H6 is supported.
Also, the correlation between SEP and AFP, and SEP and AI were found to be positive (β= 0.053; 0.025) and significant (p< 0.01), and this confirms the results of previous study [73].
This indicates that the suitable amounts of SEP measures are necessary for AFP adoption and for the development of AI, which contribute to the improved fuel efficiency. Therefore, the hypothesis H7 and H8 are supported. Finally, AFP had no significant (β= 0.003,p> 0.1) effects on the AI. This is some-what at odds with previous study [73] showing that AFP had a correlation with the AI. This difference occurs because the AFP in this study was dominantly produced from near term synthetic fuels. So, there is no need to change the existing AI. This confirms that hypotheses H9 is not supported.
Multi-group moderationMulti-group moderation tests were conducted using the full model, but prior to adding the inter-action variables. To test the categorical moderation hypothe-ses, we produced the critical ratios for the differences in re-gression weights between groups of industry type (academic, aviation) and experience (low, high). From these critical ratios we calculated p-values to determine the significance of the difference. The results are summarized in the hypotheses sum-mary Table9below. The results in Table8indicated that SEP significantly and positively affected ATD for the both academ-ic (β= 0.268, p< 0.01) and aviation (β= 0.515, p< 0.01) group respondents. This has also showed that the effect of SEP on ATD were stronger for aviation group than the aca-demic group. Therefore, the hypothesis H3a is supported. Fig. 4 Initial structural model of
FEAT
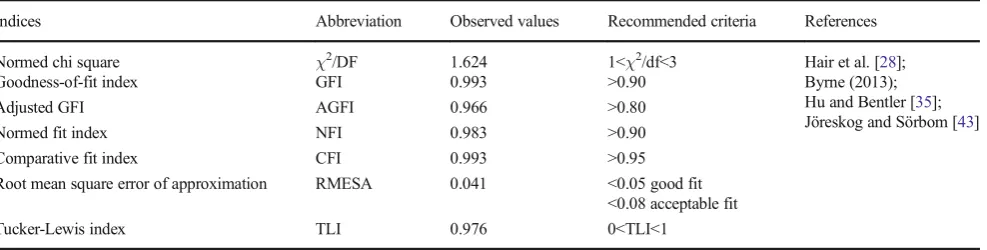
Table 8 Goodness of fit statistics of structural model
Indices Abbreviation Observed values Recommended criteria References
Normed chi square χ2/DF 1.624 1<χ2/df<3 Hair et al. [28];
Byrne (2013); Hu and Bentler [35]; Jöreskog and Sörbom [43]
Goodness-of-fit index GFI 0.993 >0.90
Adjusted GFI AGFI 0.966 >0.80
Normed fit index NFI 0.983 >0.90
Comparative fit index CFI 0.993 >0.95
Root mean square error of approximation RMESA 0.041 <0.05 good fit <0.08 acceptable fit
Furthermore, the results showed that SEP significantly and positively affected AO for both low (β= 0.380,p< 0.01) and high (β= 0.618,p< 0.01) experienced respondents. This has
also showed that the effect of SEP on AO were stronger for highly experienced group than the low experienced group. Therefore, the hypothesis H4a is supported.
Fig. 5 Structural model test results
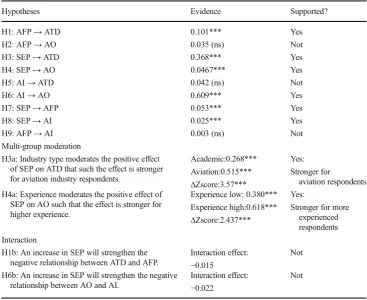
Table 9 Hypotheses summary
table Hypotheses Evidence Supported?
H1: AFP→ATD 0.101*** Yes
H2: AFP→AO 0.035 (ns) Not
H3: SEP→ATD 0.368*** Yes
H4: SEP→AO 0.0467*** Yes
H5: AI→ATD 0.042 (ns) Not
H6: AI→AO 0.609*** Yes
H7: SEP→AFP 0.053*** Yes
H8: SEP→AI 0.025*** Yes
H9: AFP→AI 0.003 (ns) Not
Multi-group moderation
H3a: Industry type moderates the positive effect of SEP on ATD that such the effect is stronger for aviation industry respondents.
Academic:0.268*** Aviation:0.515*** ΔZscore:3.57***
Yes: Stronger for
aviation respondents H4a: Experience moderates the positive effect of
SEP on AO such that the effect is stronger for higher experience.
Experience low: 0.380*** Experience high:0.618*** ΔZscore:2.437***
Yes:
Stronger for more experienced respondents Interaction
H1b: An increase in SEP will strengthen the negative relationship between ATD and AFP.
Interaction effect: −0.015
Not
H6b: An increase in SEP will strengthen the negative relationship between AO and AI.
Interaction effect: −0.022
Not
nsNot significant
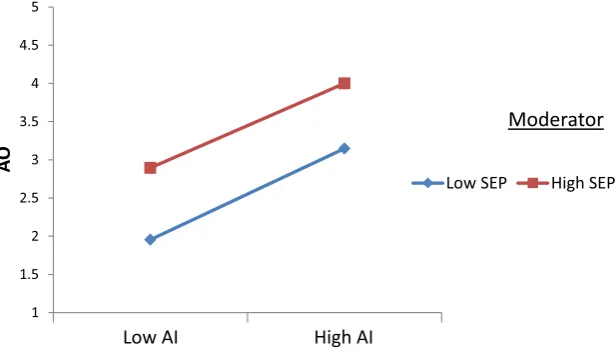
Two way interactionsInteraction effects were tested using the full dataset, rather than the moderated dataset. To test the interaction hypotheses we first standardized the IVs and then created product variables. In this case, none of the interactions were significant. We plotted these interactions as shown in Figs.6and7. When effect of SEP is low, then there is positive relationship between ATD and AFP as shown in Fig.6. But, when the effect of SEP is high, then there is negative relation-ship between ATD and AFP. So, SEP dampens the positive relationship between ATD and AFP. Thus, the hypothesis H1b is not supported. Furthermore, when effect of SEP is low, then there is positive relationship between AO and AI as shown in Fig.7. But, when the effect of SEP is high, then there is negative relationship between AO and AI. So, SEP dampens the positive relationship between AO and AI. Thus, the hy-pothesis H6b is not supported. Also, the results of the interac-tion tests are summarized in the Hypothesis Summary table below. Additionally, we observed that model fit was very g o o d (χ2/ D F = 1 . 0 7 8 ; C F I = 0 . 9 9 9 ; G F I = 9 9 4 ; RMSEA = 0.014) for the final moderated model.
5 Conclusions and implications
The study contributes to the extant literature as the instrument employed was effective in evaluating fuel efficiency in air transport and can therefore be confidently used again in FEAT related studies. This study attempts to identify the key FEAT-related factors. The results show that the key fuel effi-ciency improvement related factors in the air transport can be represented by five constructs (measured by 28 items), and this confirms the results of previous studies [73,74], although, some of measured items were different. The results of this study supported the new inclusions and casual relations in the FEAT model. The effect of new inclusions and casual relations has not been examined in previous studies.
The SEM analysis showed that AFP had a significant and positive (β= 0.101,p< 0.01) effect on ATD. This indicates that when we adopt new alternative fuel, air transport need to strengthen ATD for fuel efficiency improvement. The contri-butions of AFP and AO on fuel efficiency improvements were positive but not significant (β= 0.035,p> 0.05). This means 1
1.5 2 2.5 3 3.5 4 4.5 5
Low AFP High AFP
AT
D
Moderator
Low SEP High SEP
Fig. 6 Interaction between the AFP and SEP
1 1.5 2 2.5 3 3.5 4 4.5 5
Low AI High AI
AO
Moderator
Low SEP High SEP
that there is no need to change the aviation operations on the adoption of new alternative fuel. The selection of new aviation alternative will on near term synthetic fuels. SEP had a signif-icant positive effect (β= 0.368,p< 0.01) on ATD. This means that SEP strategies are very important in determining the tech-nological potentials for fuel efficiency improvement. Also, SEP had a significant positive effect (β= 0.0467,p< 0.01) on AO. This implies that regulation and implementation of suitable SEP measures are necessary for optimal AO. AI had a positive but not significant (β= 0.042,p= 0.675) relation with the ATD. This implies that AI are necessary for improved ATD, hence, for fuel efficiency. In addition, AI had a significant positive (β= 0.609,p> 0.01) effect on AO. This means that AI devel-opments are very important for fuel efficient aircraft operations. The moderating effect of industry type (academic, aviation) on SEP and ATD was also found to be positive and significant (academic = 0.268, aviation = 0.515, ΔZscore = 3.57, p< 0.01). The effect of SEP on ATD was stronger for aviation respondents than the academic respondents. This implies that the aviation respondents are well aware of the fuel efficiency aspects than the academics respondents. Also, this supports the validity of our FEAT model. Therefore, different levels of working environment will produce markedly different results in different modelling perspectives. In addition, The moderat-ing effect of experience (low, high) on SEP and AO was also found to be positive and significant (low experienced = 0.380, high experienced = 0.618,ΔZscore = 2.437,p< 0.01). The ef-fect of SEP on AO was stronger for more experienced respon-dents than the low experienced responrespon-dents. Nonetheless, it is important to consider both experience levels since this makes it possible to identify the difference between the moderation effects on the direct relationship between SEP and AO. After grouping the users according to their level of experience, in each group there should be respondents with both high and low experience. Nevertheless, when users are divided accord-ing to their level of aviation research experience, it is neces-sary to consider a source of bias—those users with high avi-ation research experience will have a more clear, and enduring attitude towards FEAT improvement.
We did not find clear support for the hypothesis on the two-way interaction between SEP and AFP on ATD. We also did not find evidence for our hypothesis on the two-way interac-tion of SEP and AI on AO. This implies that high SEP mea-sures put pressure on airlines for fuel efficiency improvement; so optimum SEP measures are necessary. Since fuel efficiency is primarily evaluated by factors such as ATD and AO, policy makers and transportation researchers need to focus on chang-ing the built environment in a way that does not promote extreme SEP measures.
This study, however, had one major limitation which must be noted. One is common to all survey research: a possible self reporting bias: some of the variables were self-reported. Future studies can also include some of the variables which were not
included in this study, such as aircraft size, wing span, tail areas, engine fan pressure ratio, engine turbine inlet temperature, initial cruise altitude, final cruise altitude, community awareness, vis-cosity, and storage stability. Furthermore, around 56 % of sam-ples have drawn from aviation firms, in the future, the sample size of airline industry insiders can be improved for more avia-tion industry specific model of ERP. The finding of the study will help aircraft manufacturer & airlines to frame their criteria regarding fuel efficiency improvement in air transport. The air transport sector can also prioritize the criteria on which they should focus in order to improve their performance. Finally, for improving the fuel efficiency from aviation the policy makers should focus on five dimensions & their relationship. Also, they should encourage for continued investment in air-frame and engine technology. Furthermore, the policy makers should introduce appropriate policies and incentives for sustain-able alternative fuels, improved air traffic management and air-port infrastructure, and more efficient operations of aircraft.
Appendix
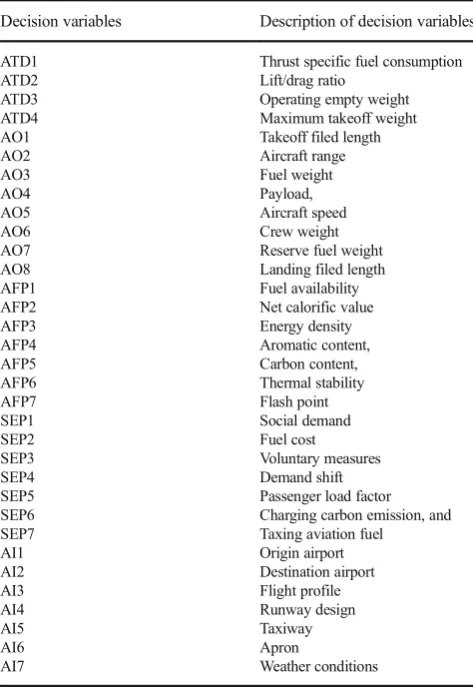
Table 10 Description of FEAT decision variables
Decision variables Description of decision variables
ATD1 Thrust specific fuel consumption ATD2 Lift/drag ratio
ATD3 Operating empty weight ATD4 Maximum takeoff weight AO1 Takeoff filed length AO2 Aircraft range AO3 Fuel weight AO4 Payload, AO5 Aircraft speed AO6 Crew weight AO7 Reserve fuel weight AO8 Landing filed length AFP1 Fuel availability AFP2 Net calorific value AFP3 Energy density AFP4 Aromatic content, AFP5 Carbon content, AFP6 Thermal stability AFP7 Flash point SEP1 Social demand SEP2 Fuel cost SEP3 Voluntary measures SEP4 Demand shift SEP5 Passenger load factor SEP6 Charging carbon emission, and SEP7 Taxing aviation fuel
AI1 Origin airport AI2 Destination airport AI3 Flight profile AI4 Runway design AI5 Taxiway
AI6 Apron
Survey instrument of FEAT study
Part 1: Respondents demographic information
1. Gender Male-
Female-2. Age (Years) 2434
3544
-45-54 - 55 and Above
-3. Education level Graduation - Post-graduation-
Doctorate-4. Industry type Academics -
Aviation-5. Experience level 3-15 - 16-30 - 31and Above
-6. Occupation
Director-
Manager-Research
Scientist-Aircraft Pilot-
Associate
Assistant Professor-
-Part 2: Survey questionnaire
You are requested to kindly weight these variables on five point likert scale for exploring importance rating in fuel consumption optimization in air transport sector.
Key: (1) Strongly Disagree (2) Disagree (3) Undecided (4) Agree (5) Strongly Agree
Decision Variable Unimportant Very important
Aircraft technology & design
1. Thrust specific fuel consumption (1) (2) (3) (4) (5) 2. Lift/drag ratio (1) (2) (3) (4) (5) 3. Operating empty weight (1) (2) (3) (4) (5) 4. Maximum takeoff weight (1) (2) (3) (4) (5) Aviation operations
5. Takeoff filed length (1) (2) (3) (4) (5) 6. Aircraft range (1) (2) (3) (4) (5) 7. Fuel weight (1) (2) (3) (4) (5) 8. Payload, (1) (2) (3) (4) (5) 9. Aircraft speed (1) (2) (3) (4) (5) 10. Crew weight (1) (2) (3) (4) (5) 11. Reserve fuel weight (1) (2) (3) (4) (5) 12. Landing filed length (1) (2) (3) (4) (5) Aviation alternative fuels & properties
13. Fuel availability (1) (2) (3) (4) (5) 14. Net calorific value (1) (2) (3) (4) (5) 15. Energy density (1) (2) (3) (4) (5) 16. Aromatic content, (1) (2) (3) (4) (5) 17. Carbon content, (1) (2) (3) (4) (5) 18. Thermal stability
19. Flash point
Socioeconomic & policy measures
20. Social demand (1) (2) (3) (4) (5) 21. Fuel cost (1) (2) (3) (4) (5) 22. Voluntary measures (1) (2) (3) (4) (5) 23. Demand shift (1) (2) (3) (4) (5) 24. Passenger load factor (1) (2) (3) (4) (5) 25. Charging carbon emission, and (1) (2) (3) (4) (5) 26. Taxing aviation fuel (1) (2) (3) (4) (5) Aviation infrastructure
Open AccessThis article is distributed under the terms of the Creative C o m m o n s A t t r i b u t i on 4. 0 I n t e r n a t i o n a l L i c e n s e ( h t t p : / / creativecommons.org/licenses/by/4.0/), which permits unrestricted use, distribution, and reproduction in any medium, provided you give appropriate credit to the original author(s) and the source, provide a link to the Creative Commons license, and indicate if changes were made.
References
1. Abbas A, de Vicente J, Valero E (2013) Aerodynamic technologies to improve aircraft performance. Aerosp Sci Technol 28(1):100– 132. doi:10.1016/j.ast.2012.10.008
2. Abdelghany K, Abdelghany A, Raina S (2005) A model for the airlines’fuel management strategies. J Air Transp Manag 11(4): 199–206. doi:10.1016/j.jairtraman.2004.10.002
3. Akamavi R, Mohamed E, Pellmann K, Xu Y (2015) Key determinants of passenger loyalty in the low-cost airline business. Tour Manag 46:528–545. doi:10.1016/j.tourman. 2014.07.010
4. Babikian R, Lukachko S, Waitz I (2002) The historical fuel effi-ciency characteristics of regional aircraft from technological, oper-ational, and cost perspectives. J Air Transp Manag 8(6):389–400. doi:10.1016/s0969-6997(02)00020-0
5. Baklacioglu T (2016) Modeling the fuel flow-rate of transport air-craft during flight phases using genetic algorithm-optimized neural networks. Aerosp Sci Technol 49:52–62. doi:10.1016/j.ast.2015. 11.031
6. Bezerra G, Gomes C (2015) The effects of service quality dimen-sions and passenger characteristics on passenger’s overall satisfac-tion with an airport. J Air Transp Manag 44–45:77–81. doi:10. 1016/j.jairtraman.2015.03.001
7. Braun-Unkhoff M, Riedel U (2014) Alternative fuels in avi-ation. CEAS Aeronaut J 6(1):83–93. doi: 10.1007/s13272-014-0131-2
8. Braun-Unkhoff M, Kathrotia T, Rauch B, Riedel U (2015) About the interaction between composition and performance of alternative jet fuels. CEAS Aeronaut J. doi:10.1007/ s13272-015-0178-8
9. Brueckner J, Zhang A (2010) Airline emission charges: ef-fects on airfares, service quality, and aircraft design. Transp Res B Methodol 44(8-9):960–971. doi:10.1016/j.trb.2010.02. 006
10. Byrne B (2010) Structural equation modeling with AMOS. Routledge, Taylor & Francis Group, New York
11. Byrne, B. M. (2013). Structural equation modeling with AMOS: basic concepts, applications, and programming. Routledge, Taylor & Francis
12. Carlsson F, Hammar H (2002) Incentive-based regulation of CO2
emissions from international aviation. J Air Transp Manag 8(6): 365–372. doi:10.1016/s0969-6997(02)00011-x
13. Chandra S, Chitgopeker C, Crawford B, Dwyer J, Gao Y (2014) Establishing a benchmark of fuel efficiency for com-mercial airline operations. J Aviat Technol Eng 4(1). doi:10. 7771/2159-6670.1097
14. Chang Y (2012) Cabin safety behavioral intentions of passengers with reduced mobility. J Air Transp Manag 25:64–66. doi:10.1016/ j.jairtraman.2012.08.010
15. Chao C, Chen H, Yeh T (2015) A comprehensive relationship mar-keting model between airlines and travel agencies: the case of Taiwan. J Air Transp Manag 47:20–31. doi:10.1016/j.jairtraman. 2015.03.015
16. Chen F (2013) The intention and determining factors for airline passengers’participation in carbon offset schemes. J Air Transp Manag 29:17–22. doi:10.1016/j.jairtraman.2013.01.001
17. Chen C, Kao Y (2011) The antecedents and consequences of job stress of flight attendants–Evidence from Taiwan. J Air Transp Manag 17(4):253–255. doi:10.1016/j.jairtraman.2011.01.002 18. Chou P (2015) An analysis of the relationship between service
fail-ure, service recovery and loyalty for Low cost carrier travelers. J Air Transp Manag 47:119–125. doi:10.1016/j.jairtraman.2015.05.007 19. Cortina J (1993) What is coefficient alpha? An examination of
theory and applications. J Appl Psychol 78(1):98–104. doi:10. 1037//0021-9010.78.1.98
20. Cui Q, Li Y (2015) Evaluating energy efficiency for airlines: an application of VFB-DEA. J Air Transp Manag 44–45:34–41. doi: 10.1016/j.jairtraman.2015.02.008
21. Drela M (2011) Design drivers of energy-efficient transport aircraft. SAE Int J Aerosp 4(2):602–618. doi:10.4271/2011-01-2495 22. Forgas S, Palau R, Sánchez J, Huertas-García R (2012) Online
drivers and offline influences related to loyalty to airline websites. J Air Transp Manag 18(1):43–46. doi:10.1016/j.jairtraman.2011. 08.003
23. Fornell C, Larcker D (1981) Evaluating structural equation models with unobservable variables and measurement error. J Mark Res 18(1):39. doi:10.2307/3151312
24. Graham W, Hall C, Vera Morales M (2014) The potential of future aircraft technology for noise and pollutant emissions reduction. Transp Policy 34:36–51. doi:10.1016/j.tranpol.2014.02.017 25. Green J (2009) The potential for reducing the impact of aviation on
climate. Tech Anal Strat Manag 21(1):39–59. doi:10.1080/ 09537320802557269
26. Grote M, Williams I, Preston J (2014) Direct carbon dioxide emis-sions from civil aircraft. Atmos Environ 95:214–224. doi:10.1016/ j.atmosenv.2014.06.042
27. Guerreiro Fregnani J, Müller C, Correia A (2011) A fuel tankering model applied to a domestic airline network. J Adv Transp 47(4): 386–398. doi:10.1002/atr.162
28. Hair J, Black W, Babin B, Anderson R, Tatham R (2010) Multivariate data analysis, 7th edn. Pearson Prentice Hall, Upper Saddle River
29. Henderson R, Martins J, Perez R (2012) Aircraft conceptual design for optimal environmental performance. Aeronaut J 116(3712):1– 22
30. Henson R (2006) Use of exploratory factor analysis in published research: common errors and some comment on improved practice. E d u c P s y c h o l M e a s 6 6 ( 3 ) : 3 9 3–4 1 6 . d o i :1 0 . 1 1 7 7 / 0013164405282485
31. Hihara K (2011) Analysis on bargaining about global climate change mitigation in international aviation sector. Transp Res E: Logist Transp Rev 47(3):342–358. doi:10.1016/j.tre.2010. 11.006
32. Hileman J, De la Rosa Blanco E, Bonnefoy P, Carter N (2013) The carbon dioxide challenge facing aviation. Prog Aerosp Sci 63:84– 95. doi:10.1016/j.paerosci.2013.07.003
33. Hileman J, Stratton R (2014) Alternative jet fuel feasibility. Transp Policy 34:52–62. doi:10.1016/j.tranpol.2014.02.018
34. Hsu Y, Liu T (2012) Structuring risk factors related to airline cabin safety. J Air Transp Manag 20:54–56. doi:10.1016/j.jairtraman. 2011.12.009
35. Hu L, Bentler P (1999) Cutoff criteria for fit indexes in covariance structure analysis: conventional criteria versus new alternatives. Struct Equ Model: Multidiscip J 6(1):1–55. doi:10.1080/ 10705519909540118
36. IATA, Annual Review (2015) Retrieved fromhttps://www.iata.org/ about/Documents/iata-annual-review-2015.pdf
38. ICAO, Environmental Report (2013) Retrieved fromhttp://cfapp. icao.int/Environmental-Report-2013/
39. Ismail N, Jenatabadi H (2014) The influence of firm age on the relationships of airline performance, economic situation and inter-nal operation. Transp Res A Policy Pract 67:212–224. doi:10.1016/ j.tra.2014.06.010
40. Janic M (2010) Is liquid hydrogen a solution for mitigating air pollution by airports? Int J Hydrog Energy 35(5):2190–2202. doi: 10.1016/j.ijhydene.2009.12.022
41. JanićM (2014) Greening commercial air transportation by using liquid hydrogen (LH2) as a fuel. Int J Hydrog Energy 39(29): 16426–16441. doi:10.1016/j.ijhydene.2014.08.011
42. Jenatabadi H, Ismail N (2014) Application of structural equation modelling for estimating airline performance. J Air Transp Manag 40:25–33. doi:10.1016/j.jairtraman.2014.05.005
43. Jöreskog K, Sörbom D (1993) LISREL 8. Scientific Software International, Chicago
44. Kaiser H (1974) An index of factorial simplicity. Psychometrika 39(1):31–36
45. Kazda A, Caves R (2007) Airport design and operation. Elsevier, Amsterdam
46. Keen M, Parry I, Strand J (2013) Planes, ships and taxes: charging for international aviation and maritime emissions. Econ Policy 28(76):701–749. doi:10.1111/1468-0327.12019
47. Kim S (2008) Moderating effects of job relevance and experience on mobile wireless technology acceptance: adoption of a smartphone by individuals. Inf Manag 45(6):387–393. doi:10. 1016/j.im.2008.05.002
48. Kuo C, Jou R (2014) Asymmetric response model for evaluating airline service quality: an empirical study in cross-strait direct flights. Transp Res A Policy Pract 62:63–70. doi:10.1016/j.tra. 2014.02.004
49. Lai W, Chen C (2011) Behavioral intentions of public transit pas-sengers—The roles of service quality, perceived value, satisfaction and involvement. Transp Policy 18(2):318–325. doi:10.1016/j. tranpol.2010.09.003
50. Lee J (2010) Can we accelerate the improvement of energy efficien-cy in aircraft systems? Energy Convers Manag 51(1):189–196. doi: 10.1016/j.enconman.2009.09.011
51. Lee J, Lukachko S, Waitz I, Schafer A (2001) Historical and future trends in aircraft performance, cost, and emissions. Annu Rev Energy Environ 26(11):167–200
52. Lee J, Mo J (2011) Analysis of technological innovation and envi-ronmental performance improvement in aviation sector. Int J Environ Res Public Health 8(9):3777–3795. doi:10.3390/ ijerph8093777
53. Li Y, Wang Y, Cui Q (2016) Energy efficiency measures for air-lines: an application of virtual frontier dynamic range adjusted mea-sure. J Renewable Sustainable Energy 8(1):015901. doi:10.1063/1. 4938221
54. MikulićJ, Prebežac D (2011) What drives passenger loyalty to traditional and low-cost airlines? A formative partial least squares approach. J Air Transp Manag 17(4):237–240. doi:10.1016/j. jairtraman.2010.09.005
55. Miyoshi C, Ibáñez E (2016) Are fuel-efficient aircraft worth investing in for non-Annex country airlines? An empirical analysis of Kenya Airways with an aircraft appraisal cost–benefit analysis model. Transp Policy 47:41–54. doi:10.1016/j.tranpol.2015.12.005 56. Morrell P (2009) The potential for European aviation CO2 emis-sions reduction through the use of larger jet aircraft. J Air Transp Manag 15(4):151–157. doi:10.1016/j.jairtraman.2008.09.021 57. Ng S, Sambasivan M, Zubaidah S (2011) Antecedents and
out-comes of flight attendants’job satisfaction. J Air Transp Manag 17(5):309–313. doi:10.1016/j.jairtraman.2011.03.007
58. Nojoumi H, Dincer I, Naterer G (2009) Greenhouse gas emissions assessment of hydrogen and kerosene-fueled aircraft propulsion. Int
J Hydrog Energy 34(3):1363–1369. doi:10.1016/j.ijhydene.2008. 11.017
59. Norman G, Streiner D (2008) Biostatistics. B.C. Decker, Hamilton 60. Nunnally J (1978) Psychometric theory. McGraw-Hill, New York 61. Parker R (2009) From blue skies to green skies: engine
technology to reduce the climate-change impacts of aviation. Te c h A n a l S t r a t M a n a g 2 1 ( 1 ) : 6 1–7 8 . d o i :1 0 . 1 0 8 0 / 09537320802557301
62. Peeters P, Middel J, Hoolhorts A (2005) Fuel efficiency of commer-cial aircraft: an overview of historical and future trends. National Aerospace Laboratory NLR, Amsterdam, pp 1–37
63. Penner J (1999) Aviation and the global atmosphere. Cambridge University Press, Cambridge
64. Podsakoff P, MacKenzie S, Lee J, Podsakoff N (2003) Common method biases in behavioral research: a critical review of the liter-ature and recommended remedies. J Appl Psychol 88(5):879–903. doi:10.1037/0021-9010.88.5.879
65. Ryerson M, Hansen M, Bonn J (2014) Time to burn: Flight delay, terminal efficiency, and fuel consumption in the National Airspace System. Transp Res A Policy Pract 69:286–298. doi:10.1016/j.tra. 2014.08.024
66. Salah K (2013) Environmental impact reduction of commercial aircraft around airports. Less noise and less fuel consumption. Eur Transp Res Rev 6(1):71–84. doi:10.1007/s12544-013-0106-0 67. Senzig D, Fleming G, Iovinelli R (2009) Modeling of terminal-area
airplane fuel consumption. J Aircr 46(4):1089–1093. doi:10.2514/ 1.42025
68. Sgouridis S, Bonnefoy P, Hansman R (2011) Air transportation in a carbon constrained world: long-term dynamics of policies and strat-egies for mitigating the carbon footprint of commercial aviation. Transp Res A Policy Pract 45(10):1077–1091. doi:10.1016/j.tra. 2010.03.019
69. Sheu J (2014) Airline ambidextrous competition under an emis-sions trading scheme–A reference-dependent behavioral perspec-tive. Transp Res B Methodol 60:115–145. doi:10.1016/j.trb.2013. 12.008
70. Siemsen E, Roth A, Oliveira P (2009) Common method bias in regression models with linear, quadratic, and interaction effects. O r g a n R e s M e t h o d s 1 3 ( 3 ) : 4 5 6–4 7 6 . d o i :1 0 . 1 1 7 7 / 1094428109351241
71. Simaiakis I, Khadilkar H, Balakrishnan H, Reynolds T, Hansman R (2014) Demonstration of reduced airport congestion through pushback rate control. Transp Res A Policy Pract 66:251–267. doi:10.1016/j.tra.2014.05.014
72. Simoes A, Schaeffer R (2005) The Brazilian air transportation sec-tor in the context of global climate change: CO2 emissions and mitigation alternatives. Energy Convers Manag 46(4):501–513. doi:10.1016/j.enconman.2004.06.017
73. Singh V, Sharma S (2014) Evolving base for the fuel consumption optimization in Indian air transport: application of structural equa-tion modeling. Eur Transp Res Rev 6(3):315–332. doi:10.1007/ s12544-014-0134-4
74. Singh V, Sharma S (2015) Fuel consumption optimization in air transport: a review, classification, critique, simple meta-analysis, and future research implications. Eur Transp Res Rev 7(2). doi: 10.1007/s12544-015-0160-x
75. Suki N (2014) Passenger satisfaction with airline service quality in Malaysia: a structural equation modeling ap-proach. Res Transp Bus Manag 10:26–32. doi:10.1016/j. rtbm.2014.04.001
77. Upham P, Thomas C, Gillingwater D, Raper D (2003) Environmental capacity and airport operations: current issues and future prospects. J Air Transp Manag 9(3):145–151. doi:10.1016/ s0969-6997(02)00078-9
78. Williams, V. (2007). The engineering options for mitigating the climate impacts of aviation. Philosophical Transactions of the Royal Society of London A: Mathematical, Physical and Engineering Sciences 365(1861):3047–3059
79. Williams L, Edwards J, Vandenberg R (2003) Recent advances in causal modeling methods for organizational and management re-search. J Manag 29(6):903–936. doi:10.1016/s0149-2063_03_ 00084-9
80. Yamaguchi K (2010) Voluntary CO2 emissions reduction scheme: analysis of airline voluntary plan in Japan. Transp Res Part D: Transp Environ 15(1):46–50. doi:10.1016/j.trd.2009.07.004 81. Yeh Y (2014) Exploring the impacts of employee advocacy on job
satisfaction and organizational commitment: case of Taiwanese air-lines. J Air Transp Manag 36:94–100. doi:10.1016/j.jairtraman. 2014.01.002
82. Zhang Y (2014) Special issue: aviation alternative fuels. Aerospace 1(3):100. doi:10.3390/aerospace1030100