Structures in Complex Networks
Jo¨rg Reichardt1,2*, Roberto Alamino3, David Saad3
1Complexity Sciences Center, University of California Davis, Davis, California, United States of America,2Institute for Theoretical Physics, University of Wu¨rzburg, Wu¨rzburg, Germany,3The Nonlinearity and Complexity Research Group, Aston University, Birmingham, United Kingdom
Abstract
Understanding a complex network’s structure holds the key to understanding its function. The physics community has contributed a multitude of methods and analyses to this cross-disciplinary endeavor. Structural features exist on both the microscopic level, resulting from differences between single node properties, and the mesoscopic level resulting from properties shared by groups of nodes. Disentangling the determinants of network structure on these different scales has remained a major, and so far unsolved, challenge. Here we show how multiscale generative probabilistic exponential random graph models combined with efficient, distributive message-passing inference techniques can be used to achieve this separation of scales, leading to improved detection accuracy of latent classes as demonstrated on benchmark problems. It sheds new light on the statistical significance of motif-distributions in neural networks and improves the link-prediction accuracy as exemplified for gene-disease associations in the highly consequential Online Mendelian Inheritance in Man database.
Citation:Reichardt J, Alamino R, Saad D (2011) The Interplay between Microscopic and Mesoscopic Structures in Complex Networks. PLoS ONE 6(8): e21282. doi:10.1371/journal.pone.0021282
Editor:Olaf Sporns, Indiana University, United States of America
ReceivedApril 21, 2011;AcceptedMay 24, 2011;PublishedAugust 1, 2011
Copyright:ß2011 Reichardt et al. This is an open-access article distributed under the terms of the Creative Commons Attribution License, which permits unrestricted use, distribution, and reproduction in any medium, provided the original author and source are credited.
Funding:This work was partially supported by the Volkswagen Foundation through a Fellowship Computational Sciences for J.R. and DAAD travel grants; support from The Leverhulme Trust (F/00 250/M) and the British Council ARC (1324) is acknowledged (D.S. and R.A.). This publication was funded by the German Research Foundation (DFG) and the University of Wuerzburg in the funding program Open Access Publishing. The funders had no role in study design, data collection and analysis, decision to publish, or preparation of the manuscript.
Competing Interests:The authors have declared that no competing interests exist.
* E-mail: [email protected]
Introduction
Networks are fascinating objects. Charting the interactions between system constituents, abstracted as edges and nodes, has allowed us to marvel the interconnectedness of systems and appreciate their complexity. Whether in foodwebs [1], social communities [2], protein-interaction [3], metabolism [4], neural networks [5] or communication [6], the network-metaphor has been highly successful in advancing our understanding of complex systems. Many insights were obtained through rigorous analysis and modeling of network structure. In fact, a primary goal of network research is to infer unobserved, or latent, node properties through structural analysis.
One hallmark of complex systems is that they exhibit structure at many scales. In particular, real-world complex networks will generally combine microscopic structural features resulting from single node properties with mesoscopic structural features due to group properties. Separating the two isessentialfor both correctly discovering mesoscopic structures as for inferring single-node behavior. Especially as node characteristics and functions may differ radically among individual nodes sharing the same group properties. To solve this problem, we advocate the use of generative probabilistic modeling and physically motivated inference techniques.
Though the statistical physics community has played a leading role in the cross-disciplinary effort to understand complex network structure [7], most analyses have avoided the problem of disentangling the microscopic from the mesoscopic scale. Rather,
they focus on either of the two, explaining network structure from either the microscopicorthe mesoscopic viewpoint. For example, when modeling degree distributions [6,8], analyzing the distribu-tions of centrality indices [9] or the distribudistribu-tions of small subgraphs, so-called motifs [10], group effects are rarely taken into account. Conversely, individual node properties are generally neglected in inferring latent node classes from network structure via block structure [11] or community detection algorithms [12]. As a result, one inevitably attributes individual node statistics to the inferred group properties and vice versa, leading to misinterpretation of individual node statistics and their significance on the one hand and inaccuracies in latent class identification on the other.
improved accuracy in predicting unobserved links as shown using a network of gene-disease associations from the Online Mendelian Inheritance in Man database.
Exponential random graphs
The probabilistic framework used is that of exponential random graph models (ERGMs) [13,14] as they exhibit several desired properties: ERGMs are mean unbiased and make the observed data maximally likely; they are maximum entropy models thus ensuring the generated networks are maximally random in all aspects other than those modeled explicitly. In other words, they parameterize the largest ensemble of networks compatible with our observations, while making the observed network typical for the ensemble. Additionally, they have a clear mapping onto the statistical physics framework of spin models and facilitate the combination of node and group specific properties using parameters that have a very intuitive interpretation.
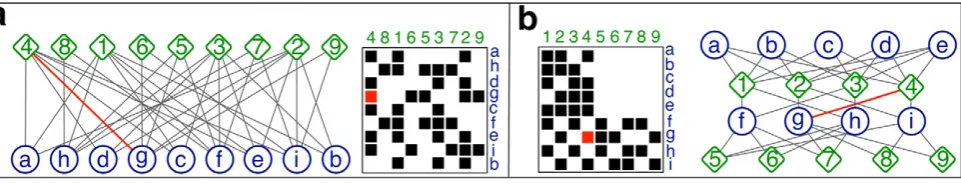
Consider a given, bipartite network specified by an N|M adjacency matrixA, representing for instance the attendance ofN actors inM events. If actor ihas attended eventm, thenAim~1 and otherwiseAim~0. Equally,Acould represent the association of N diseases with M different genes or the choices of N consumers from a list ofM products. The possibilities are many and we will use the actor-event picture, presented pictorially in figure 1, but without limiting the applicability of the model to this case alone.
We restrict ourselves todyadicmodels,i.e.we assume the entries of the adjacency matrixAim to be modeled by the conditionally independent random variablesDim[f0,1g. A simple ERGM that captures both individual (actor- and event-specific) and group-specific properties is given in terms of the odds ratio of actor i attending eventm:
P Dim~1j~hh
P Dim~0j~hh
~ ai
1{ai
ð Þ
bm
1{b m
BsiTm
1{BsiTm
: ð1Þ
The shorthand~hhin (1) denotes the set of all model parameters ~hh:a1,::,aN,b
1,::,bM,s1,::,sN,T1,::,TM,B
ð Þ. Note how the model
assumes a physically interpretable exponential form by rewriting the product of parameters in (1) as exp aizbmzCsiTm
where
ai~ln
ai 1{ai
,bm~ln bm
1{bm, andCsiTm~ln BsiTm 1{BsiTm
.
Interpret-ing the variables of the model matrixDas Ising spin-like variables,
the log of the likelihoodPDj~hhthen corresponds to the energy of an Ising spin-like system under the action of external fields a1,::,aN, b1,::,bM and C. In this parlance, parameter estimation
corresponds to determining the external fields that best matchDto the observed dataA.
Of all parameters ~hh only a small subset is relevant for an individual dyadDim in (1). The parameter ai[ð0,1Þ denotes the
globalactivityof actori, higheraimeans higher odds of attending
any event. Correspondingly,bm[ð0,1Þdenotes the globalpopularity of eventm. Furthermore, every actoriand every eventmcarry a class index si and Tm, respectively. The number of classes is determined a priori here; it represents a free parameter that defines the coarseness or resolution of the grouping sought. The matrixBrs[ð0,1ÞV r,s, models the data at a coarser, group specific
level, denoting the tendency orpreference of an actor of class r to attend an event of classs. Higher entries mean higher odds for the attendance of any actor of class r to any event of classs. The matrixBrsis also called a block model of the data.
The rich literature on ERGMs [15] has generally assumed prior knowledge of the class labelssiandTmin (1), or other covariates [16–19]. Then, learning the parameters of (1) practically reduces to a simple logistic regression. However, the learning task is considerably more complicated if the latent class labelssiandTm are unknown and need to be inferred. On the other hand, a growing body of work is dedicated to the development of efficient algorithms for learning general stochastic block models [20–24] includingthe hidden assignment of nodes into classes, butwithoutthe incorporation of node specific effects,i.e.a model specified by
P Dim~1j~hh
P Dim~0j~hh
~ BsiTm
1{BsiTm
: ð2Þ
This model is also referred to, with slight variations, as infinite relational model [25] or mixed membership stochastic block model [26]. Attempts to include the estimation of node specific effects have resulted in biased models [27–29]. Within the framework of ERGMs, node and group specific properties have been combined in so called latent space models [30,31] where nodes are assigned a position in an abstract space and links form as a function of their distance. Such models are well motivated for social networks, where homophily is a central mechanism of link formation and proximity in the latent space may be interpreted as similarity. Yet they are less general than stochastic block models
Figure 1. An actor-event network and its adjacency matrix. a,In the network, actors are represented as circles, events as diamonds. Links indicate the participation of an actor in an event. In the adjacency matrix, actors are represented by rows and events by columns. A non-zero (non-white) entry in rowi, columnmindicates participation of actoriin eventm. As an example, the edge between event4and actorgis highlighted in all network representations. Without the knowledge of latent classes for either actors or events, both representations appear unstructured.b,The same network as in a, but rows and columns of the adjacency matrix have been reordered, such that blocks in the adjacency matrix become apparent indicating the presence of latent classes of actors and events. We address the challenge of inferring such latent classes through statistical modeling, which leads to assertions of node properties or can generate improved network layouts.
being caught in the predicament of placing groups of nodes with similar interaction partners in close proximity while at the same time having to place them further apart if the nodes are not densely connected.
Our approach facilitates parameter estimates and latent class inference in a principled model (1) which combines node specific effects with the more general stochastic block models for group structure. To estimate model parameters efficiently, we employ distributive message-passing techniques, with computational com-plexity scaling linearly with the problem size. Generalizing the probabilistic model (1), algorithm and update equations to directed and undirected uni-partite networks is straightforward with some modifications. Most notably, in directed uni-partite networks, represented by an N|N adjacency matrix A, dyads are represented by 4-state variables Dij to account for all possible
directed connections between nodes i and j. Further, directed networks necessitate the introduction of a reciprocity parameter that explicitly models the co-occurrence of a link fromitojandjtoi. In the analysis presented here, we have allowed for reciprocities to vary depending on the latent classes of nodes. Details of the inference method used can be found in the Methods section and Material S1.
Results
Using three dedicated examples, we compare the effects of combining microscopic (node specific) with mesoscopic (group specific) effects as in model (1) versus including only one of the two scales.
Southern Women
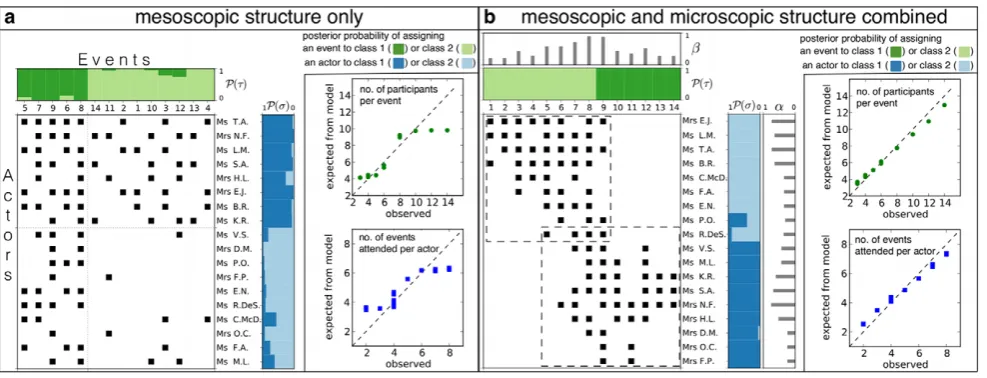
First, we demonstrate the impact of including microscopic (node specific) effects on inferred mesoscopic latent class structure. To this end we compare model (1) with the less expressive standard stochastic block model (2) using a dataset from sociology. This classic bipartite data set is due to ethnographers Davis, Gardner and Gardner [32]. A18|14matrix records the attendance of 18 women in southern Alabama to 14 informal social events over the course of a nine month period in the 1930s. The authors’ aim was to study how an individual’s social class influences her pattern of informal social interaction. Based on intuition and experience in the field, but without formal analysis, the authors suggested the existence of two latent classes of 9 women each, with only little overlap in the attendance at events. Over the years, the data has become a standard test case of network analysis algorithms, a meta-analysis of which can be found in [33]. We are interested in whether an inference based approach can assert the presence of latent social classes and whether the class assignments found correspond to those suggested by the experts.
If the network’s structure could be explained entirely due to a latent (social) classes, the standard stochastic block model (2) should be able to capture it. Allowing for two classes of actors and events, as suggested by the original authors, we learn the standard stochastic block model and estimate class membershipsi,Tmand preference matrixBrs. Figure 2a shows the data, with rows and
columns of the attendance matrix reordered such that events/ actors predominantly assigned to the same class are adjacent. The resulting block model is in stark contrast to findings of the original authors [32]. Events seem divided according to the number of participants (popularity) while actors seem divided according to the number of events participated in (activity). The expert classification due to social class is not correctly captured when trying to model the network through group effects alone. The reason is that under model (2), the degree distribution for members of the same latent class is assumed to be Poissonian. The expected
degree is the same for each member of a given class. The inset in figure 2a shows that this assumption cannot capture the observed degree distribution. Since the standard stochastic block model does not model node degree independently of class preference; variance in degree distributions of both actors and events confuses the inference of group membership.
In contrast, the inset in figure 2b shows the expected degree vs. the observed degree when activity and popularity parameters are included in the model (1) and allowing for two classes. Now, the observed degree distribution can be accounted for. The introduc-tion of activity and popularity parameters has also dramatic effects on the latent classes inferred. Figure 2b shows the attendance matrix, where rows and columns are ordered as given in [32] and the authors’ assignment to social class is indicated by dashed boxes. The experts’ classification matches almost perfectly that inferred using model (1). We can see that events such as8and9
which are attended by most actors receive highbvalues and thus have very little discriminative power. Also, actors who are very active and occasionally participate in events predominantly frequented by actors from the other group, such as Mrs. N. F., can still be assigned with high probability to a class, despite conflicting evidence in their participation record. Using model (1) effectively allows one to decouple the preference effects of a group of actors for a group of events from global effects that contribute to the variance in node connectivity.
Caenorhabditis elegans
Second, we examine the importance of including mesoscopic group effects in the interpretation of microscopic structural features. To this end, we study to which extent a dyadic model may explain the distribution of small sub-graphs (motifs) in the neural network of the nematodeC. elegans.
Motifs have received considerable attention as possible entities of network formation,i.e.building blocks larger than single edges. Their distribution relative to random null models has been suggested to characterize entire classes of networks [10]. The over/under-representation of certain motifs with respect to random null models is often attributed to possible evolutionary pressures due to a motif’s potential influence on the performance of the network’s function [34,35].
We study the distribution of all16possible3-node motifs in the
279neuron chemical synapse network ofC. elegans[36]. Figure 3a shows the corresponding adjacency matrix. The null model commonly used to assess whether a particular motif is under- or over-represented in a network is generated by randomizing the original network conserving only microscopic structural features, i.e.the number of incoming, outgoing and reciprocated links at each node is preserved. All other structural features and correlations are removed by the randomization. Figure 3b shows one typical adjacency matrix and box-plots for motif counts in 1000 such random networks compared to the actual count of the 16 motifs in the chemical synapse network ofC. elegans. Counts are normalized to the mean count found in the set of null models. We can see that using such a link randomized null model, 11 of the 16 motifs are strongly over/under-represented and hence would qualify as possible starting points for further research on putative functional relevance.
inevi-tably exists as neurons are located in different somatic regions and synaptic connections between closely located neurons are more likely than between distant ones [37]. Neurons are also aggregated in different ganglia making intra-ganglia connections more likely than inter-ganglia synapses. Furthermore, they serve different functions that influence their connectivity. For example, stimuli may be processed in a sensory neuron - interneuron - motor neuron cascade. The latent classes we infer from the data using the parallel model to (1) can be explained using a combination of these factors (see Material S1 and Dataset S1). More important than the interpretation of these classes is whether a dyadic model, which assumes all pairs of nodes as conditionally independent, can account for the observed three node motif-counts in the network. Figure 3c shows the box-plots of motif counts in 1000 networks generated from a model similar to (1) allowing for 15 different classes of neurons and using the parameters estimated from the
original network, again normalized to the mean count. The comparison with the motif-count in theC. elegans network now shows that only3out of16motifs cannot be explained by the null model and deviations from random expectations are much smaller. This result is remarkable as it underscores the importance of group specific effects in modeling complex networks. The fact that a simple dyadic model can explain a large portion of the three-node statistics in the observed data is a strong corroboration for our claim that latent classes of nodes are important determinants of network structure. Furthermore, it offers a very parsimonious explanation of motif statistics in this network and a more conservative estimation of their statistical significance.
Online Mendelian Inheritance in Man
Third, we determine the predictive ability and classification accuracy of model (1), which accounts for both node and group Figure 2. Attendance record of 18 women (rows) to 14 informal social events (columns), black squares indicate attendance. a) Attendance matrix with posterior probability of class assignment for actorsPð Þs and eventsP Tð Þas found by learning a standard stochastic block model (2). Classification inferred divides events according to number of attendants and actors according to the number of events participated in. The Inset shows the observed numbers of attendances do not agree well with the expectations due to model (2).b) The same attendance matrix as in a) but reordered due to the classification given in the original study indicated by dashed boxes [32]. Posterior probability of class assignments inferred using model (1) is almost perfectly compatible with the expert’s classification. Including node specific popularity and activity parametersbanda
allows to match observed numbers of attendances vs. expectations from model (1) as shown in inset. doi:10.1371/journal.pone.0021282.g002
Figure 3. Motif counts in the synapse network of C. elegans compared to two random null models. a) Adjacency matrix of the observed neural network [36].b) Adjacency matrix of a typical realization of a link randomized version of the original data and resulting Z-score statistics of motif counts. Counts in the original data (red x) are compared to box plots of counts in 1000 link randomized null models. Strong deviations are found at 11 of the 16 motifs. Since the link randomized null models retain only node specific features,i.e.the numbers of incoming, outgoing and reciprocated links at each node, the cannot capture the apparent mesoscopic structure in the original network and hence may over-estimate the statistical significance of some motifs.c) Adjacency matrix of a typical network generated from a model similar (1) with both node specific as well as class specific parameters estimated from the original network. 15 classes were used in this example. Using 1000 networks generated from this model as a reference ensemble, the Z-score statistics show mild deviations only at 3 of the 16 motifs. This indicates that class structure may offer a more parsimonious explanation for the observed motif distribution.
specific effects, compared to both less and more expressive models. To this end, we study the network of gene-disease associations from the Online Mendelian Inheritance in Man (OMIM) database.
This bi-partite network known as the human ‘‘Diseasosome-Network’’ [38] represents known associations between genes and diseases recorded in the OMIM database [39]. The network was first published in 2005 and we focus on the analysis of the largest connected component involving 516 different diseases and 903
different genes connected by1550different associations known in 2005 [38] (cf. Dataset S2). The original publication provided an expert classification of the diseases into 22 types. The type of disease is predominantly based on the tissues and organs involved (such as bone, connective tissue, muscular, dermatological, hematological, renal, etc.) or based on the affected system (such as skeletal, cardiovascular, immonological, metabolic or endochr-inal, etc.).
To what extent does such a classification overlap with one inferred from a network of common genetic causes? We compare model (1) with the less expressive standard stochastic block model (2) and a more expressive model due to Newman and Leicht (NL) [28]. The latter includes both individual and group effects as in (1), but instead of a single parameter for the overall activity or popularity of a node, it features one such parameter per latent class.
We compare the overlap between the expert classification of diseases and the one found algorithmically, based on the gene-disease association network alone. We restricted ourselves to using the same number of classes for both genes and diseases. The comparison of models (1), NL and the standard stochastic block model (2) is shown in figure 4a. As expected, neglecting individual node effects as in model (2) reduces the overlap with an expert classification compared to model (1). But, interestingly, the same applies when including gene-specific effects for every class of diseases and disease-specific effects for every class of genes as in the NL model. Too many explanatory variables per individual node seem to reduce the detection quality of latent classes.
Since 2005, the OMIM database has been steadily growing and
292 new associations between those516 genes and903 diseases had been added until June 2010. Using the data from 2005 as a training set and these new additions as a test set, we compare the predictive power of the different models for future associations. New entries to OMIM comprise both new variants of already known gene-disease associations (repeated associations) as well as genuine new associations of genes with diseases that were not linked previously. Hence, the data offers the opportunity to differentiate predictive power with respect to these two types of entries (cf. Dataset S3). Using the parameters estimated from the 2005 data set for each model (1), NL and (2), we calculate the probability for association of each gene iwith each diseasem as P Dimj~hh
. Then we sort these probabilities in descending order and hence obtain a candidate list for new or repeated associations. For instance, in the case of models with16classes (cf. Dataset S4), figure 4b shows how far one has to go down the candidate list to find a certain fraction of the associations that were added to the database over the course of 41=2years.
Variants of already known associations seem to be added approximately randomly to the database as models (1), NL and (2) all perform close the random expectation for repeated associations. For the genuinely new associations, however, we observe that all models strongly deviate from the random expectations. In particular (1) outperforms both NL and (2), with the latter two performing similarly.
Figures 4a and 4b show that the generative probabilistic model (1) captures the biologically relevant network structure, offering
high classification accuracy and a parsimonious inclusion of node-specific effects, which leads to a superior predictive ability.
Discussion
We have presented an efficient, distributive algorithm that successfully estimates the parameters and latent group assignments of an exponential random graph model including both node specific and group specific properties. We have shown that including node specific effects in the estimation of latent classes leads to improved recovery of class assignments by domain experts. Additionally, we have shown that including group specific effects in a random null model used to assess the statistical significance of microscopic network motifs may already suffice to explain a large part of the observed motif statistics. This finding sheds new light on the discussion of motif distributions in complex networks and we expect our results to stimulate a discussion on the use of appropriate null models in the analysis of sub-graph distributions and their universality for certain classes of networks. Finally, we have explored the predictive power of the model to identify new gene-disease associations, using the OMIM database. Through these specific examples, we have demonstrated that node specific and group specific properties should be both incorporated when inferring and modeling structural features in complex networks.
Methods
To describe the probabilistic inference algorithm used for estimating the parameters~hh, we first write the likelihood of the entire observed network adjacency matrixAin terms of our model (1):
L ~hh :PAj~hh~P imP
Dim~Aimj~hh
ð3Þ
For a dyadic model, the likelihood factorizes into terms that involve parameters associated with only two nodes.
Commonly used methods to estimate the parameters and hidden variables in such a model are to employ maximum likelihood (ML) techniques in the form of an expectation-maximization type algorithm or Monte Carlo sampling [40]. We prefer a Bayesian approach, based on Maximum A Posteriori (MAP) estimates that does not incur the computational cost of Monte Carlo sampling while being less sensitive to initial conditions and more stable numerically than ML, especially as the parameters which maximize (3) may lie on the the borders of the admissible interval ð0,1Þ. Furthermore, the MAP approach provides a natural Occam’s razor as the posterior distributions of parameter estimates can only reduce in variance with the provision of more data, while the ML approach assumes point estimates ord{functions for the posterior from the start. This is an important feature of the Bayesian approach as it provides a natural limit for the number of inferred classes and confidence levels in the assignments. Classes cannot be arbitrarily small if the posterior for the inter-class link preferenceBis to be localized. In contrast, under an ML approach the likelihood increases monotonically when more and hence smaller classes are used and model selection criteria, as in [19], are needed. Finally, Bayesian techniques offer a principled way to incorporate prior domain knowledge for obtaining a more accurate approximate marginal posterior distributionPðhkjAÞ, wherehk represents one
of the parametersai,si,bm,TmorBrs.
so-calledfactor-ordependency-graph, a graphical representation of the probabilistic dependencies between the variables (model param-eters) we wish to infer from the data, and the individual factors that constitute the likelihood (3). Figure 5A shows this for the case of a bi-partite network, likelihood (3) and model (1).
The algorithm proceeds by exchanging messages, conditional probabilities, between factors and variables connected in the dependency graph until convergence. Using the definitions:
Rim(hk):PDim~Aimjhk,A\Aimand
Qim(hk):PhkjA\Aim,
ð4Þ
one can interpretRimð Þhk (R-Message) as the likelihood of a single
observed matrix entryAimgiven only the parameterhkand all the
data matrix except for entryAim. Equally, Qimð Þhk (Q-Message) is
interpreted as the posterior probability distribution of parameter hk given the entire data matrix except for entryAim. For the sake of notational economy, we have adopted to identify functions by their argument. It is to be understood thatRimð Þai is a different
function thanRim bm andnotthe same functionRimð Þx evaluated at the pointsaiandbmas should be clear from the definitions (4). Formally, we obtain the R-Message from Aim to hk, by
integrating out all parameters excepthkfrom a likelihood function
Rim(hk)~
Xð
P Dim~Aimj~hh,A\Aim
P ~hh\hkjhk,A\Aim
d~hh\hk ð5Þ
Using the independence of given data entriesAim we can readily identifyP Aimj~hh,A\Aim
with theP Aimj~hh
of (1). Assuming the Figure 4. Classification accuracy and predictive power of network models (1), (2) and that by Newman/Leicht (NL) [28]. a) Overlap of an expert classification of diseases in the Diseasosome-Network [38] and that inferred using models and the data of known gene-disease associations recorded in the Online Mendelian Inheritance in Man (OMIM) database by Dec. 2005. Measure of overlap is normalized mutual information (NMI) [43].b) Prediction accuracy at16classes for confirmed associations added to the OMIM database between Dec. 2005 and Jun. 2010. For each model, a candidate list of associations is obtained by sorting all possible associations in descending order according to their probability under that model with parameters estimated from the Dec. 2005 data. We plot which fraction of actually confirmed associations is found in the corresponding top fraction of the candidate list. Entries due to new variants of a previously recorded association are listed as ‘‘repeated associations’’ while genuine new associations are reported as ‘‘new associations’’. For example: In the top1%of any candidate list, we expect to find1%of new associations due to chance alone. We do find15%of all confirmed new associations if the list was due to model (2),20%if the list was due to the NL model and30%if the list due to model (1). See text for details. doi:10.1371/journal.pone.0021282.g004
Figure 5. Factor graphs and an example of an elementary message passing update.Factors of the likelihood function are represented as squares, variables of the generative model as circles. Connections indicate which variables enter the calculation of which factor.a) For a bipartite actor-event networks represented by anN|Madjacency matrixAim, class labelsiand activityaiof actorienter in the calculation of all factors in
rowi. Equivalently, class labelTmand popularitybmof event menter in the calculation of all factors in column m. The variablesBrs denoting preference of actors in classrfor events in classsenter in every factor. Note that while each factor depends on onlyOð Þ1 variables, thesanda
variables enter in the calculation ofOð Þ, theN T andbvariables inOðMÞand theBrsvariables inOðNMÞfactors.b) Pictorial representation of the messages involved in calculatingRimð Þsi sent from factorAimto variablesiaccording to equation (9).c) For directed networks represented by
non-symmetricN|Nadjacency matrices, the factors correspond to dyadsDij~Aij,Aji. Additional to the interclass preference matrix, a symmetric matrix of reciprocitiesrrsis included in the model. Every nodeicarries a single class labelsi, activityaiand attractiveness parameterbi. The variables
joint distribution P ~hhjA\Aim
factorizes with respect to every singlehk, one obtains the following closed set of equations:
Rimðhk~xÞ ~
X ð
P Dim~Aimj~hh
P ‘=k
Qimð Þh‘ dh‘ and
Qimðhk~xÞ ! Pð Þhk P jn=im
Rjnðhk~xÞ:
ð6Þ
Although the factorization assumption may seem strong, it merely means that the Q-MessagesP hkjA\Aim
for any two variableshk
and h‘ with k=‘ are assumed independent. Given that these
distributions are conditioned on the entiredata matrix except for one entry, the error we make using this assumption is considered negligible for large systems. The form of calculatingQimðhk~xÞin
(6) follows directly from Bayes’ theorem and Pð Þhk is the
distribution we use to include prior information. These equations can be iterated until convergence after which we finally obtain the desired approximate marginal posterior distribution, for every single parameter, as:
PðhkjAÞ!Pð Þhk P
imRimð Þhk : ð7Þ
To illustrate these ideas, explicit update equations for the inference of the hidden class index si of node i appear below.
Expressions for other parameters are reported in Material S1. With
Xrsim: ð
P Dim~Aimjai,bm,si~r,Tm~s,Brs
|
Qimð Þai Qim bm QimðBrsÞdaidbmdBrs,
ð8Þ
we can write for the R- and Q-Messages betweenAimandsi:
Rimðsi~rÞ~
X
s
XrsimQim Tm~s
and
Qimðsi~rÞ!Pðsi~rÞP
n=m
Rinðsi~rÞ:
ð9Þ
The dependency graph greatly facilitates setting-up these update equations. Following the rules that R-Messages are always sent from factors to variables and Q-Messages from variables to factors; and that in R-Messages, we sum or integrate over the incoming Q-messages, while Q-Messages are proportional to the
product of incoming R-Messages, we can write the equations based on the dependency graph. Figure 5B shows a detail of 5A focussing on factorAim to illustrate the messages involved in the calculation of Rimð Þsi sent to variable si as in (9). Figure 5C
illustrate the update equations in the case of directed uni-partite networks (cf. Material S1).
Supporting Information
Material S1 The complete update equations for
learn-ing model (1) for bi-partite networks, undirected uni-partite networks and directed uni-uni-partite networks. Further, it shows an example application of our method to an undirected uni-partite network, paralleling our Southern Women example in figure 2, plots of the adjacency matrix of the neural network ofc. elegansand the model parameters estimated and used to generate the ensemble of random null models necessary for the motif analysis shown in figure 3; a description of the Newman-Leicht method [28] used in our OMIM example and matrix plots of the diseasosome network with parameter estimates as used for the generation of figure 4b.
(PDF)
Dataset S1 The parameters estimated and the latent
class assignments for the nodes of the chemical synapse network ofc. elegansas used to generate figure 3. (TXT)
Dataset S2 The gene disease associations from the
OMIM database as of Dec. 2005. (TXT)
Dataset S3 The gene disease associations added to the
OMIM database after Dec. 2005. (TXT)
Dataset S4 An example of parameter estimates and the
assignments into 16 latent classes using model (1) of diseases from the OMIM database as used in figure 4b. (TXT)
Acknowledgments
We would like to thank M. Weigt, S. Bornholdt, D.R. White, and J.P. Crutchfield for stimulating discussions. J.R. thanks the members of the Complexity Sciences Center at UC Davis for their hospitality.
Author Contributions
Conceived and designed the experiments: JR RA DS. Performed the experiments: JR RA DS. Analyzed the data: JR RA DS. Contributed reagents/materials/analysis tools: JR RA DS. Wrote the paper: JR RA DS.
References
1. Dunne JA, Williams RJ, Martinez ND (2002) Food-web structure and network theory: The role of connectance an. Proc Natl Acad Sci USA 99: 12917–12922.
2. Girvan M, Newman MEJ (2002) Community structure in social and biological networks. Proc Natl Acad Sci USA 99: 7821–7826.
3. Sharan R, Ulitsky I, Shamir R (2007) Network-based prediction of protein function. Molecular Systems Biology 3: 88.
4. Guimera R, Amaral LAN (2005) Functional cartography of complex metabolic networks. Nature 433: 895–900.
5. Honey CJ, Sporns O, Cammoun L, Gigandet X, Thiran JP, et al. (2009) Predicting human resting-state functional connectivity from structural connec-tivity. Proc Natl Acad Sci USA 106: 2035–2040.
6. Baraba´si AL, Albert R (1999) Emergence of scaling in random networks. Science 286: 509–512.
7. Baraba´si AL (2009) Scale-free networks: A decade and beyond. Science 325: 412–413.
8. Song C, Havlin S, Makse HA (2005) Self-similarity of complex networks. Nature 433: 392–395.
9. Jeong H, Mason S, Baraba`si AL, Oltvai ZN (2001) Lethality and centrality in protein networks. Nature 41: 41–42.
10. Milo R, Shen-Orr S, Itzkovitz S, Kashtan N, Chkloviskii D, et al. (2002) Network motifs: Simple building blocks of complex networks. Science 298: 824–827.
11. Doreian P, Batagelj V, Ferligoj A (2005) Generalized Blockmodeling. New YorkNY, , USA: Cambridge University Press.
12. Fortunato S (2010) Community detection in graphs. Physics Reports 486: 75–174.
13. Holland P, Leinhardt S (1981) An exponential family of probaility distributions for directed graphs. J Am Stat Assoc 76: 33–65.
15. Various authors (2007) Special section: Advances in exponential random graph (p*
) models. Soc Networks 29.
16. Fienberg SE, Wasserman S (1981) Categorical data analysis of single sociometric relations, San Francisco: Jossey-Bass. pp 156–192.
17. Holland PW, Laskey KB, Leinhardt S (1983) Stochastic block- models: first steps. Soc Networks 5: 109–137.
18. Wang YJ, Wong GY (1987) Stochastic blockmodels for directed graphs. J Am Stat Assoc 82: 8–19.
19. Bianconi G, Pin P, Marsili M (2009) Assessing the relevance of node features for network structure. Proc Natl Acad Sci USA 106: 11433–11438.
20. Nowicki K, Snijders T (2001) Estimation and prediction for stochastic blockstructures. J Am Stat Assoc 96: 1077–1087.
21. Snijders TA, Nowicki K (1997) Estimation and prediction for stochastic blockmodels for graphs with latent block structure. Journal of Classification 14: 75–100.
22. Daudin JJ, Picard F, Robin S (2008) A mixture model for random graphs. Stat Comput 18: 173–183.
23. Guimera` R, Sales-Pardo M (2009) Missing and spurious interactions and the reconstruction of complex networks. Proc Natl Acad Sci USA.
24. Bickel PJ, Chenb A (2009) A nonparametric view of network models and Newman–Girvan and other modularities. Proc Natl Acad Sci USA 106: 21068–21073.
25. Kemp C, Tenenbaum JB (2006) Learning systems of concepts with an infinite relational model. In: Proceedings of the 21st National Conference on Artificial Intelligence.
26. Airoldi EM, Blei DM, Fienberg S, Xing EP (2008) Mixed membership stochastic blockmodels. Journal of Machine Learning Research 9: 1981–2014. 27. Morup M, Hansen LK (2009) Learning latent structure in complex networks. In:
NIPS Workshop on Analyzing Networks and Learning with Graphs;2009. 28. Newman M, Leicht E (2007) Mixture models and exploratory data analysis in
networks. Proc Natl Acad Sci USA 104: 9564–9569.
29. Karrer B, Newman M (2011) Stochastic blockmodels and community structure in networks. Phys Rev E 83: 016107.
30. Hoff PD, Raftery AE, Handcock MS (2002) Latent space approaches to social network analysis. Journal of the American Statistical Association 97: 460. 31. Krivitsky PN, Handcock MS, Raftery AE, Hoff PD (2009) Representing degree
distributions, clustering, and homophily in social networks with latent cluster random effects models. Soc Networks 31: 204–213.
32. Davis A, Gardner BB, Gardner MR (1941) Deep South: A social anthropolog-ical study of caste and class. University of Chicago Press.
33. Freeman LC (2003) Dynamic Social Network Modeling and Analysis, The National Academies Press, chapter Finding Social Groups: A Meta-Analysis of the Southern Women Data . pp 39–77.
34. Milo R, Itzkovitz S, Kashtan N, Levitt R, Shen-Orr S, et al. (2004) Superfamilies of evolved and designed networks. Science 303: 1538–1542.
35. Reigl M, Alona U, Chklovkii DB (2004) Search for computational modules in the c. elegans brain. BMC Biology 2.
36. Chen BL, Hall DH, Chklovskii DB (2006) Wiring optimization can relate neuronal structure and function. Proc Natl Acad Sci USA 103: 4723–4728. 37. Artzy-Randrup Y, Fleishman SJ, Ben-Tal N, Stone L (2004) Comment on
‘‘Network motifs: Simplebuilding blocks of complex networks’’ and ‘‘Superfam-ilies of evolved and designed networks’’. Science 305: 1107.
38. Goh KI, Cusick ME, Valle D, Childs B, Vidal M, et al. (2007) The human disease network. Proc Natl Acad Sci USA 104: 8685–8690.
39. Hamosh A, Scott AF, Amberger JS, an dVictor A McKusick CAB (2004) Online mendelian inheritance in man (omim), a knowledgebase of human genes and genetic disorders. Nucleic Acids Res 33: D514–D517.
40. Handcock MS, Hunter DR, Butts CT, Goodreau SM, Morris M (2008) statnet: Software tools for the representation, visualization, analysis and simulation of network data. Journal of Statistical Software 24: 1–11.
41. MacKay D (2003) Information Theory, inference and learning algorithms. Cambridge University Press.
42. Opper M, Saad D, eds (2001) Advanced Mean Field Methods. MIT Press. 43. Fred AL, Jain AK (2003) Robust data clustering. Computer Vision and Pattern
![Figure 4. Classification accuracy and predictive power of network models (1), (2) and that by Newman/Leicht (NL) [28]](https://thumb-us.123doks.com/thumbv2/123dok_us/971912.1596665/6.612.61.551.507.623/figure-classification-accuracy-predictive-network-models-newman-leicht.webp)
