Abstract A newly developed full-scale shear block speci-men was used to simultaneously determine the shear strength and shear modulus of glued-laminated timber. The shear modulus was calculated using the shear strain distri-bution measured by means of digital image correlation. To obtain the exact relationship between shear modulus and shear strength, the shear strain in the intended shear plane was measured. A relatively high correlation coeffi cient of 0.75 was found between the shear modulus and nominal shear strength in two types of glued-laminated timber tested: sugi (Cryptomeria japonica) and Douglas-fi r
(Pseu-dotsuga menziesii). Good correlation was also found
between the density of middle lamina and shear strength. However, the relationships to density showed species dependence, which was not observed in the relationship between shear modulus and shear strength.
Key words Full-scale shear block specimen · Digital image correlation · Shear modulus · Shear strength · Glued-laminated timber
Introduction
In the production of glued-laminated timber, laminae with high stiffness are placed on the outside and laminae with lower stiffness are placed near the neutral plane. This arrangement is intended to give high stiffness, as well as high modulus of rupture, in bending. In short deep beams, however, the shear strength of the laminae near the neutral plane becomes critical and should also be taken into account.
S. Ukyo (*) · H. Ido · H. Nagao · H. Kato
Forestry and Forest Products Research Institute, 1 Matsunosato, Tsukuba 305-8687, Japan
Tel. +81-29-829-8310; Fax +81-29-874-3720 e-mail:[email protected]
Shear strength, however, shows a strong size effect, and the relationship between shear area and shear strength has been investigated.1–3
Ido et al.3
conducted a full-scale shear block test (shear area, 100 × 100 mm) to obtain the shear strength of Japanese construction-size timber. They con-fi rmed that the shear strength of full-scale specimens was 27% lower than that obtained with the small, clear shear block specimens (shear area, 30 × 30 mm) specifi ed in the Japanese Industrial Standards (JIS).
In practice, it is convenient to estimate the shear strength from the shear modulus, just as the modulus of rupture is estimated from the modulus of elasticity. In most cases, however, only the shear strength is measured, and the basic relationship between shear modulus and shear strength has not been suffi ciently investigated. Müller et al.4
and Sretenovic et al.5
measured shear strength and shear modulus using a modifi ed edgewise shear test similar to the American Society for Testing and Materials (ASTM) D 1037. They found a high correlation between shear strength, density, and shear modulus. Divos et al.6
used a vibration technique to measure the shear modulus in construction-size timber. They also conducted screw withdrawal resistance tests to investigate the relationship between shear strength and shear modulus and found a high correlation between screw withdrawal resistance and shear modulus. Our previous study7 proposed a new method for measuring shear modulus of a small, clear shear block specimen using a digital image correlation (DIC) technique. The shear modulus measured with shear block specimens was compared with that obtained from torsion tests, and good agreement was found. This new method is suitable for obtaining the relationship between shear strength and shear modulus, because it can measure the exact shear modulus of the intended shear plane.
The objective of the present study was to assess the applicability of the proposed method to full-scale speci-mens. The relationship between shear strength and shear modulus was evaluated in glued-laminated timber fabri-cated from sugi (Japanese cedar, Cryptomeria japonica) and Douglas-fi r (Pseudotsuga menziesii).
Materials and methods
Specimen preparation
Full-scale shear block specimens were cut from fi ve-ply glued-laminated timber. Figure 1 illustrates the dimensions and the orientation of the shear block specimen. One shear block sample was cut from one glued-laminated beam. The shear plane of each shear block specimen was adjusted to the center of the timber to test the shear strength of the middle lamina. The outer laminae were trimmed to reduce the width of the shear block specimen to 100 mm. Two dif-ferent types of glued-laminated timber were prepared: one was composed of laminae made from sugi and the other from Douglas-fi r. The laminae were graded based on their modulus of elasticity in bending. The grades of laminae were determined according to the Japanese Agricultural Standard specifi ed for glued-laminated timber. A total of 15 samples of each type were tested. Moisture content was measured after tests using an oven-dry method. The mean moisture content was 11% ± 0.4%.
Full-scale shear block testing3
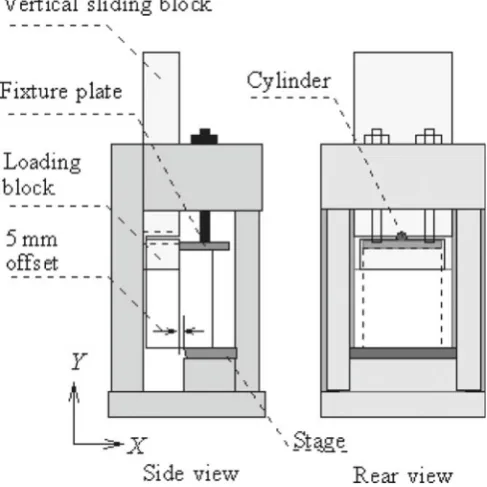
The testing apparatus was composed of four movable parts: a vertical sliding block, a loading block, an upper fi xture plate, and a lower adjustable stage (Fig. 2). The loading block was attached to the vertical sliding unit via a cylinder, which enabled rotation around the x-axis (see Fig. 2). The upper part of a specimen was secured with the fi xture plate to prevent rigid body rotation. The lower support was adjusted to create a 5-mm offset in the vertical plane between the edges of the loading block and the stage. Testing was conducted on a compression testing machine (MAEKAWA; capacity 3000 kN) in accordance with JIS Z2101.
Strain measurement using digital image correlation technique8
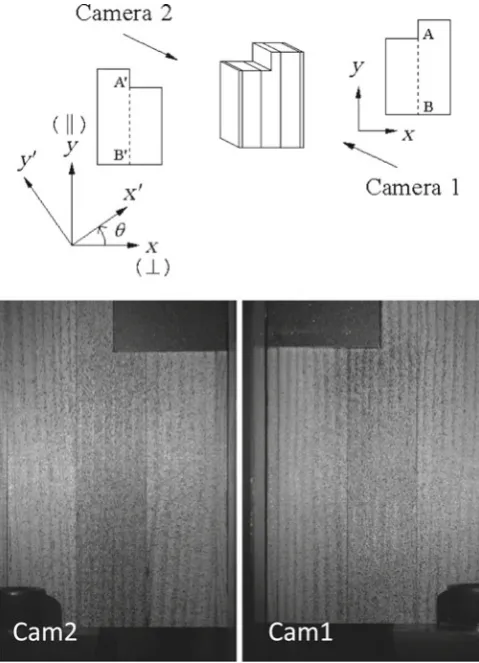
Images of both sides of a shear block specimen were taken simultaneously using two digital cameras connected to each Fig. 1. Layout and dimensions of the full-scale shear block. L, Grade of lamina. The fi gure that follows the “L” denotes the criterion value of modulus of elasticity (MOE) in 10−1 GPa
Fig. 2. Schematics of the loading apparatus
other through the operation of an electrical switch. Image size was 2000 × 3008 pixels, with the longer edge aligned with the grain direction of the specimens. Image resolution was 0.052 mm/pixel. The digital image correlation technique requires that the specimen surface patterns have suffi cient contrast and be randomly distributed. The surface of Japa-nese cedar or Douglas-fi r in their natural form cannot provide this. Thus, before testing, black ink was sprayed onto the surface of specimens to generate randomly distrib-uted patterns. Figure 3 shows an example of the acquired images. The loads at the acquisition of images were recorded to relate the measured strain to the nominal stress. Images were then analyzed using the DIC program8
to obtain the distribution of strain.
Results and discussion
Strain distribution
To confi rm that adequate shear force was introduced to the intended shear plane, the plane of maximum or minimum shear strain was investigated. The angle that defi nes the plane of maximum or minimum shear strain was computed as follows.
Transformation of shear strain from the x–y coordinate system to the new x′–y′ coordinate system is calculated by the following equation9
:
γx y′ ′= −
(
εx−εy)
sin2θ γ+ xycos2θ (1)To fi nd the plane of maximum/minimum shear strain, Eq. 1 is differentiated with respect to θ and the derivative set equal to zero:
d d γ θ ε ε θ γ θ ′ ′ = −
(
−)
− = x yx y xy
2 cos2 2 sin2 0 (2)
Hence,
tan 2θ ε ε
γ = −
(
x− y)
xy (3)
An example of the calculated angle θ, designating the plane of maximum/minimum shear strain at 51% of the maximum load, is shown in Fig. 4. As the shear strain on mutually perpendicular planes is numerically equal, the plane of maximum/minimum shear strain was selected to form the smallest angle with the y-axis. The mean value of the angle on each side of all specimens was 83° (see Fig. 3, Camera 1) and 99° (see Fig. 3, Camera 2), respectively. It can be concluded that adequate shear force is introduced in the intended plane.
The distribution of shear strain and perpendicular to the grain at maximum load is shown in Fig. 5 and Fig. 6, respectively. The shear strain was largest near the re-entrant corner and gradually decreased toward the lower end of the specimen. As for the maximum shear strain and Fig. 3. Defi nition of the coordinates and examples of acquired images. ||, Parallel to the grain direction; ⊥, perpendicular to the grain direc-tion. Cam2, Camera 2; Cam1, camera 1
120 120
Douglas-fir
sugi
B B’
Fig. 4. Distribution of angles defi ning the plane of maximum or minimum shear strain at 51% of maximum load. Distribution was measured along lines AB and A′B′ (see Fig. 3). Angles were calculated according to Eq. 3. The defi nition of angle is shown in Fig. 3
0
-0.03 -0.01 0.01 0.03 Shear strain
0 0
-0.03 -0.01 0.01 0.03 Shear strain 0 A 40 80 Di s tance [ m m ] Cam1 40 80 Di s tanc e [ m m] Cam1 A’ 120 Cam 1 Cam 2 120 Cam 1 Cam 2
Douglas-fir
sugi
B B’Fig. 5. Shear strain distribution along lines AB and A′B′ at the maximum load. (See Fig. 3 for position of lines AB and A′B′)
0
-0.015 -0.0075 0 0.0075 0.015 Perpendicular to grain strain
0
-0.015 -0.0075 0 0.0075 0.015 Perpendicular to grain strain
A A’ 40 80 Di st ance [ m m ] Cam1 40 80 Di s tance [ m m ] Cam1 A’ 120 1 Cam 2 120 Cam 1 Cam 2
Douglas-fir
sugi
B B’total shear strain, bias between sides of a specimen was observed.
As seen in Fig. 6, strain perpendicular to the grain was present in the entire shear plane. Hence, pure shear condi-tions were not achieved in this test. In general, the upper part of the shear plane was subjected to tension perpendicu-lar to the grain and the lower part was subjected to com-pression perpendicular to the grain. However, there was also localization of large tensile strain depending on the growth ring structure (earlywood or latewood). In the sugi example shown in Fig. 6, localization of perpendicular to the grain tensile strain was off the intended shear plane.
Determination of the shear modulus
The nominal shear stress is computed as
τNom=
P
A (4)
where τNom is the nominal shear stress, P is the load, and A
is the shear area. In the standard test of JIS and ASTM, shear strength is defi ned as the maximum nominal shear stress.
In the linear elastic range, the nominal shear stress and the average shear strain along the intended shear plane may satisfy the following relationship:
τNom=G⊥γAV (5)
Where, G⊥|| is the shear modulus and γAV is the average
shear strain. For calculating the average shear strain, strain over an area of 1.1 mm in the x direction and 117 mm in the
y direction was integrated, and averaged for both sides of a
specimen. The size of the area was determined to have a geometrically similar relationship to the area used in our previous study7
for small, clear shear block specimens speci-fi ed in JIS Z2101.
An example of the relationship between average shear strain and nominal shear stress is shown in Fig. 7. The shear
modulus was calculated as the gradient of a straight line that was fi tted to the linear elastic part of the relationship curve. The fi tted range was chosen between 10% and 50% of the maximum nominal shear stress.
Relationship between shear modulus and shear strength
Nominal shear strength and shear modulus are listed in Table 1. Although the grade of lamina was higher in Douglas-fi r, the shear modulus and shear strength were lower compared to sugi. When used as a beam member, the middle lamina is usually subjected to the maximum shear stress. The results here suggest that additional checking of the shear properties is desirable when determining the com-position of glued-laminated timber.
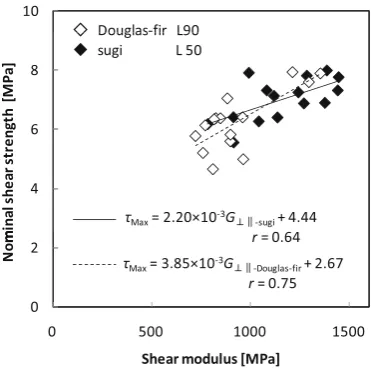
The relationship between nominal shear strength and the shear modulus is shown in Fig. 8. A good correlation was found for both types of glued-laminated timber. When the results of both species were mixed, a correlation coeffi -cient (r) of 0.75 was obtained. This result was in good agree-ment with the results by Divos et al.,6
who found a correlation coeffi cient of 0.80 between shear modulus and shear strength in construction-size timber. Furthermore, the linear regres-sion explanation for sugi (τ= 2.20 × 10⁻³
G⊥||−sugi+ 4.44; r =
0.64), was comparable to the previous measurement of the same species using JIS standard shear block specimens7
(τRL= 2.01 × 10
−3
GRL+ 4.08; r = 0.50).
Fig. 7. Relationship between nominal shear stress (τNom) and average
shear strain
Table 1. Summary of the test results
Sugi Douglas-fi r
Mean SD CV (%) Mean SD CV (%)
ρ [kg/m3] 396 39 10 453 60 13
G⊥||[MPa] 1162 209 18 934 196 21
τMax[MPa] 7.00 0.72 10 6.26 1.01 16
ρ, oven-dry density; G⊥||, shear modulus; τMax, shear strength; SD,
stan-dard deviation; CV, coeffi cient of variation
Fig. 8. Nominal shear strength plotted against shear modulus. τMax,
Nominal shear strength; G⊥||, shear modulus; r, coeffi cient of
As described in the previous section, a bias was observed for the total shear strain on each side of a specimen. When the shear modulus was calculated using only the strain value of the more deformed side, the correlation coeffi cient between shear strength and shear modulus increased to 0.80. In contrast, when only the strain value of the less deformed side was used, the correlation coeffi cient decreased to 0.40. This provisional calculation suggests that the nominal shear strength may be dominated by partial rather than entire shear deformation.
Relationship between shear strength and density of middle lamina
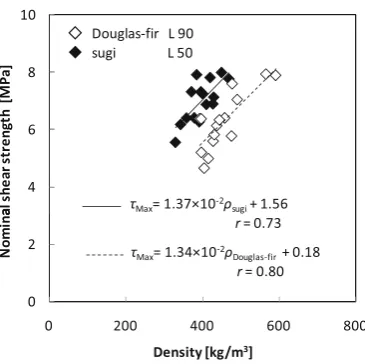
A good correlation was also found between density and shear strength. Figure 9 shows the relationship between the oven-dry density of middle lamina and the shear strength. To measure the density of middle laminae, samples were cut from the vicinity of full-scale specimens (see Fig. 1). Within a single species, the oven-dry density and the shear strength showed a good linear relationship. However, the relationship was species dependent; when the results of both species were mixed, the correlation coeffi cient decreased to 0.41.
Fig. 9. Nominal shear strength plotted against density. τMax, Nominal
shear strength; ρ, oven-dry density; r, coeffi cient of correlation
modulus and nominal shear strength. A good correlation was also found between the density of middle lamina and the shear strength. However, the relationship showed species dependence. The method presented here can be used to determine the basic relationship between shear modulus and shear strength in construction-size timber.
References
1. Okkonen EA, River BH (1989) Factors affecting the strength of block-shear specimens. For Prod J 39:43–50
2. Soltis LA, Rammer DR (1994) Shear strength of unchecked glued-laminated beams. For Prod J 44:51–57
3. Ido H, Nagao H, Kato H (2004) Evaluation of shear strength of sugi (Cryptomeria japonica) lumber using a full-scale block-shear test jig (in Japanese). Mokuzai Gakkaishi 50:220–227
4. Müller U, Sretenovic A, Gindl W, Teischinger A (2004) Longitudi-nal shear properties of European larch wood related to cell-wall structure. Wood Fiber Sci 36:143–151
5. Sretenovic A, Müller U, Gindl W, Teishinger A (2004) New shear assay for the simultaneous determination of shear strength and shear modulus in solid wood: fi nite element modeling and experi-mental results. Wood Fiber Sci 36:302–310
6. Divos F, Tanaka T, Nagao H, Kato H (1998) Determination of shear modulus on construction size timber. Wood Sci Technol 32:393– 402
7. Ukyo S, Karube M, Harada M, Hayashi T, Murata K (2008) Deter-mination of the shear modulus of wood with standard shear block specimen (in Japanese). J Soc Mater Sci 57:317–321
8. Murata K, Masuda M, Ukyo S (2005) Analysis of strain distribution of wood using digital image correlation method: four-point bend test of timber including knots (in Japanese). Trans Visualiz Soc Jpn 25:57–63