R E S E A R C H
Open Access
Impact of the occurrence of a response
shift on the determination of the minimal
important difference in a health-related
quality of life score over time
Ahmad Ousmen
1,2*, Thierry Conroy
3,4, Francis Guillemin
4,5, Michel Velten
4,6, Damien Jolly
4,7, Mariette Mercier
2,4,
Sylvain Causeret
8, Jean Cuisenier
8, Olivier Graesslin
9, Zeinab Hamidou
4,10, Franck Bonnetain
1,2,4and Amélie Anota
1,2,4Abstract
Background:An important challenge of the longitudinal analysis of health-related quality of life (HRQOL) is the potential occurrence of a Response Shift (RS) effect. While the impact of RS effect on the longitudinal analysis of HRQOL has already been studied, few studies have been conducted on its impact on the determination of the Minimal Important Difference (MID). This study aims to investigate the impact of the RS effect on the determination of the MID over time for each scale of both EORTC QLQ-C30 and QLQ-BR23 questionnaires in breast cancer patients.
Methods:Patients with breast cancer completed the EORTC QLQ-C30 and the EORTC QLQ-BR23 questionnaires at baseline (time of diagnosis; T0), three months (T1) and six months after surgery (T2). Four hospitals and care centers participated in this study: cancer centers of Dijon and Nancy, the university hospitals of Reims and Strasbourg At T1 and T2, patients were asked to evaluate their HRQOL change during the last 3 months using the Jaeschke transition question. They were also asked to assess retrospectively their HRQOL level of three months ago.
The occurrence of the RS effect was explored using the then-test method and its impact on the determination of the MID by using the Anchor-based method.
Results:Between February 2006 and February 2008, 381 patients were included of mean age 58 years old (SD = 11). For patients who reported a deterioration of their HRQOL level at each follow-up, an increase of RS effect has been detected between T1 and T2 in 13/15 dimensions of C30 questionnaire, and 4/7 dimensions of QLQ-BR23 questionnaire. In contrast, a decrease of the RS effect was observed in 8/15 dimensions of QLQ-C30
questionnaire and in 5/7 dimensions of QLQ-BR23 questionnaire in case of improvement. At T2, the MID became≥ 5 points when taking into account the RS effect in 10/15 dimensions of QLQ-C30 questionnaire and in 5/7
dimensions of QLQ-BR23 questionnaire.
Conclusions:This study highlights that the RS effect increases over time in case of deterioration and decreases in case of improvement. Moreover, taking the RS into account produces a reliable and significant MID.
Keywords:Health-related quality of life, Response shift, Minimal important difference, Then-test, Anchor-based method
* Correspondence:[email protected]
1Methodology and Quality of Life Unit in Oncology, University Hospital of
Besançon, Besançon, France
2INSERM UMR 1098, University of Franche-Comte, Besançon, France
Full list of author information is available at the end of the article
Background
In oncology clinical trials including health-related quality of life (HRQOL) as an endpoint, the main objective is to assess the impact of the treatment on patient’s HRQOL level over time. Consequently, a longitudinal assessment of HRQOL is desirable. The interpretation of the results of the longitudinal analysis of such data must be made in both statistical and clinical point of view in order to produce meaningful results for both patients and clini-cians [1, 2]. The minimal important difference (MID) was defined as the smallest change between two scores in a treatment outcome that a patient would identify as important [3–6].
For the European Organization of Research and Treat-ment of Cancer (EORTC) HRQOL questionnaires, the MID is generally fixed to 5 or 10 points for each score standardized on a 0–100 scale [2]. Nevertheless, this MID must be studied and determined for each HRQOL questionnaire and according to each cancer site. This was already made for the EORTC module of lung and brain cancer as example [7, 8]. To our knowledge, it has not yet been done for the EORTC QLQ-BR23 module for breast cancer patients. Furthermore, it is mandatory to not ignore the importance of this MID and to take it into account in the interpretation of HRQOL results. Indeed, the longitudinal analysis of HRQOL remains complex, particularly due to the potential occurrence of a response shift (RS) effect characterizing the process of adaptation of the patient in relation to the illness and its treatment [9, 10]. Thus, patients may not assess with the same criteria their HRQOL level over time.
The RS refers to a change in the meaning of HRQOL over time. Its definition proposed by Sprangers and Schwartz consists of three components:
– A recalibration: change in the respondent’s internal standards of measurement;
– A reprioritization: change in the importance of the component domains that constitute HRQOL;
– A reconceptualization: redefinition of the concept of HRQOL [9,10].
Several methodological or statistical methods have been proposed to characterize the occurrence of the RS effect, such as the then-test [9] or structural equation modeling [11]. The then-test consists to ask to patients post-treatment to provide their current levels (post-test) but also their pre-test levels in retrospect (then-test). Its impact on longitudinal HRQOL analysis has also been studied in breast cancer patients [12]. However, at this time, few researches have focused on the impact of RS effect on the determination of the MID [13]. Thus, the MID recommended for future studies could thus be under or over estimated by a potential RS effect.
The occurrence of the RS effect could affect the inter-pretation of change in HRQOL scores. In this case, we need to assess the occurrence of the RS to obtain a valid and reliable assessment of change over time. In particu-lar, when we have longitudinal data to determine the MID, it is therefore important to take into account this RS to assess the true change represented by the MID.
Many studies aimed to estimate the MID without taking into account the occurrence of the RS [3, 4]. To our knowledge, only one study explored the impact of the RS on the MID determination. This study demon-strated that the recalibration component of the RS effect does not have an important effect in patients with multiple myeloma who respond to treatment, i.e. for which a HRQOL improvement was observed. However, the author showed that RS does have an important effect in case of deterioration of patient’s HRQOL level [13]. Thus it seems to be essential to study the impact of the RS effect in studies aiming to determine the MID, and to study if this RS impact differentially patients who im-proved to those who deteriorate over time. Only two measurement times (at inclusion and after three months) were considered in the study of Kvam et al. which allow detecting the importance of RS effect on deteriorating or improving of HRQOL and its direction after three months [13]. However, since the RS effect is a longitudinal process, it could be relevant to include more time points in order to study the longitudinal change of the RS effect over time.
In this context, the objective of this work was to study the impact of the recalibration component of the RS effect on the determination of the MID in breast cancer patients between three measurement times using the EORTC QLQ-C30 cancer specific questionnaire and its breast cancer module QLQ-BR23.
Methods Patients
Data from a prospective, multicenter, cohort study were used including all women hospitalized for the diagnosis or treatment of primary breast cancer or for a suspicion of breast cancer. Patients who have other primary cancer sites were excluded. Patients already hospitalized or treated for breast cancer were not included. Written informed consent was obtained from all participants. The protocol was approved by the ethics committees (“Comité de Protection des Personnes”). The complete design of this study was extensively described elsewhere [14].
Study design
HRQOL questionnaires
cancer module. Three measurement times were used: at baseline (initial examination or initial hospitalization, T0), three months (T1) and six months later (T2).
The QLQ-C30 consists of 30 items measuring five functional scales (physical, role, emotional, cognitive and social functioning), a global health status (GHS), finan-cial difficulties and eight scales of symptoms (fatigue, nausea and vomiting, pain, dyspnea, insomnia, appetite loss, constipation, diarrhea) [15]. One score is generated per dimension and standardized on a 0 to 100 scale in order that a high score reflects a high GHS, functional and symptomatic level [16].
The QLQ-BR23 module is specific to breast cancer. It includes 23 items allowing to assess four functional scales (body image, sexual functioning, sexual enjoy-ment, future perspectives) and four symptom scales (sys-temic therapy side effects, breast symptoms, arm symptoms, upset by hair loss) [17]. As for the QLQ-C30, one score is generated per dimension on a 0–100 scale in order that a high score represents a high level of func-tioning and a high symptomatic level.
Questionnaires have been distributed by a clinical re-search assistant to the patients during the hospitalization or after a consultation or sending by the post.
Then-test assessment
In this study, the then-test method was used to detect changes in internal standards, namely the“recalibration” component of the RS [18].
At each follow-up time point, one prospective and one retrospective measurement were performed. For the retrospective measurement (then-test) at T1, patients were asked to re-evaluate their baseline HRQOL level (three months before). At T2 (six months), patients were asked to re-evaluate their HRQOL level at three months (retrospective assessment of HRQOL level at T1 (three months)).
Assessment of change in HRQOL level
The anchor-based method was used to determine the MID according to the Jaeschke transition question [3]. At three (T1) and six months (T2), patients were asked to evaluate their HRQOL change in the last three months. The question was asked by the following way:
“During the past three months, do you consider your HRQOL:
– Did not change globally
– Deteriorated: very much, much, a little
– Improved: a little, much, very much”
Since the Jaeschke transition question was asked to the patients at T1 and then at T2, patients can deterior-ate between T0 and T1 and then can improve between
T1 and T2. Thus, patients in the group“little worse”at T1 can then be in the group“little better”at T2.
To facilitate the interpretation of the results and to yield sufficient numbers of patients in each category, we brought the two categories“very much”and“much”in a single category to get finally five response categories for the anchor (much better, little better, unchanged, little worse, and much worse).
Statistical methods
Statistical considerations and missing data
All dimensions of both QLQ-C30 and QLQ-BR23 ques-tionnaires were analysed except the hair loss dimension of the QLQ-BR23 due to missing data (few patients con-cerned at the stage of the beginning of the treatment).
Only patients with available data at each time meas-urement were included in the analyses.
All tests were performed at the statistical level of 0.05 with no adjustment on multiple tests. All tests were performed at the statistical level of 0.05 with no adjust-ment on multiple tests. Allp-values were given for infor-mation only since sample sizes for each test do not allow to produce some results with a high statistical power. The analyses and tests were made as an exploratory pur-pose only, we are more interested about clinical meaning of the difference instead of statistical significance.
Scores were calculated according to the recommenda-tions of the EORTC scoring manual [15]: if at least half of the items per dimension were answered, the score was estimated on available items, i.e. considering that missing items were equal to the mean of answered items (simple imputation by the personal mean).
Missing data profile was already explored in a previous study [19]. They were considered as missing at random.
Descriptive analysis
Baseline sociodemographics and clinical characteristics of the patients as well as baseline HRQOL scores were described using mean and standard deviation (SD) for continuous variables and frequencies with percentages for qualitative variables.
Detection of the recalibration effect of the RS
As the MID is defined as the smallest change between two scores, we were particularly interested in the two categories “little worse” and “little better” to interpret the results.
We looked at the direction of the RS effect: a positive (respectively, negative) value of RS indicates that pa-tients had overestimated (respectively, underestimated) their HRQOL level, their functional or symptomatic level at the previous measurement time.
Then, we were interested in the evolution of the mag-nitude of the RS effect over time, it means, if the RS effect had increased or decreased over time in absolute value.
Finally, the direction of the response shift effect over time was also analyzed, i.e. if the RS remained positive or negative at both follow-up time points.
The impact of sample size was indicated by calculation of the 95% confidence intervals (95%CI).
The p-values calculated by the non-parametric Wil-coxon paired test were also presented to indicate the statistical significance of the RS.
The effect size (ES) was calculated to detect the mag-nitude of the recalibration component of the RS effect for each category of the anchor. The ES represents the mean change between the pre-test and the then-test divided by the standard deviation (SD) of the pre-test score. We used Cohen’s generally accepted criteria for interpreting the magnitude of the ES in absolute value: an ES of at least 0.20 was considered as a small change, between 0.2 and 0.50 as a moderate change, and greater than 0.80 as an important change [20].
Observed and adjusted MID
MID were determined by calculating the observed changes (i.e. without taking into account the RS ef-fect) and the adjusted changes (i.e. taking into ac-count the RS effect) given by post-test minus pre-test and post-test minus then-test respectively. Observed changes for each score were estimated on patients with the corresponding score available at both the post-test and pre-test measurement times. Adjusted changes for each score were performed on patients with the corresponding score available for both the post-test and then-test. In the both cases, the mean differences were calculated for each HRQOL scores according to each response category of the anchor’s question.
The impact of sample size was indicated by calculation of the 95%CI of the mean difference.
The global range for the observed and adjusted MID for all dimensions was then reported by questionnaire and measurement times.
Results of the observed and adjusted MID were fi-nally compared to the threshold of 5 points MID
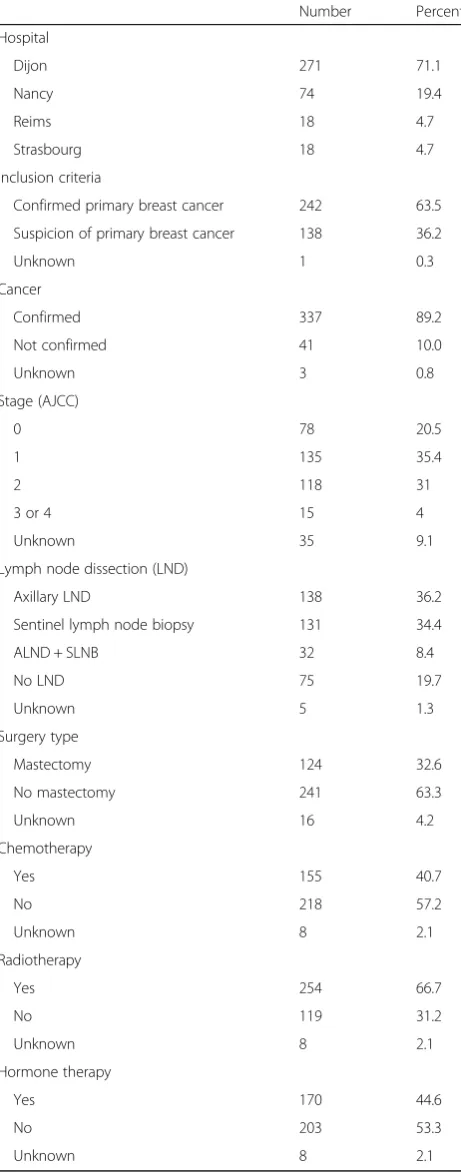
Table 1Patients characteristics
Number Percent
Hospital
Dijon 271 71.1
Nancy 74 19.4
Reims 18 4.7
Strasbourg 18 4.7
Inclusion criteria
Confirmed primary breast cancer 242 63.5
Suspicion of primary breast cancer 138 36.2
Unknown 1 0.3
Cancer
Confirmed 337 89.2
Not confirmed 41 10.0
Unknown 3 0.8
Stage (AJCC)
0 78 20.5
1 135 35.4
2 118 31
3 or 4 15 4
Unknown 35 9.1
Lymph node dissection (LND)
Axillary LND 138 36.2
Sentinel lymph node biopsy 131 34.4
ALND + SLNB 32 8.4
No LND 75 19.7
Unknown 5 1.3
Surgery type
Mastectomy 124 32.6
No mastectomy 241 63.3
Unknown 16 4.2
Chemotherapy
Yes 155 40.7
No 218 57.2
Unknown 8 2.1
Radiotherapy
Yes 254 66.7
No 119 31.2
Unknown 8 2.1
Hormone therapy
Yes 170 44.6
No 203 53.3
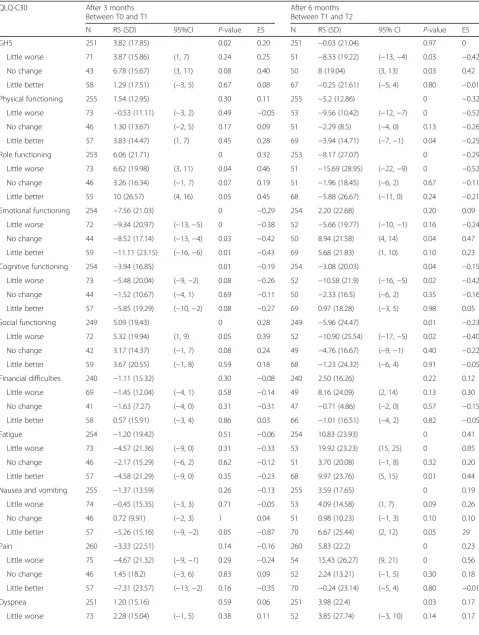
Table 2The Response shift effect for the QLQ-C30 questionnaire after three and six months for all patients and three main categories of the anchor
QLQ-C30 After 3 months After 6 months
Between T0 and T1 Between T1 and T2
N RS (SD) 95%CI P-value ES N RS (SD) 95% CI P-value ES
GHS 251 3.82 (17.85) 0.02 0.20 251 −0.03 (21.04) 0.97 0
Little worse 71 3.87 (15.86) (1, 7) 0.24 0.25 51 −8.33 (19.22) (−13,−4) 0.03 −0.42
No change 43 6.78 (15.67) (3, 11) 0.08 0.40 50 8 (19.04) (3, 13) 0.03 0.42
Little better 58 1.29 (17.51) (−3, 5) 0.67 0.08 67 −0.25 (21.61) (−5, 4) 0.80 −0.01
Physical functioning 255 1.54 (12.95) 0.30 0.11 255 −5.2 (12.86) 0 −0.32
Little worse 73 −0.53 (11.11) (−3, 2) 0.49 −0.05 53 −9.56 (10.42) (−12,−7) 0 −0.52
No change 46 1.30 (13.67) (−2, 5) 0.17 0.09 51 −2.29 (8.5) (−4, 0) 0.13 −0.26
Little better 57 3.83 (14.47) (1, 7) 0.45 0.28 69 −3.94 (14.71) (−7,−1) 0.04 −0.25
Role functioning 253 6.06 (21.71) 0 0.32 253 −8.17 (27.07) 0 −0.29
Little worse 73 6.62 (19.98) (3, 11) 0.04 0.46 51 −15.69 (28.95) (−22,−9) 0 −0.52
No change 46 3.26 (16.34) (−1, 7) 0.07 0.19 51 −1.96 (18.45) (−6, 2) 0.67 −0.11
Little better 55 10 (26.57) (4, 16) 0.05 0.45 68 −5.88 (26.67) (−11, 0) 0.24 −0.21
Emotional functioning 254 −7.56 (21.03) 0 −0.29 254 2.20 (22.68) 0.20 0.09
Little worse 72 −9.34 (20.97) (−13,−5) 0 −0.38 52 −5.66 (19.77) (−10,−1) 0.16 −0.24
No change 44 −8.52 (17.14) (−13,−4) 0.03 −0.42 50 8.94 (21.58) (4, 14) 0.04 0.47
Little better 59 −11.11 (23.15) (−16,−6) 0.01 −0.43 69 5.68 (21.83) (1, 10) 0.10 0.23
Cognitive functioning 254 −3.94 (16.85) 0.01 −0.19 254 −3.08 (20.03) 0.04 −0.15
Little worse 73 −5.48 (20.04) (−9,−2) 0.08 −0.26 52 −10.58 (21.9) (−16,−5) 0.02 −0.42
No change 44 −1.52 (10.67) (−4, 1) 0.69 −0.11 50 −2.33 (16.5) (−6, 2) 0.35 −0.16
Little better 57 −5.85 (19.29) (−10,−2) 0.08 −0.27 69 0.97 (18.28) (−3, 5) 0.98 0.05
Social functioning 249 5.09 (19.43) 0 0.28 249 −5.96 (24.47) 0.01 −0.23
Little worse 72 5.32 (19.94) (1, 9) 0.05 0.39 52 −10.90 (25.54) (−17,−5) 0.02 −0.40
No change 42 3.17 (14.37) (−1, 7) 0.08 0.24 49 −4.76 (16.67) (−9,−1) 0.40 −0.22
Little better 59 3.67 (20.55) (−1, 8) 0.59 0.18 68 −1.23 (24.32) (−6, 4) 0.91 −0.05
Financial difficulties 240 −1.11 (15.32) 0.30 −0.08 240 2.50 (16.26) 0.22 0.12
Little worse 69 −1.45 (12.04) (−4, 1) 0.58 −0.14 49 8.16 (24.09) (2, 14) 0.13 0.30
No change 41 −1.63 (7.27) (−4, 0) 0.31 −0.31 47 −0.71 (4.86) (−2, 0) 0.57 −0.15
Little better 58 0.57 (15.91) (−3, 4) 0.86 0.03 66 −1.01 (16.51) (−4, 2) 0.82 −0.05
Fatigue 254 −1.20 (19.42) 0.51 −0.06 254 10.83 (23.93) 0 0.41
Little worse 73 −4.57 (21.36) (−9, 0) 0.31 −0.33 53 19.92 (23.23) (15, 25) 0 0.85
No change 46 −2.17 (15.29) (−6, 2) 0.62 −0.12 51 3.70 (20.08) (−1, 8) 0.32 0.20
Little better 57 −4.58 (21.29) (−9, 0) 0.35 −0.23 68 9.97 (23.76) (5, 15) 0.01 0.44
Nausea and vomiting 255 −1.37 (13.59) 0.26 −0.13 255 3.59 (17.65) 0 0.19
Little worse 74 −0.45 (15.35) (−3, 3) 0.71 −0.05 53 4.09 (14.58) (1, 7) 0.09 0.26
No change 46 0.72 (9.91) (−2, 3) 1 0.04 51 0.98 (10.23) (−1, 3) 0.10 0.10
Little better 57 −5.26 (15.16) (−9,−2) 0.05 −0.87 70 6.67 (25.44) (2, 12) 0.05 29
Pain 260 −3.33 (22.51) 0.14 −0.16 260 5.83 (22.2) 0 0.23
Little worse 75 −4.67 (21.32) (−9,−1) 0.29 −0.24 54 15.43 (26.27) (9, 21) 0 0.56
No change 46 1.45 (18.2) (−3, 6) 0.83 0.09 52 2.24 (13.21) (−1, 5) 0.30 0.18
Little better 57 −7.31 (23.57) (−13,−2) 0.16 −0.35 70 −0.24 (23.14) (−5, 4) 0.80 −0.01
Dyspnea 251 1.20 (15.16) 0.59 0.06 251 3.98 (22.4) 0.03 0.17
which is widely used for the EORTC HRQOL ques-tionnaires [2].
All analyses were performed using R statistical software (version 3.2.1) [21].
Results Patients
Between February 2006 and February 2008, 381 patients with confirmed or suspicion breast cancer were included in the four participating centers (Fig. 1). A difference be-tween centers was observed in terms of questionnaires completions rate due to logistics problems. Mean age was 58.4 (SD = 11) years. Three hundred and forty (89.2%) patients had a confirmed breast cancer. the clin-ical and socio- demographic characteristics of all pa-tients were described in Table 1.
Detection of the recalibration component of the Response shift effect
Tables 2 and 3 present the results of RS effect at T1 and T2 for the QLQ-C30 and QLQ-BR23 questionnaires respectively (see Additional file 1: Tables S1 and S2 for complementary results).
For 18 over 22 dimensions analysed of both question-naires, an increase of the magnitude of the RS effect was observed in case of little deterioration over time, i.e. between T0 and T1 and then between T1 and T2 (i.e. category “little worse” for the anchor at each follow-up time point).
To illustrate:
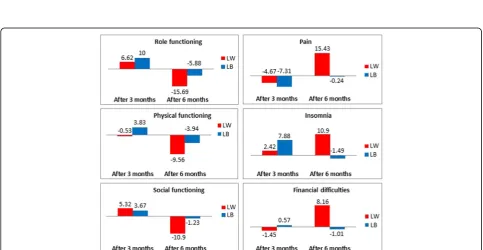
– For the insomnia dimension of the QLQ-C30 questionnaire, the RS effect was equal to 2.42 in mean at three months reflecting that patients had overestimated their baseline insomnia level, consid-ering the retrospective measure at three months as the reference. The RS effect became more important after six months by increasing to 10.9 in mean reflecting an overestimation of the insomnia level at T1. Thus, the magnitude of the RS effect increased at six months as compared to three months, with a positive direction of the RS at both time points.
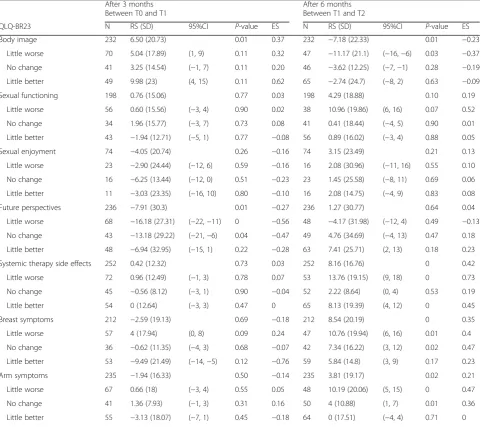
– Regarding the body image dimension of the QLQ-BR23 module, the magnitude of the mean RS effect also increase between each follow-up time point from 5.04 to 11.17 in absolute value but with an opposite direction of RS was shown at T1 equal to 5.04 in mean compared with its value after six months by increasing to−11.17 with underestima-tion of body image pre-test score at T1.
ES indicate a moderate RS effect in case of deterior-ation after six months for physical, role, cognitive social and sexual functioning as well as for pain, appetite loss, and systemic therapy side effects dimensions (ES > 0.5) and an important RS effect for fatigue (ES > 0.8). Fur-thermore, a statistically significance of RS effect has been indicated (for information only since sample sizes
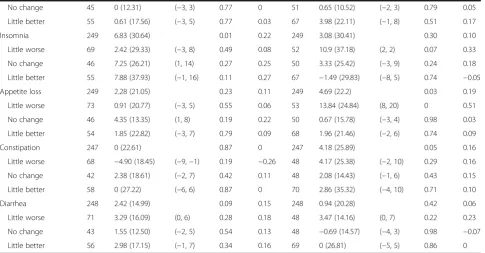
Table 2The Response shift effect for the QLQ-C30 questionnaire after three and six months for all patients and three main categories of the anchor(Continued)
No change 45 0 (12.31) (−3, 3) 0.77 0 51 0.65 (10.52) (−2, 3) 0.79 0.05
Little better 55 0.61 (17.56) (−3, 5) 0.77 0.03 67 3.98 (22.11) (−1, 8) 0.51 0.17
Insomnia 249 6.83 (30.64) 0.01 0.22 249 3.08 (30.41) 0.30 0.10
Little worse 69 2.42 (29.33) (−3, 8) 0.49 0.08 52 10.9 (37.18) (2, 2) 0.07 0.33
No change 46 7.25 (26.21) (1, 14) 0.27 0.25 50 3.33 (25.42) (−3, 9) 0.24 0.18
Little better 55 7.88 (37.93) (−1, 16) 0.11 0.27 67 −1.49 (29.83) (−8, 5) 0.74 −0.05
Appetite loss 249 2.28 (21.05) 0.23 0.11 249 4.69 (22.2) 0.03 0.19
Little worse 73 0.91 (20.77) (−3, 5) 0.55 0.06 53 13.84 (24.84) (8, 20) 0 0.51
No change 46 4.35 (13.35) (1, 8) 0.19 0.22 50 0.67 (15.78) (−3, 4) 0.98 0.03
Little better 54 1.85 (22.82) (−3, 7) 0.79 0.09 68 1.96 (21.46) (−2, 6) 0.74 0.09
Constipation 247 0 (22.61) 0.87 0 247 4.18 (25.89) 0.05 0.16
Little worse 68 −4.90 (18.45) (−9,−1) 0.19 −0.26 48 4.17 (25.38) (−2, 10) 0.29 0.16
No change 42 2.38 (18.61) (−2, 7) 0.42 0.11 48 2.08 (14.43) (−1, 6) 0.43 0.15
Little better 58 0 (27.22) (−6, 6) 0.87 0 70 2.86 (35.32) (−4, 10) 0.71 0.10
Diarrhea 248 2.42 (14.99) 0.09 0.15 248 0.94 (20.28) 0.42 0.06
Little worse 71 3.29 (16.09) (0, 6) 0.28 0.18 48 3.47 (14.16) (0, 7) 0.22 0.23
No change 43 1.55 (12.50) (−2, 5) 0.54 0.13 48 −0.69 (14.57) (−4, 3) 0.98 −0.07
Little better 56 2.98 (17.15) (−1, 7) 0.34 0.16 69 0 (26.81) (−5, 5) 0.86 0
for each test do not allow to produce some results with a high statistical power) for 12 dimensions of both QLQ-C30 and QLQ-BR23 questionnaires in case of deterioration after six months (P-value < 0.05).
A decrease of the magnitude of the RS effect was observed for 13/22 dimensions analyzed in case of im-provement betweenT1 and T2 (i.e. category“little better” for the anchor at T1 and at T2). For example:
– A decrease of RS effect with underestimation of pain level at T0 and T1 from−7.31 after three months to
−0.24 after six months for;
– A decrease of RS effect from 9.98 with
overestimation of baseline body image level to−2.74
with underestimation of body image pre-test score at T1.
For all dimensions for which a decrease of RS effect was observed between T1 and T2 in case of improve-ment of HRQOL level, the ES indicated an insignificant RS (ES≤0.2) or a small change (0.2 < ES≤0.5). In addition, results were not statistically significant (p -values of the Wilcoxon test≥0.05).
In case of deterioration, the same direction of RS
between T1 and T2 was observed for 11/22
dimensions of both QLQ-C30 and QLQ-BR23
questionnaires. In case of improvement, the direction of the RS effect remained the same for only 3/22 Table 3The Response shift effect for the QLQ-BR23 questionnaire after three and six months for all patients and three main categories of the anchor
After 3 months After 6 months
Between T0 and T1 Between T1 and T2
QLQ-BR23 N RS (SD) 95%CI P-value ES N RS (SD) 95%CI P-value ES
Body image 232 6.50 (20.73) 0.01 0.37 232 −7.18 (22.33) 0.01 −0.23
Little worse 70 5.04 (17.89) (1, 9) 0.11 0.32 47 −11.17 (21.1) (−16,−6) 0.03 −0.37
No change 41 3.25 (14.54) (−1, 7) 0.11 0.20 46 −3.62 (12.25) (−7,−1) 0.28 −0.19
Little better 49 9.98 (23) (4, 15) 0.11 0.62 65 −2.74 (24.7) (−8, 2) 0.63 −0.09
Sexual functioning 198 0.76 (15.06) 0.77 0.03 198 4.29 (18.88) 0.10 0.19
Little worse 56 0.60 (15.56) (−3, 4) 0.90 0.02 38 10.96 (19.86) (6, 16) 0.07 0.52
No change 34 1.96 (15.77) (−3, 7) 0.73 0.08 41 0.41 (18.44) (−4, 5) 0.90 0.01
Little better 43 −1.94 (12.71) (−5, 1) 0.77 −0.08 56 0.89 (16.02) (−3, 4) 0.88 0.05
Sexual enjoyment 74 −4.05 (20.74) 0.26 −0.16 74 3.15 (23.49) 0.21 0.13
Little worse 23 −2.90 (24.44) (−12, 6) 0.59 −0.16 16 2.08 (30.96) (−11, 16) 0.55 0.10
No change 16 −6.25 (13.44) (−12, 0) 0.51 −0.23 23 1.45 (25.58) (−8, 11) 0.69 0.06
Little better 11 −3.03 (23.35) (−16, 10) 0.80 −0.10 16 2.08 (14.75) (−4, 9) 0.83 0.08
Future perspectives 236 −7.91 (30.3) 0.01 −0.27 236 1.27 (30.77) 0.64 0.04
Little worse 68 −16.18 (27.31) (−22,−11) 0 −0.56 48 −4.17 (31.98) (−12, 4) 0.49 −0.13
No change 43 −13.18 (29.22) (−21,−6) 0.04 −0.47 49 4.76 (34.69) (−4, 13) 0.47 0.18
Little better 48 −6.94 (32.95) (−15, 1) 0.22 −0.28 63 7.41 (25.71) (2, 13) 0.18 0.23
Systemic therapy side effects 252 0.42 (12.32) 0.73 0.03 252 8.16 (16.76) 0 0.42
Little worse 72 0.96 (12.49) (−1, 3) 0.78 0.07 53 13.76 (19.15) (9, 18) 0 0.73
No change 45 −0.56 (8.12) (−3, 1) 0.90 −0.04 52 2.22 (8.64) (0, 4) 0.53 0.19
Little better 54 0 (12.64) (−3, 3) 0.47 0 65 8.13 (19.39) (4, 12) 0 0.45
Breast symptoms 212 −2.59 (19.13) 0.69 −0.18 212 8.54 (20.19) 0 0.35
Little worse 57 4 (17.94) (0, 8) 0.09 0.24 47 10.76 (19.94) (6, 16) 0.01 0.4
No change 36 −0.62 (11.35) (−4, 3) 0.68 −0.07 42 7.34 (16.22) (3, 12) 0.02 0.47
Little better 53 −9.49 (21.49) (−14,−5) 0.12 −0.76 59 5.84 (14.8) (3, 9) 0.17 0.23
Arm symptoms 235 −1.94 (16.33) 0.50 −0.14 235 3.81 (19.17) 0.02 0.21
Little worse 67 0.66 (18) (−3, 4) 0.55 0.05 48 10.19 (20.06) (5, 15) 0 0.47
No change 41 1.36 (7.93) (−1, 3) 0.31 0.16 50 4 (10.88) (1, 7) 0.01 0.36
Little better 55 −3.13 (18.07) (−7, 1) 0.45 −0.18 64 0 (17.51) (−4, 4) 0.71 0
Table 4Observed and adjusted changes of the QLQ–C30 questionnaire after three and six months
QLQ-C30 After 3 months After 6 months
Between T0 and T1 Between T1 and T2
Observed changes Adjusted changes Observed changes Adjusted changes (post-test - pre-test) (post-test - then-test) (post-test - pre-test) (post-test - then-test)
N Mean (SD) 95% CI Mean (SD) 95% CI N Mean (SD) 95% CI Mean (SD) 95% CI
GHS 251 251
Little worse 71 −16.31 (16.99) (−20,−13) −12.44 (16.78) (−16,−9) 51 0.49 (15.4) (−3, 4) −7.84 (15.22) (−11,−4)
No change 43 −2.13 (16.17) (−6, 2) 4.65 (17.85) (0, 9) 50 −1 (16.12) (−5, 3) 7 (14.71) (4, 10)
Little better 58 0.29 (18.4) (−4, 4) 1.58 (14.93) (−2, 5) 67 7.21 (17.22) (4, 11) 6.97 (16.70) (4, 10)
Physical functioning 255 255
Little worse 73 −11.76 (10.99) (−14,−10) −12.28 (12.71) (−15,−10) 53 0.38 (11.43) (−2, 3) −9.18 (12.83) (−12,−6)
No change 46 −3.99 (10.17) (−7,−1) -2.68 (12.76) (−6, 0) 51 0.72 (6.97) (−1, 2) −1.57 (6.34) (−3, 0)
Little better 57 −4.53 (12.89) (−7,−2) -0.70 (11.86) (−3, 2) 69 0.85 (13.02) (−2, 3) −3.09 (14.03) (−6, 0)
Role functioning 253 253
Little worse 73 −25.57 (21.71) (−30,−21) -18.95 (23.78) (−24,−14) 51 −1.96 (29.18) (−9, 5) −17.65 (29.14) (−24,−11)
No change 46 −2.90 (19.66) (−8, 2) 0.36 (21.80) (−5, 6) 51 3.92 (15.49) (0, 8) 1.96 (19.05) (−3, 6)
Little better 55 −9.09 (20.74) (−14,−4) 0.91 (24.72) (−5, 6) 68 5.88 (21.89) (1, 1) 0 (23.92) (−5,5)
Emotional functioning 254 254
Little worse 72 3.05 (24.09) (−2, 8) -6.29 (22.02) (−11,−2) 52 −0.53 (20.19) (−5, 4) −6.20 (16.43) (−10,−2)
No change 44 19.44 (18.31) (15, 24) 10.92 (18.26) (6, 16) 50 −0.78 (15.55) (−4, 3) 8.17 (21.26) (3, 13)
Little better 59 15.07 (26.33) (9, 21) 3.95 (19.51) (0, 8) 69 1.53 (20.05) (−2, 6) 7.21 (19.13) (3, 11)
Cognitive functioning 254 254
Little worse 73 −5.48 (19.46) (−9,−2) -10.96 (18.26) (−15,−7) 52 0.96 (17.9) (−3, 5) −9.62 (19.06) (−14,−5)
No change 44 0.76 (13.43) (−3, 4) -0.76 (12.43) (−4, 2) 50 2.67 (12.31) (0, 6) 0.33 (15.97) (−3, 4)
Little better 57 5.26 (21.4) (1, 1) -0.58 (17.24) (−4, 3) 69 3.62 (13.37) (1, 6) 4.59 (17.82) (1, 8)
Social functioning 249 249
Little worse 72 −20.37 (21.34) (−25,−16) -15.05 (14.84) (−18,−12) 52 0.64 (24.47) (−5, 6) −10.26 (20.39) (−15,−6)
No change 42 −3.97 (21.08) (−9, 2) -0.79 (17.25) (−5, 4) 49 4.42 (19.18) (0, 9) −0.34 (12.50) (−3, 3)
Little better 59 −6.78 (19.6) (−11,−3) -3.11 (18.95) (−7, 1) 68 3.43 (20.68) (−1, 8) 2.21 (21.34) (−2, 7)
Fatigue 254 254
Little worse 73 27.32 (21.87) (23, 32) 22.75 (22.38) (18, 27) 53 0.21 (16.34) (−4, 4) 20.13 (24.17) (15, 26)
No change 46 7.73 (18.42) (3, 12) 5.56 (19.42) (1, 10) 51 −1.53 (19.5) (−6, 3) 2.18 (19.75) (−2, 7)
Little better 57 7.89 (19.47) (4, 12) 3.31 (17.97) (−1, 7) 68 −7.68 (18.24) (−11,−4) 2.29 (22.92) (−2, 7)
Nausea and vomiting 255 255
Little worse 74 8.78 (19.35) (5, 13) 8.33 (15.67) (5, 11) 53 −3.14 (21.7) (−8, 2) 0.94 (17.73) (−3, 5)
No change 46 −0.72 (12.65) (−4, 2) 0 (8.61) (−2, 2) 51 −2.29 (10.01) (−5, 0) −1.31 (12.40) (−4, 2)
Little better 57 9.06 (21.38) (4, 14) 3.80 (17.82) (0, 8) 70 −6.67 (23.98) (−11,−2) 0 (13.31) (−3, 3)
Pain 260 260
Little worse 75 13.78 (24.87) (9, 19) 9.11 (23.14) (5, 14) 54 1.85 (22.35) (−3, 7) 17.28 (25.89) (11, 23)
No change 46 3.99 (14.57) (0, 8) 5.43 (17.23) (1, 10) 52 3.21 (14.02) (0, 6) 5.45 (17.06) (1, 9)
Little better 57 9.94 (20.62) (5, 15) 2.63 (21.08) (−2, 7) 70 2.14 (20.05) (−2, 6) 1.90 (22.97) (−3, 6)
Dyspnea 251 251
Little worse 73 8.68 (24.86) (4, 14) 10.96 (23.61) (6, 16) 52 3.85 (26.94) (−2, 10) 7.69 (18.22) (3, 12)
No change 45 0.74 (19.45) (−4, 6) 0.74 (18.10) (−4, 5) 51 −0.65 (12.45) (−4, 2) 0 (11.55) (−3, 3)
Little better 55 1.21 (19.21) (−3, 6) 1.82 (16.25) (−2, 5) 67 3.48 (22.57) (−1, 8) 7.46 (23.08) (3, 12)
dimensions (namely, pain, dyspnea and appetite loss dimensions).
Observed and adjusted MID
Tables 4 and 5 represent the results of the observed and adjusted MID at 3 and 6 months for the QLQ-C30 and QLQ-BR23 respectively (see Additional file 1: Tables S3 and S4 for complementary results).
Based on the scales that have at the same time an increase of the RS effect in case of deterioration and a decrease of the RS effect in case of improvement (GHS, role, cognitive, social and sexual functioning, pain, insomnia, diarrhea, body image, breast and arm symp-toms), the minimal and maximal MID for observed and adjusted MID were calculated in case of deterioration and improvement of HRQOL after three and six months (Table 6). The diarrhea scale was excluded from the analysis because it will disrupt the results; due to a num-ber of scores containing zero values. The financial diffi-culties and appetite loss dimensions were also added since a remarkable increase was observed when deterior-ating and a relatively low increase was highlighted when improving.
A comparison of the observed and adjusted changes in case of a small deterioration (category“little worse”) to a threshold of 5 points for both the C30 and QLQ-BR23 questionnaires after three and six months was presented in Table 7.
The variations of the RS effect between 3 and 6 months were represented on Figs. 2 and 3 for several HRQOL dimensions. For example, the Fig. 2 illustrates an increase of the RS effect in mean in case of a small deterioration and a decrease in case of a small improve-ment for the most dimensions of the QLQ-C30. Some consistent results for the most dimensions of the QLQ-BR23 questionnaire were also detected and illustrated in Fig. 3.
Discussion
The objective of this study was to explore the impact of the occurrence of the response shift effect on the determination of the MID over time in breast cancer patients using both the QLQ-C30 and QLQ-BR23 questionnaires.
Both an increase of the RS effect in case of deterior-ation and a decrease of the RS effect in case of improve-ment was observed for 7/15 dimensions of the QLQ-C30 questionnaire (global health status (GHS), role, cog-nitive and social functioning, pain, insomnia, diarrhea) and 4/7 dimensions for the QLQ-BR23 questionnaire (body image, sexual function, breast and arm symp-toms). This indicates the differential occurrence of the RS effect according to the change in patient’s HRQOL level over time (i.e. deterioration or improvement of HRQOL).
For 13/15 dimensions of the QLQ-C30 questionnaire (except the emotional functioning and the constipation
Table 4Observed and adjusted changes of the QLQ–C30 questionnaire after three and six months(Continued)
Little worse 69 5.80 (35.22) (−1, 13) 8.21 (28.24) (3, 14) 52 4.49 (30.98) (−3, 12) 15.38 (24.22) (10, 21)
No change 46 −10.14 (35.04) (−19,−1) −2.90 (25.17) (−9, 3) 50 −1.33 (21.25) (−6, 4) 2 (28.89) (−5, 9)
Little better 55 −7.27 (34.95) (−15, 1) 0.61 (25.25) (−5, 6) 67 1 (30.13) (−5, 7) −0.50 (22.09) (−5, 4)
Appetite loss 249 249
Little worse 73 10.05 (28.16) (5, 16) 10.96 (27.25) (6, 16) 53 −10.06 (25.8) (−16,−4) 3.77 (20.32) (−1, 8)
No change 46 −2.90 (20.88) (−8, 2) 1.45 (17.15) (−3, 6) 50 −2.67 (9.13) (−5,−1) −2 (12.44) (−5, 1)
Little better 54 1.85 (22.82) (−3, 7) 3.70 (15.41) (0, 7) 68 −2.45 (20.21) (−7, 2) −0.49 (14.67) (−3, 2)
Constipation 247 247
Little worse 68 15.20 (30.16) (9, 21) 10.29 (27.77) (5, 16) 48 −1.39 (24.75) (−7, 5) 2.78 (21.56) (−2, 8)
No change 42 0 (19.48) (−5, 5) 2.38 (18.61) (−2, 7) 48 −3.47 (12.38) (−6, 0) −1.39 (9.62) (−4, 1)
Little better 58 0 (26.49) (−6, 6) 0 (16.52) (−4, 4) 70 −2.86 (30.95) (−9, 3) 0 (26.62) (−5, 5)
Diarrhea 248 248
Little worse 71 0 (21.08) (−4, 4) 3.29 (18.07) (0, 6) 48 0.69 (14.57) (−3, 4) 4.17 (13.09) (1, 7)
No change 43 −2.33 (15.25) (−6, 2) -0.78 (11.47) (−4, 2) 48 −1.39 (9.62) (−4, 1) −2.08 (10.67) (−5, 0)
Little better 56 −0.6 (21.55) (−5, 4) 2.38 (20.94) (−2, 7) 69 −1.93 (17.97) (−6, 2) −1.93 (20.52) (−6, 2)
Financial difficulties 240 240
Little worse 69 9.66 (22.94) (5, 14) 8.21 (22.44) (4, 13) 49 −3.40 (20.69) (−8, 2) 4.76 (21.52) (0, 1)
No change 41 4.07 (13.32) (1, 8) 2.44 (8.79) (0, 5) 47 0 (0) (NA) −0.71 (4.86) (−2, 0)
Little better 58 1.15 (22.48) (−4, 6) 1.72 (15.82) (−2, 5) 66 1.52 (9.12) (0, 3) 0.51 (16) (−3, 4)
Table 5Observed and adjusted changes of the QLQ–BR23 questionnaire after three and six months
After 3 months After 6 months
Between T0 and T1 Between T1 and T2
QLQ-BR23 Observed changes Adjusted changes Observed changes Adjusted changes (post-test - pre-test) (post-test - then-test) (post-test - pre-test) (post-test - then-test)
N Mean (SD) 95% CI Mean (SD) 95% CI N Mean (SD) 95% CI Mean (SD) 95% CI
Body image 232 232
Little worse 70 −20.44 (27.41) (−26,−15) −15.40 (25.02) (−20,−10) 47 0.41 (16.58) (−4, 4) −10.76 (22.82) (−16,−5)
No change 41 −7.32 (15.16) (−11,−3) −4.07 (15.60) (−8, 0) 46 2.72 (10.1) (0, 5) −0.91 (12.82) (−4, 2)
Little better 49 −14.91 (24.41) (−21,−9) −4.93 (18.31) (−9,−1) 65 1.28 (22.93) (−3, 6) −1.45 (20.88) (−6, 3)
Sexual functioning 198 198
Little worse 56 6.85 (20.79) (2, 11) 7.44 (21.06) (3, 12) 56 −0.44 (12.55) (−4, 3) 10.53 (17.93) (6, 15)
No change 34 3.92 (22.87) (−3, 11) 5.88 (22.80) (−1, 13) 34 2.03 (16.33) (−2, 6) 2.44 (16.48) (−2, 7)
Little better 43 1.94 (15.94) (−2, 6) 0 (10.91) (−3, 3) 43 −0.89 (18.1) (−5, 3) 0 (17.70) (−4, 4)
Sexual enjoyment 74 74
Little worse 23 14.49 (19.66) (7, 22) 11.59 (19.09) (5, 18) 23 12.50 (29.5) (0, 25) 14.58 (20.97) (5, 24)
No change 16 10.42 (33.82) (−4, 25) 4.17 (29.50) (−9, 17) 16 1.45 (21.27) (−6, 9) 2.90 (28.27) (−7, 13)
Little better 11 12.12 (22.47) (0, 24) 9.09 (21.56) (−3, 21) 11 −2.08 (22.67) (−12, 8) 0 (21.08) (−9, 9)
Future perspectives 236 236
Little worse 68 7.35 (32.5) (1, 14) −8.82 (30.81) (−15,−3) 68 3.47 (30.16) (−4, 11) −0.69 (24.30) (−7, 5)
No change 43 20.93 (32.55) (13, 29) 7.75 (26.06) (1, 14) 43 0 (23.57) (−6, 6) 4.76 (30.43) (−3, 12)
Little better 48 10.42 (30.1) (3, 18) 3.47 (24.06) (−2, 9) 48 1.06 (25.38) (−4, 6) 8.47 (23.92) (3, 13)
Systemic therapy side effects 252 252
Little worse 72 18.83 (21.51) (15, 23) 19.79 (18.60) (16, 23) 72 −3.49 (18.26) (−8, 1) 10.27 (18.90) (6, 15)
No change 45 4.41 (15.02) (1, 8) 3.84 (14.03) (0, 7) 45 0.23 (10.2) (−2, 3) 2.45 (7.89) (1, 4)
Little better 54 6.02 (13.64) (3, 9) 6.02 (12.35) (3, 9) 54 −4.19 (15.12) (−7,−1) 3.94 (19.39) (0, 8)
Breast symptoms 212 212
Little worse 57 14.08 (27.69) (8, 2) 18.08 (22.21) (13, 23) 57 −4.31 (16.81) (−8, 0) 6.44 (18.26) (2, 11)
No change 36 10.34 (20.43) (5, 16) 9.72 (21.59) (4, 16) 36 −3.57 (13.35) (−7, 0) 3.77 (14.28) (0, 7)
Little better 53 16.61 (21.1) (12, 21) 7.13 (18.87) (3, 11) 53 −2.21 (20.17) (−7, 2) 3.63 (20.65) (−1, 8)
Arm symptoms 235 235
Little worse 67 7.88 (17.6) (4, 11) 8.54 (19.28) (5, 12) 67 0.58 (18.27) (−4, 5) 10.76 (19.53) (6, 15)
No change 41 3.39 (13.54) (0, 7) 4.74 (14.14) (1, 8) 41 1.89 (13.82) (−1, 5) 5.89 (14.65) (2, 9)
Little better 55 4.55 (17.51) (1, 8) 1.41 (13.83) (−2, 5) 55 0.69 (13.98) (−2, 4) 0.69 (16.93) (−3, 4)
Observed changesPost-test–Pre-test; adjusted changes: Post-test–Then-test
SDstandard deviation,CIconfidence interval
Table 6MID in case of deterioration and improvement of HRQOL for both QLQ-C30 and QLQ-BR23 questionnaires after three and six months
Deterioration of HRQOL Improvement of HRQOL
Observed changes Adjusted changes Observed changes Adjusted changes
QLQ-BR23 QLQ - C30
After 3 months 5–26 8–19 0.3–10 0.6–4
After 6 months 0.5–10 4–18 0.8–7 0–7
After 3 months 7–20 7–18 2–15 0–7
dimensions) and 5/7 dimensions of the QLQ-BR23 ques-tionnaire (except the sexual enjoyment and the future perspectives dimensions), an increase of the RS effect was observed in case of deterioration between T1 and T2. The RS effect becomes increasingly important over time specifically for the anchor category « little worse ». This indicates that the RS must be considered when de-termining the MID for deterioration.
For 8/15 dimensions of QLQ-C30 questionnaire (GHS, role, emotional, social and cognitive functioning, pain,
diarrhea and insomnia dimensions) and 5/7 dimensions of the QLQ-BR23 questionnaire (except the sexual enjoyment and the future perspectives dimensions), a decrease of the RS effect was observed in case of improvement with corresponding ES values close to zero and p-values≥0.05. These values mean that the impact of the RS effect became negligible on the determination of the MID in case of improvement after six months.
Regarding the QLQ-C30 questionnaire, the ob-served MID in case of deterioration after three months was between 5 and 26 points: a mean differ-ence of 5 points was sufficient to conclude that the difference was clinically significant at T1. After tak-ing into account the RS effect, the minimal differ-ence considered as important for patients increased to 8 points. Furthermore, the adjusted MID became between 8 and 19 points and thus more restricted than it was for the observed changes (without taking into account the RS effect). However, at T2, the ob-served MID was between 0.5 and 10 then became between 4 and 18 for the adjusted MID. Thus, if we did not have taken into account the occurrence of the RS effect, we can wrongly conclude that a deteri-oration of 0.5 point is considered as the MID for the patients which seems to be very low. Whereas, after taking into account the RS effect, the mean differ-ence became between 4 and 18 points which seems to be more relevant than the previous interval.
Comparing the results of adjusted MID in case of deterioration at T1 and T2, we find that the MID was between 8 and 19 points at T1 then became between 4 and 18 points at T2, which means that a smaller change of HRQOL can be considered as clinically significant to the patients. In other words, a difference of 4 points out of 100 was not enough to say that this difference was significant after three months; but the same difference became significant to the patient after 6 months. In addition, consistent results have been found for the QLQ-BR23 questionnaire in case of deterioration concerning the observed and the adjusted MID.
Regarding HRQOL improvement, no impact of the RS on the determination of the MID was observed. In contrast, the RS effect seemed to highly impact the MID for deterioration. To illustrate, the minimal of observed MID was smaller than one point in case of deterioration for QLQ-C30 (MID: 0.5–10) and QLQ-BR23 (MID: 0.4– 4) after six months, the minimal of each MID was equal to 4 points for the C30 and to 6 points for QLQ-BR23 after taking into account the RS effect. Thus, with-out taking into account the occurrence of the RS effect, we can wrongly conclude that a difference of less than 1 point is clinically significant to the patients.
For patients who have an improvement in their HRQOL, the minimal of observed and adjusted MID Table 7MID for QLQ-C30 and QLQ-BR23 questionnaires after 3
and 6 months compared to a threshold of 5 points
After 3 months After 6 months
Observed changes Adjusted changes Observed changes Adjusted changes QLQ-C30 Global Health Status
16 12a 0.5 8a
Physical functioning
12 12a 0.4 9a
Role functioning
26 19a 2 18a
Cognitive functioning
5 11a 1 10a
Social functioning
20 15a 1 10a
Emotional functioning
3.5 6a 0.5 6a
Fatigue 27 23a 0.2 20a
Pain 14 9a 2 17a
Dyspnea 9 11a 4 8a
Insomnia 6 8a 4 15a
Financial difficulties
10 8a 3 5a
Appetite loss 10 11a 10 4
Constipation 15 10a 1 3
Nausea and vomiting
9 8a 3 1
QLQ-BR23
Body image 20 15a 0.4 11a
Sexual functioning
7 7a 0.4 11a
Systemic therapy side effects
19 20a 3 10a
Breast symptoms 14 18a 4 6a
Arm symptoms 8 9a 0.6 11a
Sexual enjoyment
14 12a 13 15a
Future perspectives
7 9a 3 0.7
a
Fig. 1Flowchart with number of questionnaires collected at each measurement time
found for the two questionnaires after three and six months is close to zero and they all stayed close to zero after taking into account the RS effect, except for the ob-served MID after three months for the QLQ-BR23 ques-tionnaire which was equal to 2 points. We can conclude that a very small improvement over time can be consid-ered as important for the patient.
For thirteen over the 15 scales of the QLQ-C30 ques-tionnaire and all scales of the QLQ-BR23, the observed and adjusted MID was greater than 5 points after three months. Whereas, after six months, 11/15 scales of the QLQ-C30 and 5/7 scales of the QLQ-BR23 had an ob-served MID smaller than 5 points and became greater than 5 points after taking into account the RS effect. Thus, the RS effect seems to have an important impact on the determination of the MID and notably after six months.
Our study confirms the earlier results released by Kvam and al. between two measurement times which showed that the RS has an important impact on the results in case of deterioration and was unimportant in case of improvement [13]. However, this previous study was limited to two measurement times.
Three measurement times were considered in our study allowing us to evaluate the change of RS effect and to detect specifically the dimensions for which an increase or a decrease of the RS effect was observed over time. Moreover, using three measurement times allowed us to compare the MID at three and six months and to conclude the importance of taking into account the RS effect in order to obtain a reduced interval of MID and a MID significant after six months comparing with a threshold of five points.
Another strength of our study was the consideration of all dimensions of both QLQ-C30 and QLQ-BR23 breast cancer module. The study of Kvam and al. was on patients with multiple myeloma and the QLQ-MY20 multiple myeloma module [22] was not yet validated at
the time of the conception of this study, which justifies the limitation to the QLQ-C30.
Twenty two dimensions have been analysed in our study that provides to collect a lot of information on di-mension impacted by the RS effect and trends over time. A limitation of our study is the use of the then-test method to assess the occurrence of the RS effect. This method required to be planned at the time of the con-ception of the study and may be subject to a recall bias. Moreover, it focused on the recalibration component to study the impact of the RS, thus we recommend more researches in order to determine the impact of the other components of the RS effect (reprioritization and recon-ceptualization) on the determination of the MID. The structural equation modeling may be preferable to the then-test method to detect all the three components of the RS in a HRQOL analysis. However, the Oort proced-ure based on the structural equation modelling to detect the RS effect was developed and mainly applied the SF-36 questionnaire [11, 23]. Some researches are still on-going to adapt this procedure to the EORTC question-naires [24].
Using item response theory (IRT) may be very import-ant for the future researches to assess the components of RS and its impact on the determination of the MID [19].
Although the use of three measurement times was useful in this study, but there is a recall bias may affect the answers of patients over time. In addition, using just the anchor based approach to compute MID may bias the finding as the standard practice is the combination with both anchor and distribution based methods. The limited number of patients per anchor category is con-sidered also as a limitation of our study. Hence, further studies are needed to study the RS trends with a quite large number of patients per anchor-item category.
The heterogeneity of our data is considered also as a limitation of this study.
The MID allows planning studies in order to deter-mine both the required sample size and the statistical power. The MID also has a direct impact on the time to HRQOL score deterioration approach for longitudinal analysis [25, 26].
Conclusion
Our work has extended the research for the first time to investigate the RS effect on the determination of the MID between three measurement times. This investiga-tion permitted to detect the important role of the RS ef-fect on the determination and the significance of the MID in the most scales of two questionnaires six months after the breast cancer diagnosis. Finally, we rec-ommend further researches to confirm, support or re-view our findings and develop novel methods in order to progress in this field.
Additional file
Additional file 1: Table S1.The Response shift effect for the QLQ-C30 questionnaire after three and six months for all patients and according to each category of the anchor.Table S2.The Response shift effect for the QLQ-BR23 questionnaire after three and six months for all patients and according to each category of the anchor.Table S3.Observed and adjusted changes of the QLQ–C30 questionnaire after three and six months.Table S4.Observed and adjusted changes of the QLQ–BR23 questionnaire after three and six months. (DOCX 95 kb)
Abbreviations
EORTC:European organization for research and treatment of cancer; ES: Effect size; GHS: Global health status; HRQOL: Health-related quality of life; MID: Minimal important difference; RS: Response shift; SD: Standard deviation
Acknowledgements
We thank all patients who participated in this study.
Funding
This work was supported by a grant from the“Institut National du Cancer (INCA_10846)”. The study sponsor had no role in the conception, the design of the study, the data acquisition and analysis or in the manuscript preparation.
Availability of data and materials
Data are unsuitable for public deposition due to ethical and legal restrictions and are therefore available upon request with the signature of a data privacy form. To request the data, the readers may contact Prof. Franck BONNETAIN (email: [email protected])
Authors’contributions
AO performed the statistical analyses and interpretation and written the manuscript, TC, FG, MV, DJ, MM, SC, JC, OG designed the study, SC, JC, OG included the patients, FB designed the study, written protocol, interpreted the data and review the draft, AA managed the statistical analyses, interpreted the data and review the draft. All authors read and approved the final manuscript.
Competing interests
The authors declare that they have no competing interests.
Consent for publication
Not applicable, no individual data reported.
Ethics approval and consent to participate
All of the participants gave their written informed consent, and the protocol of the study was approved by the regional ethics committee (Comité Consultatif de Protection des Personnes dans la Recherche Biomédicale de Bourgogne) in 2005.
Author details 1
Methodology and Quality of Life Unit in Oncology, University Hospital of Besançon, Besançon, France.2INSERM UMR 1098, University of
Franche-Comte, Besançon, France.3Medical Oncology Department, Centre Alexis Vautrin, Nancy, France.4French National Platform Quality of Life and Cancer, Besançon, France.5Inserm CIC-EC 1433, and CHU, Clinical Epidemiology and Evaluation Department, Nancy, France.6Department of Epidemiology and Public Health, Faculty of Medicine, EA 3430, University of Strasbourg, Strasbourg, France.7Pôle Recherche–Innovations, University Hospital of Reims, Reims, France.8Surgery Department, Centre Georges François Leclerc, Dijon, France.9Gynecological and Obstetric Department, Institut Mère Enfant, University Hospital of Reims, Reims, France.10Public health laboratory, EA 3279, Aix-Marseille University, Marseille, France.
Received: 13 January 2016 Accepted: 29 November 2016
References
1. Liang MH. Longitudinal construct validity: establishment of clinical meaning in patient evaluative instruments. Med Care. 2000;38:II84–90.
2. Osoba D, Rodrigues G, Myles J, Zee B, Pater J. Interpreting the significance of changes in health-related quality-of-life scores. J Clin Oncol. 1998;16:139–44.
3. Jaeschke R, Singer J, Guyatt GH. Measurement of health status: ascertaining the minimal clinically important difference. Control Clin Trials. 1989;10:407–15. 4. Juniper EF, Guyatt GH, Willan A, Griffith LE. Determining a minimal
important change in a disease-specific quality of life questionnaire. J Clin Epidemiol. 1994;47:81–7.
5. Crosby RD, Kolotkin RL, Williams GR. Defining clinically meaningful change in health-related quality of life. J Clin Epidemiol. 2003;56:395–407. 6. Revicki D, Hays RD, Cella D, Sloan J. Recommended methods for
determining responsiveness and minimally important differences for patient-reported outcomes. J Clin Epidemiol. 2008;61:102–9.
7. Maringwa JT, Quinten C, King M, Ringash J, Osoba D, Coens C, Martinelli F, Vercauteren J, Cleeland CS, Flechtner H, Gotay C, Greimel E, Taphoorn MJ, Reeve BB, Koch JS-V, Weis J, Smit EF, van Meerbeeck JP, Bottomley A, Group on behalf of the EP project and the LC. Minimal important differences for interpreting health-related quality of life scores from the EORTC QLQ-C30 in lung cancer patients participating in randomized controlled trials. Support Care Cancer. 2010;19:1753–60.
8. Maringwa J, Quinten C, King M, Ringash J, Osoba D, Coens C, Martinelli F, Reeve BB, Gotay C, Greimel E, Flechtner H, Cleeland CS, Koch JS-V, Weis J, Bent MJVD, Stupp R, Taphoorn MJ, Bottomley A, Group on behalf of the EPP and BC. Minimal clinically meaningful differences for the EORTC QLQ-C30 and EORTC QLQ-BN20 scales in brain cancer patients. Ann Oncol. 2011; 22:2107–12.
9. Sprangers MAG, Schwartz CE. Integrating response shift into health-related quality of life research: a theoretical model. Soc Sci Med. 1999;48:1507–15. 10. Schwartz CE, Sprangers MAG. Methodological approaches for assessing
response shift in longitudinal health-related quality-of-life research. Soc Sci Med. 1999;48:1531–48.
11. Oort FJ. Using structural equation modeling to detect response shifts and true change. Qual Life Res. 2005;14:587–98.
12. Hamidou Z, Dabakuyo-Yonli TS, Guillemin F, Conroy T, Velten M, Jolly D, Causeret S, Graesslin O, Gauthier M, Mercier M, Bonnetain F. Impact of response shift on time to deterioration in quality of life scores in breast cancer patients. PLoS One. 2014;9:e96848.
13. Kvam AK, Wisløff F, Fayers PM. Minimal important differences and response shift in health-related quality of life; a longitudinal study in patients with multiple myeloma. Health Qual Life Outcomes. 2010;8:79.
15. Aaronson NK, Ahmedzai S, Bergman B, Bullinger M, Cull A, Duez NJ, Filiberti A, Flechtner H, Fleishman SB, de Haes JCJM, Kaasa S, Klee M, Osoba D, Razavi D, Rofe PB, Schraub S, Sneeuw K, Sullivan M, Takeda F. The European Organization for research and treatment of cancer QLQ-C30: a quality-of-life instrument for use in international clinical trials in oncology. J Natl Cancer Inst. 1993;85:365–76.
16. Fayers PM, Aaronson NK, Bjordal K, Groenvold M, Curran D. Bottomley AobotEQoLG. In: EORTC QLQ-C30 Scoring Manual. 3rd edition. EORTC; 2001. edn; 2001.
17. Sprangers MA, Groenvold M, Arraras JI, Franklin J, te Velde A, Muller M, Franzini L, Williams A, de Haes HC, Hopwood P, et al. The European Organization for Research and Treatment of Cancer breast cancer-specificquality-of-life questionnaire module: first results from a three-country field study. J Clin Oncol. 1996;14:2756–68.
18. Sprangers M, Van Dam F, Broersen J, Lodder L, Wever L, Visser M, Oosterveld P, Smets E. Revealing response shift in longitudinal research on fatigue–the use of the thentest approach. Acta Oncol. 1999;38:709–18. 19. Anota A, Bascoul-Mollevi C, Guillemin F, Conroy T, Velten M, Joly D, Mercier
M, Graesslin O, Causeret S, Cuisenier J, Hamidou Z, Bonnetain F. Item response theory and factor analysis as a mean to characterize occurrence of response shift in a longitudinal quality of life study in breast cancer patients. Health Qual Life Outcomes. 2014;12:32.
20. Kazis L, Anderson J, Meenan R. Effect sizes for interpreting changes in health status. Med Care. 1989;27:178–89.
21. Development Core Team R. R: A Language and Environment for Statistical Computing. R Foundation for Statistical Computing, Vienna, Austria. ISBN 3-900051-07-0. URL http://www.R-project.org/.
22. Cocks K, Cohen D, Wisløff F, Sezer O, Lee S, Hippe E, Gimsing P, Turesson I, Hajek R, Smith A, Graham L, Phillips A, Stead M, Velikova G, Brown J. An international field study of the reliability and validity of a disease-specific questionnaire module (the QLQ-MY20) in assessing the quality of life of patients with multiple myeloma. Eur J Cancer. 2007;43:1670–8.
23. Oort FJ, Visser MRM, Sprangers MAG. An application of structural equation modeling to detect response shifts and true change in quality of life data from cancer patients undergoing invasive surgery. Qual Life Res. 2005;14: 599–609.
24. Anota A, Bascoul-Mollevi C, Conroy T, Guillemin F, Velten M, Jolly D, Pam A, Bonnetain F. Structural Equation Modeling to characterize the occurrence of the Response Shift effect in a longitudinal quality of life study. 21thAnnual
Conference of the International Society for Quality of Life Research (ISOQOL), 15–18 October 2014, Berlin (Germany).
25. Bonnetain F, Dahan L, Maillard E, Ychou M, Mitry E, Hammel P, Legoux J-L, Rougier P, Bedenne L, Seitz J-F. Time until definitive quality of life score deterioration as a means of longitudinal analysis for treatment trials in patients with metastatic pancreatic adenocarcinoma. Eur J Cancer. 2010;46: 2753–62.
26. Hamidou Z, Dabakuyo TS, Bonnetain F. Impact of response shift on longitudinal quality-of-life assessment in cancer clinical trials. Expert Rev Pharmacoecon Outcomes Res. 2011;11:549–59.
• We accept pre-submission inquiries
• Our selector tool helps you to find the most relevant journal
• We provide round the clock customer support
• Convenient online submission
• Thorough peer review
• Inclusion in PubMed and all major indexing services
• Maximum visibility for your research
Submit your manuscript at www.biomedcentral.com/submit