R E S E A R C H
Open Access
Facilitating action planning within audit
and feedback interventions: a
mixed-methods process evaluation of an action
implementation toolbox in intensive care
Wouter T. Gude
1*†, Marie-José Roos-Blom
1,3†, Sabine N. van der Veer
4, Dave A. Dongelmans
2, Evert de Jonge
5,
Niels Peek
4,6and Nicolette F. de Keizer
1,3Abstract
Background:Audit and feedback (A&F) is more effective if it facilitates action planning, but little is known about how best to do this. We developed an electronic A&F intervention with an action implementation toolbox to improve pain management in intensive care units (ICUs); the toolbox contained suggested actions for improvement. A head-to-head randomised trial demonstrated that the toolbox moderately increased the intervention’s effectiveness when compared with A&F only.
Objective:To understand the mechanisms through which A&F with action implementation toolbox facilitates action planning by ICUs to increase A&F effectiveness.
Methods:We extracted all individual actions from action plans developed by ICUs that received A&F with (n= 10) and without (n= 11) toolbox for 6 months and classified them using Clinical Performance Feedback Intervention Theory. We held semi-structured interviews with participants during the trial. We compared the number and type of planned and completed actions between study groups and explored barriers and facilitators to effective action planning. Results:ICUs with toolbox planned more actions directly aimed at improving practice (p= 0.037) and targeted a wider range of practice determinants compared to ICUs without toolbox. ICUs with toolbox also completed more actions during the study period, but not significantly (p= 0.142). ICUs without toolbox reported more difficulties in identifying what actions they could take. Regardless of the toolbox, all ICUs still experienced barriers relating to the feedback (low controllability, accuracy) and organisational context (competing priorities, resources, cost).
Conclusions:The toolbox helped health professionals to broaden their mindset about actions they could take to change clinical practice. Without the toolbox, professionals tended to focus more on feedback verification and exploring solutions without developing intentions for actual change. All feedback recipients experienced organisational barriers that inhibited eventual completion of actions.
Trial registration:ClinicalTrials.gov,NCT02922101. Registered on 26 September 2016.
Keywords:Intensive care, Medical audit, Feedback, Quality improvement, Quality indicators
© The Author(s). 2019Open AccessThis article is distributed under the terms of the Creative Commons Attribution 4.0 International License (http://creativecommons.org/licenses/by/4.0/), which permits unrestricted use, distribution, and reproduction in any medium, provided you give appropriate credit to the original author(s) and the source, provide a link to the Creative Commons license, and indicate if changes were made. The Creative Commons Public Domain Dedication waiver (http://creativecommons.org/publicdomain/zero/1.0/) applies to the data made available in this article, unless otherwise stated. * Correspondence:[email protected]
†Wouter T. Gude and Marie-José Roos-Blom contributed equally to this work.
1Department of Medical Informatics, Amsterdam UMC, Amsterdam Public
Health Research Institute, University of Amsterdam, Amsterdam, The Netherlands
Introduction
Audit and feedback (A&F) is an important strategy to close the gap between actual and desired clinical practice, but its observed effects vary greatly across studies [1]. The Cochrane review of 140 randomised controlled trials (RCTs) identified action planning to be an important effect modifier of A&F [1]. However, few A&F trials explicitly de-scribed action planning as part of the intervention, and those trials that did appeared to deliver this component of the intervention in various ways [2,3]. As a result, some re-cent studies that aimed to reproduce the positive effect of action planning have failed [4]. This indicates that the re-view’s finding about the positive effect of action planning, derived from indirect comparisons from meta-regressions, is insufficiently reliable and does not inform us how to in-corporate action planning as an intervention component to A&F [5, 6]. Conducting head-to-head trials instead, com-paring different action planning approaches in addition to providing A&F, would provide useful information to guide the operationalisation of action planning in A&F and other quality improvement interventions [7–9]. Although action planning is a familiar activity in clinical practice, health pro-fessionals often lack the time, skills or knowledge to inter-pret feedback and formulate and plan improvement actions [10]. Providing an action implementation toolbox, contain-ing suggested actions and materials linked to specific po-tential barriers in the care process, may support this action planning process.
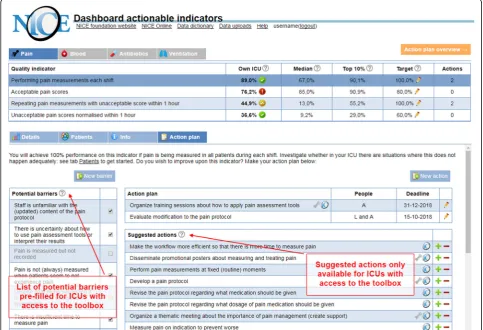
The Dutch National Intensive Care Evaluation (NICE) foundation developed an electronic A&F intervention to improve pain management practice in Dutch ICUs [11,12]. In this context, optimal pain management means that pain is measured in every patient in each shift; pain scores are usually acceptable; and if they are not, appropriate treat-ment is given and pain measuretreat-ment is repeated within 1 h to evidence that the pain is normalised. The intervention was evaluated in a head-to-head cluster RCT in which all participating ICUs received feedback on four pain manage-ment indicators. ICUs were randomised to receive a blank structured action plan with action implementation toolbox (feedback with toolboxgroup) and the other half to receive a blank structured action plan but no toolbox (feedback only group) [13]. The toolbox listed potential barriers in the pain management process alongside suggested actions and materials to address these (Fig.1) [11]. Based on the-ory and previous empirical research [6, 14–16], we hypothesised that the toolbox would increase the effective-ness of the A&F intervention by helping ICU teams to for-mulate and implement improvement actions. Consistent with this hypothesis, the trial analysis found absolute im-provement on overall pain management performance in both the feedback with toolbox group (14.8%; 95% confi-dence interval [CI], 14.0–15.5) and thefeedback onlygroup (4.8%; 95% CI, 4.2–5.5), with the feedback with toolbox group achieving significantly larger effects than the feedback onlygroup (p= 0.049) [13].
In this study, we aimed to understand the mechanisms through which the A&F intervention in combination with the action implementation toolbox facilitated ICUs’action planning processes to inform future A&F and toolbox re-search. To achieve this, we examined how action planning processes differed between the study arms in terms of the development of action plans, the extent to which those plans were successfully executed and what barriers and fa-cilitators were experienced during these processes.
Methods
Study setting and participants
The study was carried out alongside a cluster RCT ( Clini-calTrials.gov NCT02922101). Twenty-one ICUs in the Netherlands participated, including 25,141 patient admis-sions [11, 13]. ICUs were eligible to participate if they (1) had allocated staff to set up a local quality improvement team, consisting of at least one intensivist and one nurse, and—in addition to their regular data upload to the NICE quality registry—(2) had the possibility to submit all data items required for calculating four newly defined pain man-agement indicators [17]. Each ICU identified one team member as the primary contact for the research team dur-ing the trial. The medical manager of each ICU signed a consent form to formalise their commitment. ICUs started receiving the intervention between January 2017 and Contributions to the literature
Based on half a century of audit and feedback (A&F) research, we know A&F interventions are more effective if they facilitate action planning, but little is known about how
best to do this. In a cluster RCT (published elsewhere), we showed that a toolbox that suggests improvement actions increased A&F effectiveness.
The current study focused on understanding the mechanism by which the toolbox increased A&F effectiveness. We showed that feedback recipients who used the toolbox progressed through the action planning processes quicker, whilst targeting more areas for improvement.
We also showed that end-users preferred toolbox actions targeting care processes over those targeting outcomes because the latter require more organisational and cultural changes.
Our findings contribute to the design of action planning functionalities in A&F interventions and underline which barriers could be overcome by an action implementation toolbox and which barriers would require additional
November 2017 for a duration of 6 months. ICUs were aware that there were two variations of the intervention be-ing evaluated, but they were not told what aspect (i.e. the toolbox) was randomised. Figure1displays a screenshot of the dashboard and describes how action planning with and without action implementation toolbox took place.
Theoretical framework
The recently published Clinical Performance Feedback Intervention Theory (CP-FIT) provides information about how feedback works in practice and what factors may influence its effects [18]. It builds upon 30 pre-existing theories relating to feedback and a meta-synthe-sis of 65 qualitative evaluation studies of 73 A&F inter-ventions. CP-FIT presents a feedback cycle consisting of a sequence of ten processes:Goal setting,Data collection and analysis,Feedback, recipientInteraction,Perception, optional Verification and Acceptance of the feedback, followed by Intention, Behaviour and Clinical
performance improvement (see Fig. 2). It proposes that feedback becomes less effective if any of those individual processes fails, causing progress around the cycle to slow or stop (e.g. if feedback recipients do not accept the feedback, they will not develop improvement intentions). Feedback processes’ success or failure is influenced by 70 factors relating to the feedback itself, the recipient of the feedback and the context in which the feedback is delivered. These factors exert their effects via seven ex-planatory mechanisms of increasing or decreasing the feedback’s Complexity, Relative advantage, Resource match, Compatibility, Credibility, Social influence and Actionability[18].
For the current study, we were interested into what extent ICU teams confronted with feedback (Perception) react with planning (Intention) and completing ( Behav-iour) actions aimed at actually improving practice. Fol-lowing CP-FIT, ICUs may also plan actions that may not directly lead to Clinical performance improvement, such
as verifying the feedback’s underlying data (Verification, but no Acceptance) or exploring possible solutions to the problem (Acceptance, but noIntention).
Data collection
We extracted all individual actions from the action plans that ICUs had developed and maintained in the electronic dashboard as part of the intervention. This included the actions’titles, descriptions, deadlines, assigned people, sta-tus (in progress, completed, cancelled), whether they were self-defined or selected from the toolbox and timestamps of any action plan changes (e.g. status update).
We held brief semi-structured telephone interviews with the ICUs’ main contact every 4–6 weeks during the trial to explore which barriers and facilitators ICUs experi-enced relating to the action planning process. We also verified whether action plans were up-to-date and encour-aged ICUs to update the action plan if this was not the case. The structure of the calls was the same for ICUs in both study groups, with the exception that the action
implementation toolbox and its contents were not men-tioned to ICUs in thefeedback onlygroup. The interview topic guide is included as Additional file1. The interviews were conducted by one researcher (WG or MRB) and lasted approximately 10–15 min. Interview notes were emailed to the ICU team for member checking [19].
Analysis
Two researchers (WG and MRB, who also conducted the interviews) independently coded all actions from the action plans in three steps as described below; discrepancies were resolved through consensus. First, we labelled the individual actions to identify similar actions. We derived labels from the list of toolbox actions as a starting point and iteratively added labels for self-defined actions that did not match any of the pre-defined toolbox actions. Second, we used CP-FIT to identify for each action which feedback cycle process it reflected (i.e.Verification,Acceptance,Intentionor Behav-iour) to indicate its proximity to actual practice change. Third, we grouped those actions reflecting Intention or
Behaviour using the integrated framework for identifying factors that prevent or enable improvements in healthcare professional practice by Flottorp et al. [20] to understand which practice determinants ICUs had targeted for change. Practice determinants are“factors that might prevent or en-able improvements in that practice” and have been orga-nised in seven domains: guideline factors (e.g. compatibility of the recommended behaviour), individual health profes-sional factors (e.g. awareness with the recommendation), patient factors (e.g. patient preferences), professional inter-actions (e.g. communication and influence), incentives and resources (e.g. information system), capacity for organisa-tional change (e.g. leadership) and social, political or legal factors (e.g. payer or funder policies) [20].
We counted the number of actions per feedback cycle process [18] and per targeted practice domain [20] for both study groups. We used chi-square tests to test whether the distribution of actions across the feedback cycle processes and targeted practice domains differed be-tween groups. We also calculated ICUs’median and inter-quartile range (IQR) number of planned and completed actions, completion rates and time (in days) taken to complete actions; we tested the difference between groups using the Wilcoxon test. We also counted for each unique action the number of ICUs in both study groups that had planned and/or completed the action during the trial. This allowed us to assess the added value of the toolbox by un-derstanding (1) which actions were most or least often se-lected, (2) which actions were easy or difficult to complete and (3) to what extent and how toolbox actions differed from self-defined actions.
The interview transcripts were independently coded by two researchers (WG and MRB) using CP-FIT’s code-book [18]. For each barrier or facilitator mentioned by ICUs, we marked which mechanisms they activated and which feedback cycle process of interest (i.e.Verification, Acceptance,Intention or Behaviour) was affected.
Results
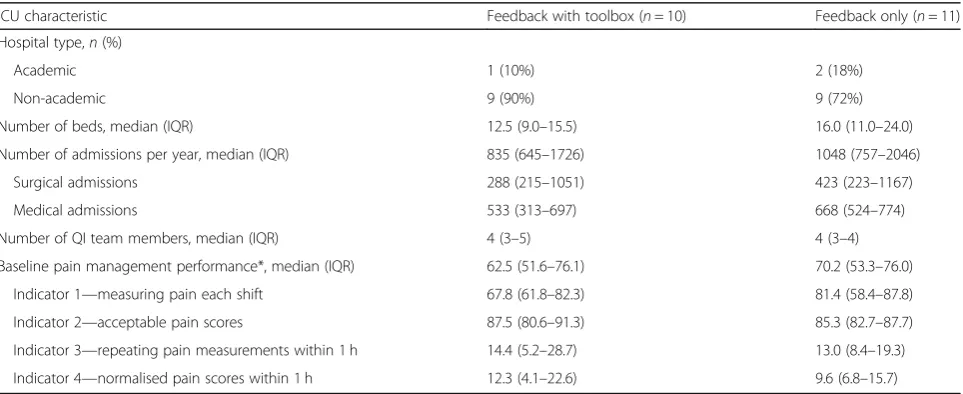
Table 1 displays the baseline characteristics of the 21 ICUs that participated in the trial (10 in the feedback with toolbox group and 11 in the feedback only group). ICU teams usually consisted of three to five members and included intensivists, nurses and managers. The me-dian baseline pain management performance was, des-pite randomisation, significantly lower in the feedback with toolboxgroup compared to thefeedback onlygroup (70.2% vs. 62.5%;p= 0.049) [13].
Action plans
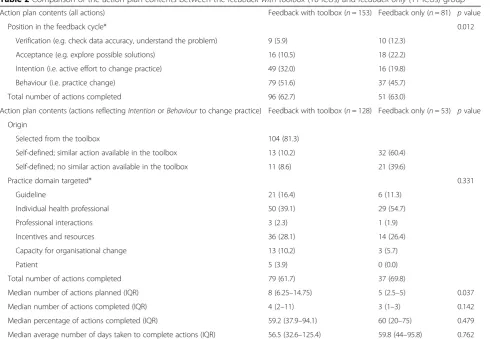
Action plans contained a total of 234 individual actions (upper part Table2). Fifty-three (34.6%) actions reflected the Verification or Acceptance process of the feedback cycle, with the remaining 181 (77.4%) targeting actual practice change. Sixty-five (27.8%) of these were still in progress, reflectingIntention, and 116 (49.6%) were com-pleted, reflecting Behaviour. The distribution of the ac-tions’ coded positions in the feedback cycle differed significantly between study groups (p= 0.012), with 87.3% (128 out of 153) of the actions in thefeedback with toolbox group reflecting theIntentionorBehaviourprocess com-pared to 65.4% (53 out of 81) in thefeedback onlygroup.
Table 1Characteristics of the 21 ICUs participating in the cluster-randomised controlled trial
ICU characteristic Feedback with toolbox (n= 10) Feedback only (n= 11)
Hospital type,n(%)
Academic 1 (10%) 2 (18%)
Non-academic 9 (90%) 9 (72%)
Number of beds, median (IQR) 12.5 (9.0–15.5) 16.0 (11.0–24.0)
Number of admissions per year, median (IQR) 835 (645–1726) 1048 (757–2046)
Surgical admissions 288 (215–1051) 423 (223–1167)
Medical admissions 533 (313–697) 668 (524–774)
Number of QI team members, median (IQR) 4 (3–5) 4 (3–4)
Baseline pain management performance*, median (IQR) 62.5 (51.6–76.1) 70.2 (53.3–76.0)
Indicator 1—measuring pain each shift 67.8 (61.8–82.3) 81.4 (58.4–87.8)
Indicator 2—acceptable pain scores 87.5 (80.6–91.3) 85.3 (82.7–87.7)
Indicator 3—repeating pain measurements within 1 h 14.4 (5.2–28.7) 13.0 (8.4–19.3)
Indicator 4—normalised pain scores within 1 h 12.3 (4.1–22.6) 9.6 (6.8–15.7)
ICUintensive care unit,IQRinterquartile range,QIquality improvement
Considering only the subset of those actions reflecting Intention or Behaviour to change practice (lower part Table2), ICUs in thefeedback with toolboxgroup planned a median of 8 (6.25–14.75) actions and completed 4 (IQR, 2–11) actions during the intervention period. They picked 104 (81.3%) of 128 actions from the toolbox whilst the remaining 24 were self-defined. ICUs in thefeedback only group planned a median of 5 (IQR, 2.5–5) actions and completed 3 (IQR, 1–3); 32 (60.4%) of the 53 actions in the group were equal or similar to actions present in the toolbox. Whereas the median number of planned actions was significantly higher in thefeedback with toolboxgroup (p= 0.037), this was not the case for the median number of completed actions (p= 0.142). In both groups, ICUs completed approximately 60% of their planned actions during the intervention period (p= 0.479); each action took them on average 2 months to complete (p= 0.762).
In both study groups, actions most often sought prac-tice change in individual health professional factors (39.1% and 54.7%) and resources (28.1% and 26.4%) based on Flottorp et al.’s integrated framework for
identifying factors that prevent or enable improvements in healthcare professional practice [20]. The distribution of the actions across targeted practice domains was simi-lar between the two groups (p= 0.331) (Table 2). We identified 29 unique actions from the action plans of both study groups (Table 3). Action plans from ICUs in the feedback with toolbox group included 26 (89.7%) of these and the feedback only group included 19 (65.5%) of these. Ten unique self-defined actions did not match any of the toolbox actions (indicated with an asterisk in Table 3). Two toolbox actions (keep standard prescrip-tions of pain medication readily available; increase nurses’ autonomy to prescribe pain medication) were not planned by any ICU during the trial.
Experienced barriers and facilitators to action planning processes in the feedback cycle
From the interviews, we identified 19 factors (italicised in brackets) that emerged as barriers or facilitators to action planning processes. These factors exerted their effects through five mechanisms (italicised) onto Table 2Comparison of the action plan contents between thefeedback with toolbox(10 ICUs) andfeedback only(11 ICUs) group
Action plan contents (all actions) Feedback with toolbox (n= 153) Feedback only (n= 81) pvalue
Position in the feedback cycle* 0.012
Verification (e.g. check data accuracy, understand the problem) 9 (5.9) 10 (12.3)
Acceptance (e.g. explore possible solutions) 16 (10.5) 18 (22.2)
Intention (i.e. active effort to change practice) 49 (32.0) 16 (19.8)
Behaviour (i.e. practice change) 79 (51.6) 37 (45.7)
Total number of actions completed 96 (62.7) 51 (63.0)
Action plan contents (actions reflectingIntentionorBehaviourto change practice) Feedback with toolbox (n= 128) Feedback only (n= 53) pvalue
Origin
Selected from the toolbox 104 (81.3)
Self-defined; similar action available in the toolbox 13 (10.2) 32 (60.4)
Self-defined; no similar action available in the toolbox 11 (8.6) 21 (39.6)
Practice domain targeted* 0.331
Guideline 21 (16.4) 6 (11.3)
Individual health professional 50 (39.1) 29 (54.7)
Professional interactions 3 (2.3) 1 (1.9)
Incentives and resources 36 (28.1) 14 (26.4)
Capacity for organisational change 13 (10.2) 3 (5.7)
Patient 5 (3.9) 0 (0.0)
Total number of actions completed 79 (61.7) 37 (69.8)
Median number of actions planned (IQR) 8 (6.25–14.75) 5 (2.5–5) 0.037
Median number of actions completed (IQR) 4 (2–11) 3 (1–3) 0.142
Median percentage of actions completed (IQR) 59.2 (37.9–94.1) 60 (20–75) 0.479
Median average number of days taken to complete actions (IQR) 56.5 (32.6–125.4) 59.8 (44–95.8) 0.762
Values aren(%) of the total number of actions in the study group, except the median (IQR; interquartile ranges) values which summarise at the action plan level (equals ICU level)
multiple processes in the feedback cycle. Figure 2 dis-plays a schematic overview.
Feedback factors
ICUs in both groups felt that the goal of the feedback, adequate pain management, was not always under their
control (Controllability), e.g. when patients were admitted with unacceptable pain from other departments. Add-itionally, ICUs found it easier to remind and encourage staff to measure pain more frequently than to make changes to pain medication to prevent or normalise un-acceptable pain scores (Processvsoutcome). These factors Table 3Unique actions (n= 29) grouped by practice domain with the percentage of ICUs that planned (and completed) these actions
Unique actions grouped by practice domain % of ICUs that planned (completed) the action
Feedback with toolbox(n= 10) Feedback only(n= 11) Guideline (e.g. clarity of the recommendation, accessibility) 60 (40) 36.4 (27.3)
Revise pain protocol about pain monitoring (e.g. frequency, triggers) 40 (20) 9.1 (0)
Workflow redesign; introduce routine to measuring pain 20 (20) 9.1 (9.1)
Increase protocol accessibility (e.g. electronically, flow chart, pocket card) 20 (10) 9.1 (9.1)
Develop pain protocol 20 (10) –
Revise pain protocol about pain medication (e.g. drug choice, dosage choice) 10 (10) 27.3 (18.2)
Workflow redesign; check contraindications to pain medications at admission 10 (0) –
Individual health professional (e.g. knowledge and skills; cognitions) 90 (70) 81.8 (63.6)
Digital newsletter or email 70 (60) 27.3 (27.3)
Educational meeting 70 (50) 9.1 (9.1)
Individual feedback if pain has not been measured 60 (20) 9.1 (9.1)
Promotional poster or message board 40 (30) 36.4 (27.3)
Announcement about pain monitoring during regular staff meeting* 10 (0) 72.7 (63.6)
Quiz about ICU pain management knowledge* – 9.1 (9.1)
Professional interactions (e.g. communication and influence; team processes) 30 (10) 9.1 (9.1)
Include information on pain status to hand-over moments during shift change 20 (0) 9.1 (9.1)
Collaborate with Acute Pain Service about pain medication after surgery* 10 (10) –
Incentives and resources (e.g. availability of resources; information system) 100 (80) 63.6 (36.4)
Build or adapt reminder system in the EHR 80 (50) 36.4 (18.2)
Increase completeness of pain measurement data recording in the local EHR 50 (30) –
Expand order set in EHR (e.g. add pain measurement order at admission)* 40 (40) 18.2 (9.1)
Provide validated pain measurement tools (i.e. NRS, VAS, BPS, CPOT) 30 (20) –
Adapt EHR form to facilitate pain measurement recording* 10 (10) 18.2 (9.1)
Create performance monitoring tool/dashboard* 10 (0) 9.1 (0)
Nonfinancial incentives (e.g. edible treat) if targets are achieved* – 9.1 (9.1)
Keep patient-controlled analgesia (PCA) pumps in stock locally at ICU* – 9.1 (0)
Capacity for organisational change (e.g. mandate, authority, accountability) 40 (40) 27.3 (18.2)
Assign or involve a pain coordinator 40 (40) 18.2 (9.1)
Workflow redesign; increase efficiency to allow more time for measuring pain 10 (10) –
Expand pain management QI team* 10 (10) –
Monitoring and feedback on (recording of) pain measurements each shift* 10 (0) 9.1 (9.1)
Monitoring and feedback on appropriateness of prescribed pain medication 10 (0) –
Patient (e.g. patient needs; preferences) 30 (10) –
Workflow redesign; monitor/manage factors (e.g. fear) that may worsen pain 20 (0) –
Workflow redesign; measure pain on patients’indication 10 (10) –
inhibited ICUs’ improvement intentions by decreasing ICUs’Compatibilitywith the feedback, and the feedback’s Actionability.
The data collection and analysis methods were ques-tioned by some ICUs as they suspected missing pain mea-surements in the data underlying the feedback, differences in how pain was determined and mismatching shift times (Accuracy). This hampered the feedback’sCredibility and inhibited ICUs’acceptance of the feedback.
Low-performance scores on indicators (Performance level) in the dashboard facilitated ICUs’ intentions by in-creasingActionability. The breakdown of performance in a number of relevant subgroups (Number of metrics) and patient lists (Patient lists) helped ICUs to verify the feed-back by reducing Complexity and facilitated intention to improve by making it clear how to focus their actions, in-creasing Actionability. For example, subgroup analyses often showed that pain was more prevalent amongst sur-gical admissions, and pain measurements were often not performed during a patient’s first shift after admission. Also, ICUs reported that the performance charts (Trend) reduced the feedback’sComplexity by supporting the in-terpretation of the effects of actions and decisions on whether their action plan needed amending.
Recipient factors
Particularly ICUs in the feedback only group reported running out of ideas on what actions to take (Knowledge and skills in quality improvement), which reduced the Actionability and inhibited improvement intentions. Multiple of these ICUs expressed an interest in learning from best practices in high performing ICUs. Con-versely, ICUs in the feedback with toolbox group men-tioned the toolbox gave them good suggestions for improvement.
Context factors
With regard to organisational and team factors, many ICUs had one or two people responsible for implement-ing the intervention locally (Champion). They would typically review the feedback in the dashboard, discuss it with the wider team and update their action plan ac-cordingly (Teamwork). ICUs mentioned having a man-ager as an active member of the local QI team (Leadership support) as a facilitating factor. Action plan-ning processes were more efficient in ICUs that already had some QI structures in place before the intervention, including a dedicated QI team and structural meetings (Workflow fit), which increased Resource match and Compatibility. In contrast, all ICUs reported experien-cing barriers relating to other tasks, events and busy clinical practice (Competing priorities), such as the im-plementation of a new EHR. Limited resources in terms
of staff and time (Resources) led to actions being delayed or cancelled.
Factors relating to the implementation process exerted their effects through the same mechanisms of Resource match and Compatibility. ICUs noticed the positive ef-fects of their completed actions (Observability), both via the dashboard’s charts and in clinical interactions, which motivated them to continue with their action planning processes. At the same time, observability was hampered by pain measurements being performed but not re-corded in the EHR. Recording all pain measurements in the EHR was considered too resource intensive (Cost), especially if patients did not seem to be in pain. The telephone interviews (Active delivery) stimulated most ICUs to keep reviewing their feedback, reinforce actions that had stagnated, and update their action plans.
The dashboard’s structured action plan facilitated ICUs’ action planning processes (Action plan). This was particularly mentioned by ICUs in the feedback with toolbox group. Overall, the toolbox was considered to provide useful guidance for improvement: a team mem-ber would typically go through the list of suggested ac-tions and pick those that could be beneficial and feasible for their own local practice. A number of suggestions were deemed too generic, simple or inapplicable, but were often still sufficient as a starting point for ICUs to formulate actions more tailored to their local needs.
Discussion
Our study revealed that ICUs with access to an action implementation toolbox planned more actions to im-prove practice and targeted a wider range of practice do-mains than ICUs without toolbox. ICUs without toolbox tended to remain longer in earlier steps of the feedback cycle such as verifications of the feedback data and ex-plorations of possible solutions, rather than targeting ac-tual practice change. However, although ICUs with toolbox also completed more actions during the study period, this difference was not significant. The toolbox facilitated ICUs’action planning processes by increasing the actionability because it filled a knowledge gap for health professionals; ICUs in thefeedback onlygroup re-ported more difficulties in identifying what actions they could take. However, all ICUs still experienced barriers in the feedback (low controllability and accuracy) and context (competing priorities, limited time and staff re-sources and cost) that were not targeted by the toolbox or other components of the A&F intervention.
that have demonstrated that A&F recipients often find it difficult to formulate improvement actions [10, 21–23]. In several previous A&F studies in ICU settings, health professionals have experienced the A&F as insufficiently actionable [24, 25]. In our study, the toolbox increased actionability, leading to more improvement intentions. Furthermore, toolbox ICUs were able to go beyond in-creasing staff awareness and knowledge to changing existing workflows.
The lack of difference in the number of completed ac-tions may indicate that the toolbox had limited impact on the extent to which improvement intentions were translated into actual practice change (i.e. behaviour). The related organisational barriers that ICUs experi-enced have been frequently identified in other studies [26]. Since intentions to change practice are meaningless if they cannot be translated into action, more efforts are needed to facilitate health professionals in this transla-tion. Most of ICUs’ actions targeted care processes (i.e. increasing the frequency of pain measurements) rather than outcomes (i.e. reducing pain). It is a common find-ing that processes are more commonly targeted than outcomes [27], which often relates to their actionability and controllability, yet those processes may have only an indirect link to improving patient outcomes. Some of the toolbox actions to specifically improve outcomes were hardly or never selected by ICUs, such as increas-ing nurses’ autonomy to prescribe pain medication. In this setting, such actions may not have been selected due to their invasiveness, consequences for the organisa-tional context and inertia to change tradiorganisa-tional divisions of labour (that is, pain medication is prescribed by inten-sivists, whilst nurses are responsible for monitoring pain and administering the drugs) [28,29].
Implications for practice and research
Our findings imply that providing recipients of A&F in-terventions with practical suggestions for improvement actions is a promising approach to increasing the effect-iveness of A&F by making it more actionable. Feedback actionability is known to substantially contribute to the success of interventions [30,31], but has proven difficult to operationalise in practice [4,6,24,25]. We found that presenting suggested actions for improvement in a tool-box integrated within an electronic, structured action plan is a feasible and potentially less resource-intensive alternative to, for example, educational outreach visits [32]. Some of the remaining barriers to the action plan-ning we identified (e.g. controllability) could be over-come by improving the toolbox contents, whereas others (particularly those relating to the organisational context) may require other co-interventions.
ICUs selected a wide variety of toolbox actions and added a range of self-defined actions that did not match
any of the pre-defined toolbox actions. This confirms that different A&F recipients may have different quality im-provement needs [33]. We recommend that in the future A&F interventions with action toolbox should, similar to the toolbox in this study, enable recipients to further tailor the toolbox to local context by adding self-defined actions and hide toolbox actions or amend their description in order to tailor the toolbox to their local context.
We derived the toolbox content from guidelines, litera-ture and expert opinion [11, 12]. Although participants considered this useful, they expressed an additional inter-est in binter-est practices from high performers. Future A&F studies could therefore consider adding “best practice-based” actions to complement toolbox actions derived from other sources and dynamically update the toolbox by further refining actions with low completion rates.
Strengths and limitations
Our study has several strengths. Whereas the head-to-head RCT had previously demonstratedthatthe toolbox was effective in improving ICU pain management [13], the current study helped us understand the underlying mechanisms forhowit was effective. This contributes to expanding our knowledge about how action planning in A&F interventions can be facilitated [7]. The electronic nature of our A&F intervention enabled us to study mechanisms in detail and unobtrusively, whilst including all participants [34,35]. Usage data that are a by-product of using digital A&F interventions in real-world settings is largely underutilised; they also informed the telephone interviews. This created a synergistic mixed-methods ap-proach in which quantitative and qualitative comple-mented as well as strengthened each other [36].
Conclusion
An action implementation toolbox containing suggested actions for practice change increases the actionability of A&F interventions, prompting recipients to initiate more changes and across a wider range of practice determi-nants. The toolbox helped health professionals to broaden their mindset about actions they could take to improve practice. Without the toolbox, professionals tended to focus more on feedback verification and ex-ploring solutions without developing intentions for ac-tual change. All feedback recipients experienced barriers that inhibited completion of actions. Whereas some of those barriers may be overcome when appropriately ad-dressed by a toolbox, other barriers, often relating to the organisational context, will require co-interventions.
Additional file
Additional file 1:Standards for Reporting Implementation Studies: the
StaRI checklist for completion. (DOCX 78 kb)
Abbreviations
A&F:Audit and feedback; cRCT: Cluster-randomised controlled trial; ICU: Intensive care unit; IQR: Interquartile range; NICE: National Intensive Care Evaluation foundation; SD: Standard deviation
Acknowledgements
The authors would like to thank our software engineers Richard Minne, Eric van der Zwan and Winston Tjon Sjoe Sjoe for their work in developing the NICE dashboard.
Authors’contributions
WG, MRB, SvdV, DD, EdJ, NP and NdK contributed to the study conception and participated in critically appraising and revising the intellectual content of the manuscript. WG and MRB were primarily responsible for the data collection and analysis and the manuscript draft. All authors read and approved the final manuscript.
Funding
This study was funded by the National Intensive Care Evaluation (NICE) foundation’s own resources. SvdV is supported by the Health e-Research Centre (MRC research grant no. MR/K006665/1).
Availability of data and materials
The datasets used and/or analysed during the current study are available from the corresponding author on reasonable request.
Ethics approval and consent to participate
The Institutional Review Board (IRB) of the Academic Medical Center (Amsterdam, The Netherlands) informed us that formal IRB approval and patient consent were not deemed necessary because to the focus of intervention on improving organisational processes; individual patients will not be directly involved (IRB reference number: W16_271). Additionally, in the Netherlands, there is no need to obtain consent to use data from registries that do not contain patient-identifying information, as is the case in the NICE registry. The NICE foundation is officially registered according to the Dutch Personal Data Protection Act.
Consent for publication Not applicable.
Competing interests
The authors declare that they have no competing interests.
Author details
1Department of Medical Informatics, Amsterdam UMC, Amsterdam Public
Health Research Institute, University of Amsterdam, Amsterdam, The Netherlands.2Department of Intensive Care Medicine, Amsterdam UMC, University of Amsterdam, Amsterdam, The Netherlands.3National Intensive
Care Evaluation (NICE) Foundation, Amsterdam, The Netherlands.4Centre for
Health Informatics, Division of Informatics, Imaging and Data Sciences, Faculty of Biology, Medicine and Health, Manchester Academic Health Science Centre, The University of Manchester, Manchester, UK.5Department
of Intensive Care Medicine, Leiden University Medical Center, Leiden, The Netherlands.6NIHR Greater Manchester Primary Care Patient Safety
Translational Research Centre, Manchester Academic Health Science Centre, The University of Manchester, Manchester, UK.
Received: 1 June 2019 Accepted: 27 August 2019
References
1. Ivers N, Jamtvedt G, Flottorp S, Young JM, Odgaard-Jensen J, French SD, et al. Audit and feedback: effects on professional practice and healthcare outcomes. Cochrane Database Syst Rev. 2012;6:CD000259.https://doi.org/ 10.1002/14651858.CD000259.pub3.
2. No authors listed. Medical audit in general practice. I: Effects on doctors’clinical behaviour for common childhood conditions. North of England Study of Standards and Performance in General Practice. BMJ 1992;304:1480–1484.
3. Gardner B, Whittington C, McAteer J, Eccles MP, Michie S. Using theory to synthesise evidence from behaviour change interventions: the example of audit and feedback. Soc Sci Med. 2010;70:1618–25.https://doi.org/10.1016/j. socscimed.2010.01.039.
4. Ivers NM, Tu K, Young J, Francis JJ, Barnsley J, Shah BR, et al. Feedback GAP: pragmatic, cluster-randomized trial of goal setting and action plans to increase the effectiveness of audit and feedback interventions in primary care. Implement Sci. 2013;8:142.https://doi.org/10.1186/1748-5908-8-142. 5. Ivers NM, Grimshaw JM, Jamtvedt G, Flottorp S, O’Brien MA, French SD,
et al. Growing literature, stagnant science? Systematic review, meta-regression and cumulative analysis of audit and feedback interventions in health care. J Gen Intern Med. 2014;29:1534–41.https:// doi.org/10.1007/s11606-014-2913-y.
6. Gude WT, van Engen-Verheul MM, van der Veer SN, Kemps HMC, Jaspers MWM, de Keizer NF, et al. Effect of a web-based audit and feedback intervention with outreach visits on the clinical performance of multidisciplinary teams: a cluster-randomized trial in cardiac rehabilitation. Implement Sci. 2016;11:160.https://doi.org/10.1186/s13012-016-0516-1. 7. Ivers NM, Sales A, Colquhoun H, Michie S, Foy R, Francis JJ, et al. No more
“business as usual”with audit and feedback interventions: towards an agenda for a reinvigorated intervention. Implement Sci. 2014;9:14.https:// doi.org/10.1186/1748-5908-9-14.
8. Ivers NM, Grimshaw JM. Reducing research waste with implementation laboratories. Lancet (London, England). 2016;388:547–8.https://doi.org/10. 1016/S0140-6736(16)31256-9.
9. Colquhoun HL, Carroll K, Eva KW, Grimshaw JM, Ivers N, Michie S, et al. Advancing the literature on designing audit and feedback interventions: identifying theory-informed hypotheses. Implement Sci. 2017;12:117.https:// doi.org/10.1186/s13012-017-0646-0.
10. Ivers N, Barnsley J, Upshur R, Tu K, Shah B, Grimshaw J, et al. My approach to this job is. One person at a time: perceived discordance between population-level quality targets and patient-Centred care. Can Fam Physician. 2014;60:258–66.
11. Gude WT, Roos-Blom MJ, van der Veer SN, de Jonge E, Peek N, Dongelmans DA, et al. Electronic audit and feedback intervention with action
implementation toolbox to improve pain management in intensive care: protocol for a laboratory experiment and cluster randomised trial. Implement Sci. 2017;12:68.https://doi.org/10.1186/s13012-017-0594-8. 12. Roos-Blom M-J, Gude WT, Spijkstra JJ, de Jonge E, Dongelmans D, de Keizer
NF. Measuring quality indicators to improve pain management in critically ill patients. J Crit Care. 2018;49:136–42.https://doi.org/10.1016/j.jcrc.2018.10.027. 13. Roos-Blom MJ, Gude WT, de Jonge E, Spijkstra JJ, van der Veer SN, Peek N,
cluster-randomised controlled trial. BMJ Qual Saf. 2019. https://doi.org/10.1136/bmjqs-2019-009588. PMID: 31263017.
14. Carver CS, Scheier MF. Control theory: a useful conceptual framework for personality-social, clinical, and health psychology. Psychol Bull. 1982; 92:111–35.https://doi.org/10.1037/0033-2909.92.1.111.
15. Brehaut JC, Colquhoun HL, Eva KW, Carroll K, Sales A, Michie S, et al. Practice feedback interventions: 15 suggestions for optimizing effectiveness. Ann Intern Med. 2016;164:435–41.https://doi.org/10.7326/M15-2248. 16. Gude WT, Van Engen-Verheul MM, Van Der Veer SN, De Keizer NF, Peek
N. How does audit and feedback influence intentions of health professionals to improve practice? A laboratory experiment and field study in cardiac rehabilitation. BMJ Qual Saf. 2017;26:279–87.https://doi. org/10.1136/bmjqs-2015-004795.
17. van de Klundert N, Holman R, Dongelmans DA, de Keizer NF. Data resource profile: the Dutch National Intensive Care Evaluation (NICE) registry of admissions to adult intensive care units. Int J Epidemiol. 2015;44:1850–1850h.https://doi.org/10.1093/ije/dyv291.
18. Brown B, Gude WT, Blakeman T, van der Veer SN, Ivers N, Francis JJ, et al. Clinical Performance Feedback Intervention Theory (CP-FIT): a new theory for designing, implementing, and evaluating feedback in health care based on a systematic review and meta-synthesis of qualitative research. Implement Sci. 2019;14:40.https://doi.org/10.1186/s13012-019-0883-5. 19. Birt L, Scott S, Cavers D, Campbell C, Walter F. Member checking: a tool to
enhance trustworthiness or merely a nod to validation? Qual Health Res. 2016;26:1802–11.https://doi.org/10.1177/1049732316654870.
20. Flottorp SA, Oxman AD, Krause J, Musila NR, Wensing M, Godycki-Cwirko M, et al. A checklist for identifying determinants of practice: a systematic review and synthesis of frameworks and taxonomies of factors that prevent or enable improvements in healthcare professional practice. Implement Sci. 2013;8:35.https://doi.org/10.1186/1748-5908-8-35.
21. Morrell C, Harvey G, Kitson A. Practitioner based quality improvement: a review of the Royal College of Nursing’s dynamic standard setting system. Qual Health Care. 1997;6:29–34.
22. Grant AM, Guthrie B, Dreischulte T. Developing a complex intervention to improve prescribing safety in primary care: mixed methods feasibility and optimisation pilot study. BMJ Open. 2014;4:e004153.https://doi.org/10.1136/ bmjopen-2013-004153.
23. Tierney S, Kislov R, Deaton C. A qualitative study of a primary-care based intervention to improve the management of patients with heart failure: the dynamic relationship between facilitation and context. BMC Fam Pract. 2014;15:153.https://doi.org/10.1186/1471-2296-15-153.
24. Sinuff T, Muscedere J, Rozmovits L, Dale CM, Scales DC. A qualitative study of the variable effects of audit and feedback in the ICU. BMJ Qual Saf. 2015; 24:393–9.https://doi.org/10.1136/bmjqs-2015-003978.
25. De Vos MLG, Van Der Veer SN, Graafmans WC, De Keizer NF, Jager KJ, Westert GP, et al. Process evaluation of a tailored multifaceted feedback program to improve the quality of intensive care by using quality indicators. BMJ Qual Saf. 2013;22:233–41.https://doi.org/10.1136/bmjqs-2012-001375. 26. Cabana MD, Rand CS, Powe NR, Wu AW, Wilson MH, Abboud P-AC, et al.
Why don’t physicians follow clinical practice guidelines? J Am Med Assoc. 1999;282:1458.https://doi.org/10.1001/jama.282.15.1458.
27. Lilford R, Mohammed MA, Spiegelhalter D, Thomson R. Use and misuse of process and outcome data in managing performance of acute medical care: avoiding institutional stigma. Lancet. 2004;363:1147–54.https://doi.org/ 10.1016/S0140-6736(04)15901-1.
28. Guidet B, González-Romá V. Climate and cultural aspects in intensive care units. Crit Care. 2011;15:312.https://doi.org/10.1186/cc10361.
29. van der Sluijs AF, van Slobbe-Bijlsma ER, Chick SE, Vroom MB, Dongelmans DA, Vlaar APJ. The impact of changes in intensive care organization on patient outcome and cost-effectiveness—a narrative review. J Intensive Care. 2017;5:13.https://doi.org/10.1186/s40560-016-0207-7.
30. Hysong SJ, Best RG, Pugh JA. Audit and feedback and clinical practice guideline adherence: making feedback actionable. Implement Sci. 2006;1:9. https://doi.org/10.1186/1748-5908-1-9.
31. Hysong SJ. Meta-analysis: audit and feedback features impact effectiveness on care quality. Med Care. 2009;47:356–63.https://doi.org/10.1097/MLR. 0b013e3181893f6b.
32. O'Brien MA, Rogers S, Jamtvedt G, Oxman AD, Odgaard-Jensen J, Kristoffersen DT, Forsetlund L, Bainbridge D, Freemantle N, Davis DA, Haynes RB, Harvey EL. Educational outreach visits: effects on professional
practice and health care outcomes. Cochrane Database Syst Rev. 2007;(4): CD000409.https://www.ncbi.nlm.nih.gov/pubmed/17943742.
33. Reszel J, Dunn SI, Sprague AE, Graham ID, Grimshaw JM, Peterson WE, et al. Use of a maternal newborn audit and feedback system in Ontario: a collective case study. BMJ Qual Saf. 2019.https://doi.org/10. 1136/bmjqs-2018-008354.
34. Gude WT, van der Veer SN, de Keizer NF, Coiera E, Peek N. Optimizing digital health informatics interventions through unobtrusive quantitative process evaluations. Stud Health Technol Inform. 2016;228:594–8. 35. Scott PJ, Rigby M, Ammenwerth E, McNair JB, Georgiou A, Hyppönen H, et
al. Evaluation considerations for secondary uses of clinical data: principles for an evidence-based approach to policy and implementation of secondary analysis. Yearb Med Inform. 2017;26:59–67.https://doi.org/10. 15265/IY-2017-010.
36. Grant A, Treweek S, Dreischulte T, Foy R, Guthrie B. Process evaluations for cluster-randomised trials of complex interventions: a proposed framework for design and reporting. Trials. 2013;14:15.https://doi.org/10. 1186/1745-6215-14-15.
Publisher’s Note
![Fig. 2 Key findings from the qualitative analysis of the telephone interviews explained by Clinical Performance Feedback Intervention Theory [18].The identified factors had facilitating (green), inhibiting (red) or mixed (orange) impact on specific process](https://thumb-us.123doks.com/thumbv2/123dok_us/626856.1558542/4.595.57.543.87.435/qualitative-telephone-interviews-performance-intervention-identified-facilitating-inhibiting.webp)