Baghdad Science Journal
Vol.15(1)2018
DOI:
http://dx.doi.org/10.21123/bsj.2018.15.1.0087
Using Texture Analysis Image Processing Technique to
Study the Effect of Microwave Plasma on the Living Tissue
Alyaa H.Ali
1*Hazim al-Ahmed
2Sabah N.Mazhir
3Aiyah S.Noori
4Received 28/11/2017
Accepted 8/1/2018
This work is licensed under a Creative Commons Attribution 4.0 International License.
Abstract:
The present study is a hybrid method of studying the effect of plasma on the living tissue by using the image processing technique. This research explains the effect of microwave plasma on the DNA cell using the comet score application, texture analysis image processing and the effect of microwave plasma on the liver using texture analysis image processing. The study was applied on the mice cells. The exposure to the plasma is done by dividing the mice for four groups, each group includes four mice (control group, 20, 50, 90 second exposure to microwave plasma). The exposure to microwave plasma was done with voltage 175v and gas flow on 2 with room temperature; the statistical features are obtained from the comet score images and the textural features are calculated from the texture matrix energy measure. The result shows that the plasma has a clear effect on the DNA by reaper the damage cell and affecting the liver enzyme. The microwave plasma affected the ALP (Alkaline phosphatase) enzyme Alanine amino Transferase (ALT), Aspartate amino Transferase (AST) by decreasing their value with time exposure. This has been analyzed and studier by the textural analysis.
Keywords: Microwave plasma, Comet score application, Textural analysis, Energy matrix.
Introduction:
The new techniques of using digital image processing and microwave plasma in the medical application is considered in this research. The microwave plasma is classified as cold plasma that has a medical effect in accelerating the wound healing and affecting the damage DNA.
The term ‘plasma’ itself has a strong effect in medicine, It can effectively produce in laboratory settings and in industrial or hospital operations, cauterization and tissue ablation during surgeries in medical settings. A microwave plasma is a type of plasma that has high frequency electromagnetic radiation in the GHz range. The Argon plasma also is used in medical practice as a source of gaseous nitric oxide. The result of using argon plasma on animals showing that there is no side effect on the tissue and there is no respiratory problem and not finding any acute or chronic inflammatory (1,2,3).The non-thermal Atmospheric microwave induced plasma. MIP have been recognized as new tools in the biomedicine. MIP have proved their effectiveness to be used in bio-medical applications. 1, 3, 4 Department of Physics, College of Science for Women, University of Baghdad, Iraq.
2
Biotechnology Research Center, Al-Nahrain University, Iraq.
*Corresponding author: [email protected]
Comet assay mechanisms which are micro electrophoresis study of DNA damage in individual cells were first described by Ostling and Johanson, (1984). This single cell gel electrophoresis technique has been modified and extensively validated over the years, and is now commonly referred to as the comet assay(4). DNA contains phosphate groups that are negatively charged at alkaline pH, and so relaxed loops of damaged DNA containing breaks that are pulled towards the anode during electrophoresis, forming a comet ‘tail’, while the DNA remaining coiled within the nucleoid forms the comet ‘head’. The comet is visualized by a DNA staining fluorescent dye. The most frequently used stains are ethidiumbromide. DNA damage is then scored using either visual or
computerized image analysis "image
processing"(5). The Liver function test (LFT) has performed different types of biochemical, Alanine
amino transferase (ALT), Aspartate amino
are used for each of liver for the (control, 20 second, 50 second, and 90 second).
Texture Matrix Energy Measures presented the statistical feature for the texture with the threshold value for each image; the mean value presented the intensity of the image, and the high value means the image is bright if it is low means that the image is dark. The entropy gives indication about the number of gray level value in the image. It gives
information about the randomness of the
distribution of gray level pixel. When the entropy is high, the number of gray level is high. The energy is inversely proportional to the entropy it decreases as the number of gray level in the image increases.
Microwave Plasma Generation:
Microwave discharge recently appeared in wide range of application in medicine and industry. It can generate non-thermal plasma or non-equilibrium
plasma usually with pressure 10-5 torr up to
atmospheric pressure in the pulse wave and continues wave with power ranging between several watts and hundreds of kilowatt. Microwave electrical discharge is generated by electromagnetic waves with frequencies above 300 MHz and with wavelength ranging between millimeters and several tens of centimeters (λ cm = 30/f GHz). The suitable frequency for the medical application of plasma is 2.45 GHz(7,8).
Comet Assay:
The test of comet assay fragmentation depends on the length tail. The small DNA fragments of
damaged cells migrate faster than undamaged cells. The proportion of DNA in this fast-moving “comet tail” is an indication of DNA damage. An advantage of the method is that it only requires a small number of cells in each experiment. DNA damage, as both single and double-strand breaks, is assessed at the level of individual cells(7).
Comet score acquire comet metrics from image data. The application requires windows bitmap image, and all comet are oriented as tail on the left and head on the right. Comet is defined as all adjacent pixel location in the denominate shape after image segmentation processing, where each pixel are corresponding to the amount of DNA at that location(5).
Texture Matrix Energy Measures
Image texture has a number of important characteristics in describing texture (9). Law's identified the following properties as playing an important role in describing texture: uniformity, density, coarseness, roughness, regularity, linearity, directionality, direction, frequency, and phase. Laws texture energy measures method determine texture properties through rate calculation, gray Level, Edges, Spots, Ripples and Waves in texture (9). By convoluting the Law’s matrix with Texture image and calculating energy statistics, the following matrix describe the level, edge, spots, ripples and waves. The modified matrix which is the average value of these five matrix produce anew matrix convolved with the texture image of liver (9).
𝐿𝑒𝑣𝑒𝑙
[
1 4 6 4 1 4 16 24 16 4 6 24 36 24 6 4 16 24 16 4 1 4 6 4 1 ]
Edge
[
1 2 0 − 2 − 1 2 4 0 − 2 − 1 0 0 0 0 0 −2 − 4 0 4 2
−1 − 2 0 2 1 ]
Spot
[
1 0 − 2 0 − 1 0 0 0 0 0
−2 0 4 0 2 0 0 0 0 0 −1 0 2 0 1 ]
Ripple
[
1 − 4 6 − 4 1 −4 16 − 24 16 − 4 6 − 24 36 − 24 6 −4 16 − 24 16 − 4 1 − 4 6 − 24 1 ]
Wave
[
1 − 2 0 2 1 −2 4 0 − 4 − 2 0 0 0 0 0 2 − 4 0 4 2 1 − 2 0 2 1]
Modified AverageMatirix
[
1 0 2 0 0.2 0 8 0 5.2 − 0.6 2 0 15.2 0 2.8 0 4.8 0 8 0.8 0.2 − 0.8 2.8 − 3.2 1 ]
After a series of particular convolution with texture images, the outputs are passed to texture features. The operation will lead to the creation of three images corresponding to each statistical descriptor. After the windowing operation, all the obtained images are normalized in order to present an image. Subsequently, for each normalized image compute three statistical features; absolute mean (ABSM), mean square or energy (MS) and entropy as follows(10):
ABSM= 𝑀𝑁1 ∑𝑀𝑥=1∑𝑁𝑦=1|𝑓(𝑥. 𝑦)|… … … (1)
MS= 𝑀𝑁1 ∑𝑀𝑥=1∑𝑁𝑦=1𝑓2(𝑥. 𝑦)… … … . (2)
Entropy= 1
𝑀𝑁∑ ∑ 𝑓(𝑥. 𝑦)(− 𝑙𝑜𝑔2𝑓(𝑥. 𝑦)).
𝑁 𝑦=1 𝑀
𝑥=1 … . (3)
Where f (x, y) is the pixel value, and M and N are
image dimensions (10).
which are affected by the plasma. Threshold is one of the simplest image segmentation techniques. It was selected according to the purpose for which it was applied. If one particular image with dark background and light objects, the threshold is selected to get the objects in the background because it separates the foreground objects and background(11).
Segmentation is done by adaptive
thresholding(12,13).
The operation of gray value is defined by(12).
𝑔(𝑣) = {0 𝑖𝑓𝑣 < 𝑡1 𝑖𝑓𝑣 ≥ 𝑡 ... (4)
ʋ: represented the gray value. t: represented the threshold value.
When the point 𝑣 ≥ 𝑡 is called an object point
.When the point 𝑣 < 𝑡 is called the
backgroundpoint(14).
Thresholding transforms the gray value image to ordinary image. Image has been segmented into two
segments after the thresholding operation.
Represented by pixel value (0) and (1), respectively(15). The liver of the mice are affected by the time exposure to the plasma; this has been studied by the texture analysis of the images.
Methodology
Microwave plasma system with argon gas is used to expose four groups of mice from male gender and age ranging between (65 to 110) days. They were collected from Ministry of Health / Medical Control Iraqi Center, these groups are (control, 20 second, 50 second, 90 second exposure) every group includes four mice. The exposure to microwave plasma has been done with voltage (175v) and gas flow on (2 L/min) and frequency (2.45 GHz) with room temperature. The hair of mice has been removed from back space and selected the area of exposure by circling it and fixing the mouse about 1cm from the beam. After this, the mouse was left for two hours and then blood was extracted for comet assay, liver function test and the texture analysis (image processing) for the liver and the DNA cell is studied .
Experimental part:
The comet assay is used in order to determining the damage in the DNA cells. Comet assay kit is used to perform this test. The feature which can be obtained from the comet score are:
1-Tail Length: is determined as the comet head diameter diminished from the overall comet length equation(5) is obtained from Comet assay kit .
𝐿𝑡= 𝐿𝑐− 𝐿ℎ…... (5)
𝐿𝑡 : Tail length (px), 𝐿𝑐 : Comet length (px),
𝐿ℎ : Head length (px).
2-Percentage of DNA in Tail : The "DNA percentage" in the tail of the comet can be obtained when "total comet tail intensity divided by the total comet intensity, multiplied by 100". Equation(6) is obtained from Comet assay kit.
%𝐷𝑁𝐴 𝑖𝑛 𝑡𝑎𝑖𝑙 = 100 × 𝐼𝑡
𝐼𝑐……... (6)
%𝐷𝑁𝐴 𝑖𝑛 𝑡𝑎𝑖𝑙 : Percentage of DNA in the tail.
𝐼𝑡 : Tail intensity.
𝐼𝑐 : Total comet Intensity.
3-Tail Moment: is determined as the percentage of "DNA in the comet tail multiplied by the tail length", equation(7) is obtained from Comet assay kit. .
𝑀𝑡= %𝐷𝑁𝐴𝑡 × 𝐿𝑡…... (7)
𝑀𝑡 : Tail Moment.
4-Tail mean Intensity: The mean comet tail intensity is the average of all pixel intensity values in the comet tail. Equation (8) is obtained from Comet assay kit.
𝜇𝑖 = 𝐴𝐼𝑡
𝑡 ... (8)
𝜇𝑖: Tail mean intensity.
𝐼𝑡 : Tail intensity.
𝐴𝑡 : Area of the comet.
Table (1) shows the statistical features which are calculated from comet image using comet score application.
The liver function test:
Blood extracted from groups (control, 20 second, 50 second, and 90 second); every group include four mice. Blood was centrifuge in gel tube at 4000 rpm to separate the serum. Serum of mice is used as a test sample.
The Liver function tests (LFT) are useful screening tool, they are very effective modality to find hepaticdys function.
Alanine amino Transferase (ALT):
Alanine amino transferees can be found in muscle, kidney, heart, and the large concentration is found in liver much than other tissues of the body."ALT" is purely cytoplasmic catalyzing the transamination reaction. Any type of cell injury in liver can cause increases in ALT levels, the ALT is also called SGPT (Serum Glutamic Pyruvic Transaminase) (6).
Laboratory procedure:
1-The kit includes working reagent, mix 1000 μl
from working reagent in an eppendrof with 100μL from the sample and loading 250 μL in a well plate. The procedure is repeat for every sample (16 samples).
3-Measuring the change in absorbance per minute (OD/min) during 3 minutes in the ELISA device. The result is determined according to equation (9) from the SGPT kit. And the result show in Table (2).
SGPT activity (U/L) = (OD/min) x 1745…... (9) U/L: unit per liter.
OD: is the optical density which is the amount of attenuation or gradual intensity loss. It depends on the thickness of the sample.
1745: number related to the SGPT activity equation.
Aspartate amino Transferase (AST):
Aspartate amino transferase exist two different isoenzyme forms which are genetically distinct, the mitochondrial and cytoplasmic form. AST highest concentration is found in heart compared with the other tissues of the body such as liver, skeletal muscle and kidney, the AST are also called SGOT (Serum Glutamic OxaloaceticTransminase.
Laboratory procedure
:
The Laboratory procedure for the AST is the same as for ALT in preparing the sample. The result is determined according to equation (10) obtained from the SGPT kit. The result is shown in Table (2). SGOT activity (U/L) = (OD/min) x 1745…... (10) U/L: unit per liter.
OD: is the optical density which is the amount of attenuation or gradual intensity loss. It depends on the thickness of the sample.
1745: number related to the SGOT activity equation.
Alkaline phosphatase (ALP):
ALP is found in mucosal epithelia of small intestine, proximal convoluted tubule of kidney, liver and placenta, bone. It performs lipid transportation in the intestine and calcification in bone. The serum ALP activity is basically from the liver with 50% contributed by bone.
Laboratory procedure
:
The Laboratory procedure for the AST is the same as for ALT in preparing the sample. The result is determined according to equation (11) obtained from the ALP kit. As listed in Table (2).
ALP Activity (U/L) = (OD / min.) x 2750 ....…(11) U/L: unit per liter.
OD: is the optical density which is the amount of attenuation or gradual intensity
Loss. It is depends on the thickness of the sample. 2750: number related to the ALP activity equation.
Result and Discussion
:
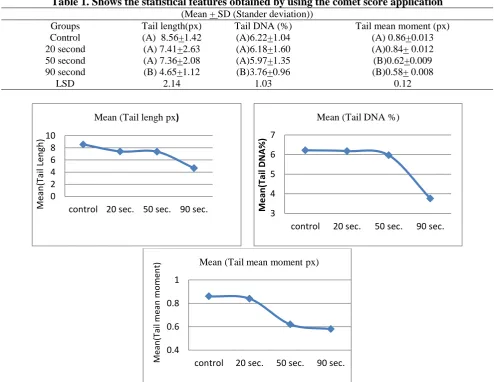
Fig. (1) shows the plot graph for the mean (tail length, tail DNA%, tail mean moment), all the statistical values show decreasing in the value as increasing the time exposure and this gives good indication about the response of a damage DNA cells to the plasma. The way of quantification by using image analysis is comet score application The analysis calculates different parameters for each comet, three parameters are estimated to indicate DNA migration, tail length (distance from the head center to the end of the tail), mean tail moment (product of tail DNA/total DNA by the tail center of
gravity) and tail DNA%=100X tail DNA
intensity/Cell DNA Intensity.
The results in Table (1) show that in the case of tail length and percentage tail DNA %, there are small-significant changes between (control, 20 second, 50 second) group but there is significant changes in 90 second group where it gives the lowest value of tail length and percentage tail DNA. In the case of tail mean moment, there are significant changes between (control, 20 second) group and (50 second, 90 second) group.
Fig. (2) shows a high damage in DNA cell for the control case in the microscope, the long tail refers to the damage in DNA. This figure shows clearly the damage as a long tail.
Fig. (3) is the comet assay for the medium damage, as the cell is exposed to 20 second plasma; the damage in DNA cell become less. It can be described by medium damage as shown in fluorescent microscope. It is clearly seen that the tail of the comet decrease as in the control case and this can be seen in Table (1). Fig. (4) which shows the low damage in the cell, from the figure the damage in the DNA cell that is less than the control case and 20 second exposing to plasma (i-e) the DNA cell was affected by being exposing to 50 second plasma this can clearly appear in Fig. (4). Fig. (5) shows the comet assay for no damage, the cells are exposed to 90 second microwave plasma. As seen in Figs. (2, 3, 4, 5), the effect of plasma can clearly seen in reappearing the DNA cell (the damage cell) by exposing it to the microwave plasma. The results in Table (2) shows that there is a significant change in the ALT, AST, ALP test in (control, 20 second) group as compared with (50, 90) second group. The ALT, AST and ALP values decrease with increasing the time of exposure to microwave plasma.
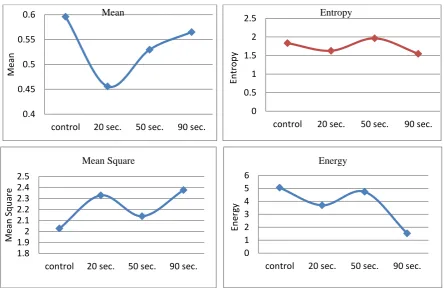
at 90 second and this time for exposure decreasing the ALP with increasing the time. Table (7) represents the average values of statistical features for Law’s energy matrix in (control, 20,50 and 90 second) exposure to plasma in liver case. Fig. (11) represented the average of statistical features obtained from Law’s energy matrix, for the mean curve shows that the 20 second is the lowest value (i-e) the liver texture shows response to the effect of exposure the texture to microwave plasma. The mean
square curve indicated that the 20 second is the highest point of response and the lowest value is in the control, while the energy curve has the lowest value for the 90 second and highest value for the control case. The energy of liver texture decrease with plasma. The liver texture shows disarrangement in its texture for the first time exposure to plasma, then the texture arranged itself, this explain the different value in curves.
Table 1. Shows the statistical features obtained by using the comet score application (Mean + SD (Stander deviation))
Tail mean moment (px) Tail DNA (%)
Tail length(px) Groups
(A) 0.86+0.013 (A)6.22+1.04
(A) 8.56+1.42 Control
(A)0.84+ 0.012 (A)6.18+1.60
(A) 7.41+2.63 20 second
(B)0.62+0.009 (A)5.97+1.35
(A) 7.36+2.08 50 second
(B)0.58+ 0.008 (B)3.76+0.96
(B) 4.65+1.12 90 second
0.12 1.03
2.14 LSD
Figure 1. Shows the mean (tail length, tail DNA%, tail mean moment)
The comet assay for high damage in cells at control case imaging in
Flourecent microscope.
The comet assay for high damage in cells in control case imaging in comet
score application.
The comet assay for high damage in cells in control case detamining the
metrics of cell. Figure 2. Shows the comet assay images for the control case.
0 2 4 6 8 10
control 20 sec. 50 sec. 90 sec.
Me
an
(T
ail
Lengh
)
Mean (Tail lengh px)
3 4 5 6 7
control 20 sec. 50 sec. 90 sec.
M
e
an
(Tai
l D
N
A
%
)
Mean (Tail DNA %)
0.4 0.6 0.8 1
control 20 sec. 50 sec. 90 sec.
M
ean
(T
ail
me
an
mo
me
n
The comet assay for medium damage in cells in 20 second exsposuring for
microwave plasma imaging in Flourecent microscope.
The comet assay for medium damage in cells at 20 second exsposuring for microwave plasma imaging in comet
score application.
The comet assay for medium damage in cells at 20 second exsposuring for
microwave plasma detamining the metrics of cell.
Figure 3. Shows the comet assay images for the 20 second exsposuring to microwave plasma case.
The comet assay for low damage in cells at50 second exsposuring for
microwave plasma imaging in Flourecent microscope.
The comet assay for low damage in cells at50 second exsposuring for microwave plasma imaging in comet
score application.
The comet assay for low damage in cells at50 second exsposuring for microwave plasma detamining the
metrics of cell.
Figure 4. Shows the comet assay images for the 50 second exsposuring to microwave plasma case.
The comet assay for no damage in cells at90 second exsposuring for microwave plasma case imaging in
Flourecent microscope.
The comet assay for no damage in cells at 90 second exsposuring for microwave plasma caseimaging in
comet score application.
The comet assay for no damage in cells at90 second exsposuring for microwave plasma case detamining
the metrics of cell.
Figure 5. Shows the comet assay for no damage, the cells are exposure to 90 second microwave plasma.
Table 2. Shows statistics value for (ALT,AST,ALP).
(Mean+SD(Stander deviation))
Group ALT (U/L) AST (U/L) ALP(U/L)
Control (A)40.839 +3.867 (A)32.792+4.086 (A)209.50+17.81 20 Second (A)41.282 +3.341 (A)33.094 +4.080 (A)213.20 +13.75 50 Second (B)32.490 +2.127 (B)24.745+2.040 (B)188.85+32.85 90 Second (B)29.141 +2.110 (B)23.645+2.034 (B)185.65+43.71
Figure 6. Show statistic value for (ALT, AST, ALP).
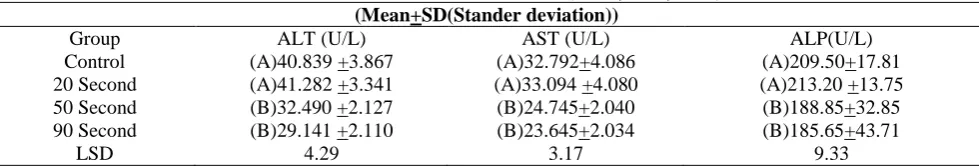
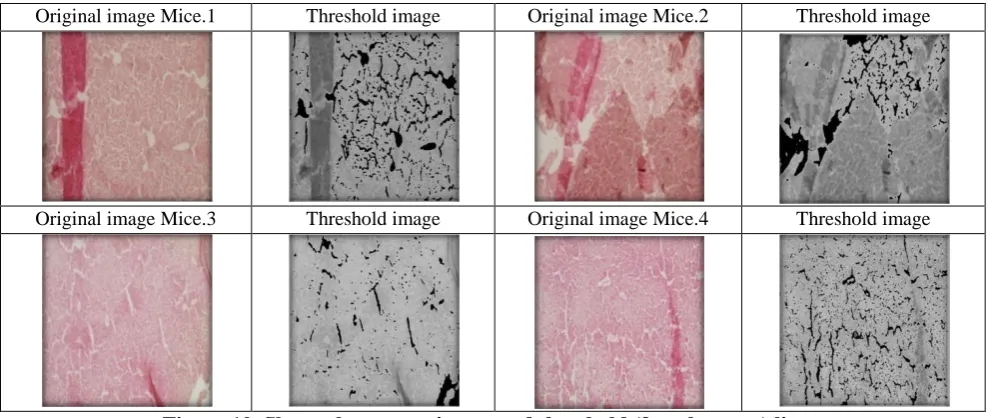
1. Control group (Liver): The control group includes 4 mice used with out any exposure to microwave plasma. Fig. (7) shows the liver texture for the control group with the threshold image, the threshold is used to extract the texture from the rest image since the image contains the glass of slide and other noise which makes the result incorrect.
The region of interest takes the gray value and the rest image is black. Table (3) listed the statistical features using Law’s matrix, the features are mean, entropy, mean square and energy for the control group in liver case the texture images are taken from the microscope with 10X magnification.
Original image Mice.1 Threshold image Original image Mice.2 Threshold image
Original image Mice.3 Threshold image Original image Mice.4 Threshold image
Figure 7. Shows the texture image and threshold (control group) liver.
Table 3. The statistical feature of Law’s matrix to control group (liver case).
No. of Mice Threshold value Mean Entropy Mean square Energy
1 T=200 0.5905 1.8079 2.1011 1.1572
2 T=190 0.5556 1.6502 2.3395 1.4348
3 T=200 0.6246 1.9324 1.8477 8.9500
4 T=200 0.6131 1.9439 1.8179 8.6636
Average 0.59595 1.8336 2.02655 5.0514
28 33 38
control 20 sec. 50 sec. 90 sec.
M
ean
ALT
(U/
L)
Mean ALT (U/L)
20 25 30 35
control 20 sec. 50 sec. 90 sec.
Me
an
AST
(U
/L)
Mean AST (U/L)
180 190 200 210
control 20 sec. 50 sec. 90 sec.
M
e
an
A
LP
(U/L)
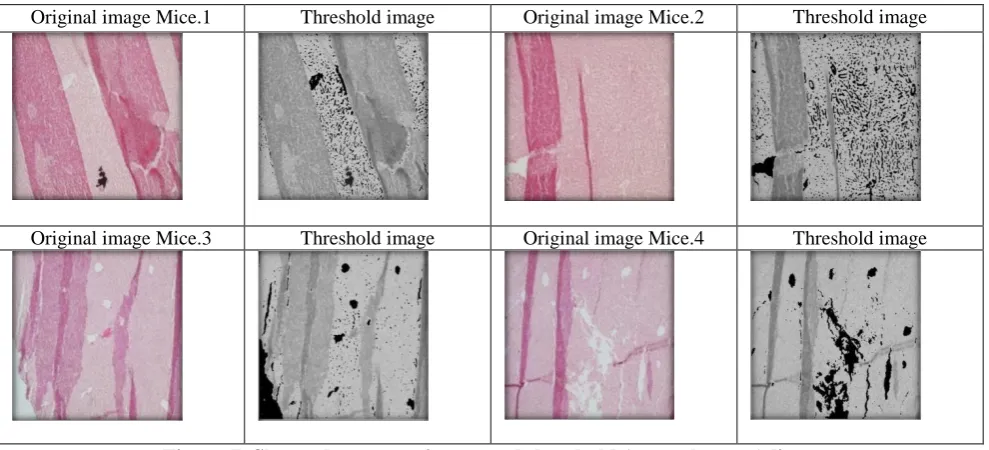
2. The second group (Liver): The mice exposuring to microwave plasma for 20 second. Fig. (8) represented the second group which is the
liver exposure to 20 second. Table (4) lists the statistical features using Law’s mask, the features are mean, entropy, mean square and energy.
Original image Mice.1 Threshold image Original image Mice.2 Threshold image
Original image Mice.3 Threshold image Original image Mice.4 Threshold image
Figure 8.Shows the texture image and threshold (second group) liver.
Table 4.The statistical feature of Law’s matrix for Second group with 20 second exposuring for microwave plasma (liver).
No. of Mice Threshold value Mean Entropy Mean square Energy
1 T=175 0.5900 1.3768 2.6673 1.8650
2 T=165 0.4125 1.8165 2.0862 1.1409
3 T=185 0.4068 1.4311 2.6077 1.7826
4 T= 190 0.4137 1.8868 1.9521 9.9890
Average 0.45575 1.6278 2.328325 3.694375
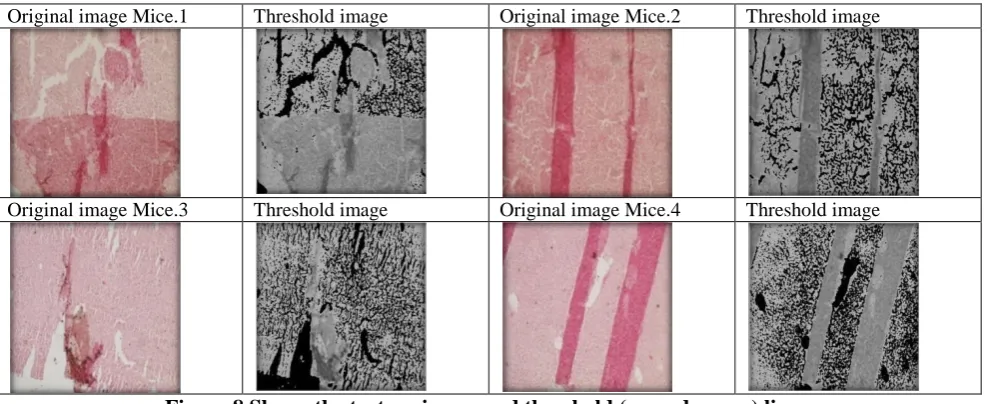
3. The third group (Liver): the mice where exsposured to 50 seconds to microwave plasma. Figure (9) represent the third group, the liver
exposure to 50 second. Table (5) list the statistical features using Law’s matrix.
Original image Mice.1 Threshold image Original image Mice.2 Threshold image
Original image Mice.3 Threshold image Original image Mice.4 Threshold image
Figure 9. Shows the texture image and threshold (third group) liver.
Table 5. The statistical feature of Law’s matrix for Third group with50 second exposuring for microwave plasma (liver).
No. of Mice Threshold value Mean Entropy Mean square Energy
1 T=195 0.5351 2.0194 1.5050 5.9378
2 T=195 0.3930 2.9073 1.9073 9.5367
3 T=160 0.5811 1.5459 2.4736 1.6040
4 T= 170 0.6093 1.3768 2.6673 1.8650
4. The fourth group (Liver): the mice exsposure to 90 seconds to microwave plasma. Fig. (10) represents the fourth group which is the liver exposure to 90 second. Table (6) list the statistical
features using Law’s matrix. Table (7) represents the average values of statistical features for Law’s matrix.
Original image Mice.1 Threshold image Original image Mice.2 Threshold image
Original image Mice.3 Threshold image Original image Mice.4 Threshold image
Figure 10. Shows the texture image and threshold (fourth group) liver.
Table 6. The statistical features of Law’s matrix for Fourth group with 90 second exposure to microwave plasma (liver).
No. of Mice Threshold value Mean Entropy Mean square Energy
1 T=170 0.4925 1.8079 2.1011 1.1572
2 T=185 0.5061 1.9740 1.7285 7.8324
3 T=195 0.6769 1.0451 2.9951 2.3516
4 T=195 0.5849 1.3630 2.6822 1.8859
Average 0.5651 1.5475 2.376725 1.52155
Table 7. Represents the average values of statistical features for Law’s matrix in (control, 20 second, 50 second, and 90 second).liver exposure to microwave plasma.
Statistical features control 20 second 50 second 90 second
Mean 0.59595 0.45575 0.529625 0.5651
Entropy 1.8336 1.6278 1.96235 1.5475
Mean Square 2.02655 2.328325 2.1383 2.376725
Figure 11. Shows the curve for average value of the statistical features for Law’s matrix (liver).
Conclusions:
The cold plasma affected the living tissue. It reaper the damage in the DNA cells. This can be obviously seen in Fig. (2, 3, 4, 5) and Table (1).
The microwave plasma affected the Liver function
of ALT, it decrease ALT enzyme by increasing the
time of exposing to plasma, the AST enzyme also, effected by exposure to microwave plasma it decrease the value of AST enzyme and get the best result in increasing time of exposure to 90 second. The ALP effected by microwave plasma, the ALP enzyme decreased its value in the 90 second exposure. The good matching between the result obtained from digital image processing and biological test. This can clearly shown from the figures and the tables in the research. The 20 second exposure shows random response to the plasma, this explain why the curve shows high value at the beginning, after this time the response will show normal effect of the microwave plasma on texture.
References:
1. Lebedev YA, Microwave discharges: generation and diagnostics, J. Phys. Conf. Ser., 2010; 257 (1): 1–12. 2. Mazhir SN, Hadi FW, Mazher AN, Alobaidy LH,
Texture Analysis of smear of Leukemia Blood Cells after Exposing to Cold Plasma, Baghdad Science Journal, 2017; 14 (2): 403-410.
3. Mazhir SN. Spectroscopic Study of (TiO2)1-x(CuO)x Plasma Generated by Nd: YAG Laser, ARPN Journal of Engineering and Applied Sciences. 2018; 13(3):864-869.
4. Enciso M, Infertile Men With Varicocele Show a
High Relative Proportion of Sperm Cells With Intense Nuclear Damage Level, Evidenced by the Sperm Chromatin Dispersion Test, J. Androl., 2006; 27 (1): 106–111.
5. Tice RR, Single cell gel/comet assay: Guidelines for in vitro and in vivo genetic toxicology testing, Environ. Mol. Mutagen, 2000; 35(3): 206–221. 6. Nwankwo NO, Nwodo A, Amalunweze K, Agbo,
Abugu S, Liver and Kidney Function Tests and Histological Study on Malaria Parasite Infected Mice Administered with Seed Extract of Picralima nitida, Int. J. Biochem. Res. Rev.,2015; 8(2): 1–14.
7. Kalghatgi S, Kelly CM, Cerchar E, Effects of Non-Thermal Plasma on Mammalian Cells, PLoS One, 2011; 6 (1):16270.
8. Wasfi AS, Humud HR, Ismael ME, Spectroscopic Measurements of The Electron Temperature in Low Pressure Microwave 2.45 GHz Argon Plasma, Iraqi Journal of Physics, 2015; 13 (27): 14-24.
9. Selvarajah S, Kodituwakku SR, Analysis and Comparison of Texture Features for Content Based Image Retrieval, Int. J. Latest Trends Comput., 2011; 2 (1): 108–113.
10.Vojnovic B, Barber PR, Johnston P, Gregory HC, A High Sensitivity High Throughput, Automated Single- Cell Gel Electrophoresis (Comet) DNA Damage Assay, Phys. Med. Biol.,2013; 58 (1): 15. 11.Elnemr HA, Statistical Analysis of Law’s Mask
Texture Features for Cancer and Water Lung Detection, IJCSI Int. J. Comput. Sci. Issues, 2013;10 (6): 196–202.
12.Angelis KJ, Dušinská M, Collins AR, Single cell gel electrophoresis: Detection of DNA damage at different levels of sensitivity, Electrophoresis, 1999; 20 (10): 2133–2138.
0.4 0.45 0.5 0.55 0.6
control 20 sec. 50 sec. 90 sec.
Me
an
Mean
0 0.5 1 1.5 2 2.5
control 20 sec. 50 sec. 90 sec.
En
tro
p
y
Entropy
1.8 1.9 2 2.1 2.2 2.3 2.4 2.5
control 20 sec. 50 sec. 90 sec.
Me
an
Sq
u
ar
e
Mean Square
0 1 2 3 4 5 6
control 20 sec. 50 sec. 90 sec.
En
ergy
13.Mazhir SN, Ali AH, Abdalameer NK, Hadi FW, Studying the effect of Cold Plasma on the Blood Using Digital Image Processing and Images Texture analysis. International conference on Signal Processing, Communication, Power and Embedded System (SCOPES), IEEE Xplore Digital Library, 2016; 904-914.
14.Kaur J, Comparative Analysis of Thresholding and Edge Detection Segmentation Techniques, Int. J. Comput. Appl., 2012; 39(15): 29–34.
15.Azeez MA, Mazhir SN, Ali AH, Detection and Segmentation of Lung Cancer using Statistical Features of X-Ray Images, International Journal of Computer Science and Mobile Computing IJCSMC, 2015; 4(2): 307 – 313.
هيحلا ةجسنلأا ىلع امزلاب فيوركياملا ريثأت ةساردل روصلل يجيسنلا ليلحتلا ةينقت مادختسا
يلع نيسح ءايلع
1 *
يرابلا دبع ليعامسا مزاح
2
رهزم يرون حابص
3
يرون حابص هيآ
4
4،3،1 ءايزيفلا مسق ،
تانبلل مولعلا ةيلك ،
دادغب ةعماج ،
قارعلا .
2 هيئايحلاا هناقتلا ثوحب زكرم ،
نيرهنلا ةعماج ،
قارعلا .
:هصلاخلا
ةيمقرلا روصلا ةجلاعم ةينقت مادختساب ةيحلا ةجسنلاا ىلع فيوركياملا امزلاب ريثأت ةساردل ةنجهم ةقيرط مادختسا ثحبلا اذه يف متيوونلا ضمحلا ايلاخ ىلع اهريثأت ةسارد للاخ نم DNA
مت .روصلل يجيسنلا ليلحتلاو بنذملا روص ليلحت قيبطت مادختساب نارئفلل دبكلاو
رئفلا ميسقت تضرع ىرخلاا ةثلاثلاو امزلابلل ةضرعم ريغ ىلولاا ( يتلااك يهو نارئف هعبرا ىلع يوتحت هعومجم لك عيماجم هعبرا ىلا نا
ةفلتخم نامزأب امزلابلل (20,50,90)sec
ةيتلوفو ةفرغلا ةرارح ةجردب ضيرعتلا متو يلاوتلا ىلع (V=175)
ددرت تحتو 2.4 GHz
مت .
نم ةيئاصحلاا صئاصخلا باسح نا جئاتنلا ترهظأ ،ةقاطلا ةفوفصم سايق نم اهباسح مت ةيجيسنلا صئاصخلا اما ،بنذملا روص ليلحت للاخ
حضاو ريثأت كلانه ناك كلذكو ،ايلاخلا يف لصاحلا مطحتلا ةيمك حلاصا ربع يوونلا ضمحلا ايلاخ ىلع حضاو ريثأت فيوركياملا امزلابل بكلا تاميزنا ىلع امزلابلا مادختسلا سوملمو د
(ALT, ALP, AST) .ضيرعتلا نمز ةدايزب تاميزنلاا هذه ليلقت مت ذأ ،
لا تاملك لا هيحاتفم