www.atmos-meas-tech.net/5/2339/2012/ doi:10.5194/amt-5-2339-2012
© Author(s) 2012. CC Attribution 3.0 License.
Measurement
Techniques
Development of a sensitive long path absorption photometer to
quantify peroxides in aerosol particles (Peroxide-LOPAP)
P. Mertes1, L. Pfaffenberger1, J. Dommen1, M. Kalberer2, and U. Baltensperger1
1Paul Scherrer Institute, Laboratory of Atmospheric Chemistry, Villigen, Switzerland 2Centre for Atmospheric Science, Department of Chemistry, University of Cambridge, UK
Correspondence to: J. Dommen ([email protected])
Received: 16 January 2012 – Published in Atmos. Meas. Tech. Discuss.: 13 February 2012 Revised: 25 July 2012 – Accepted: 31 July 2012 – Published: 2 October 2012
Abstract. A new off-line instrument to quantify peroxides in aerosol particles using iodometry in long path absorption spectroscopy has been developed and is called peroxide long path absorption photometer (Peroxide-LOPAP). The new an-alytical setup features important technical innovations com-pared to hitherto published iodometric peroxide measure-ments. Firstly, the extraction, chemical conversion and mea-surement of the aerosol samples are performed in a closed oxygen-free (∼1 ppb) environment. Secondly, a 50-cm opti-cal detection cell is used for an increased photometric sensi-tivity. The limit of detection was 0.1 µM peroxide in solution or 0.25 nmol m−3with respect to an aerosol sample volume of 1 m3. The test reaction was done at a constant elevated temperature of 40◦C and the reaction time was 60 min.
Calibration experiments showed that the test reaction with all reactive peroxides, i.e. hydrogen peroxide (H2O2),
peracids and peroxides with vicinal carbonyl groups (e.g. lauroyl peroxide) goes to completion and their sensitivity (slope of calibration curve) varies by only±5 %. However, very inert peroxides have a lower sensitivity. For example,
tert-butyl hydroperoxide shows only 37 % sensitivity
com-pared to H2O2 after 1 h. A kinetic study revealed that even
after 5 h only 85 % of this inert compound had reacted. The time trends of the peroxide content in secondary organic aerosol (SOA) from the ozonolysis and photo-oxidation ofα-pinene in smog chamber experiments were measured. The highest mass fraction of peroxides with 34 % (assuming a molecular weight of 300 g mol−1) was found in freshly generated SOA fromα-pinene ozonolysis. Mass fractions decreased with increasing NO levels in the photo-oxidation experiments. A decrease of the peroxide content was also observed with aging of the aerosol, indicating a de-composition of peroxides in the particles.
1 Introduction
Beside their decisive role in atmospheric processes ambient fine and ultrafine particles have also an important impact on human health, predominantly on respiratory and cardiovas-cular systems (Pope and Dockery, 2006; Pope et al., 2009). Up to about 70 % of these ambient particles are composed of organic material (Jimenez et al., 2009). However, the highly complex organic mixture is chemically still poorly charac-terized (Hallquist et al., 2009). The reaction of volatile or-ganic compounds with ozone and OH radicals in the polluted troposphere generates a variety of oxygenated organic com-pounds like aldehydes, ketones, carboxylic acids, nitrates and organic hydroperoxides of low volatility, which can parti-tion into aerosols (Atkinson, 2000; Atkinson and Arey, 2003; Kroll and Seinfeld, 2008). Organic hydroperoxides are gen-erated in the atmosphere in three different ways: (1) by gas phase reactions of HO2radicals with organic peroxy radicals
RO2(e.g. Atkinson, 2000), (2) via the reaction of water with
Along with several methods to analyse peroxides, the most widely used techniques are based on electrochemical reduc-tion (e.g. Qi and Baldwin, 1993) and fluorometric detecreduc-tion of a fluorescing dimer, which is produced from the deriva-tization of a peroxide catalysed by the enzyme horseradish peroxidase (e.g. Lazrus et al., 1985; Kok et al., 1986; Wang and Glaze, 1998). However, the relevant drawbacks of these detection methods are different sensitivities for different per-oxide species as well as the missing accessibility for dialkyl peroxides, which need to be hydrolysed first. Moreover, an aqueous solvent is required to sustain the catalytic activity of the enzyme. This hinders the quantitative extraction of less water soluble peroxides from the particles.
We used iodometry for quantification of the total perox-ide content (Banerjee and Budke, 1964). This method was already applied in other studies to measure the peroxide con-tent of aerosols (Docherty et al., 2005; Ziemann, 2005; Sur-ratt et al., 2006; Nguyen et al., 2010). Herein peroxy-groups oxidize iodide ions (I−) to molecular iodine (I2) in
solu-tion which subsequently forms yellow coloured triiodide ions (I−3). However, molecular oxygen reacts in the same way with iodide ions, which is a major drawback of this method. We minimised the influence of oxygen by constructing a closed oxygen-free instrument.
Furthermore, due to insensitive spectrophotometry with 1-cm cuvettes, the experiments in former studies had to be performed at very high aerosol concentrations and the time resolution was rather low (2–4 h) (e.g. Surratt et al., 2006). Peroxide mass fractions from 20 % to over 100 % were re-ported in SOA from various precursors assuming a molecular weight of 300 g mol−1for peroxides (Docherty et al., 2005;
Ziemann, 2005; Surratt et al., 2006; Nguyen et al., 2010). To enhance the sensitivity we developed a long path absorption spectroscopy system. According to Lambert-Beer’s law, the sensitivity of spectrophotometry can be enhanced by increas-ing the optical path length. However, this requires that the background from the reagents can be kept at a low level. This sensitive analytical method has already been successfully ap-plied in different colorimetric detection studies (e.g. Yao et al., 1998; Heland et al., 2001; Callahan et al., 2002). In anal-ogy to the original long path absorption photometer (LOPAP) which was developed for HONO measurements (Kleffmann et al., 2002), we call the instrument Peroxide-LOPAP.
2 Experimental
To measure peroxides in aerosol particles with our new Peroxide-LOPAP, samples are collected either via impaction on steel plates or behind a charcoal denuder on Teflon fil-ters. These samples are then extracted under anaerobic condi-tions in an aqueous solution of hydrochloric acid (pH 1) and ethanol (1:1 by volume) at 40◦C. Extraction and the iodo-metric test reaction of peroxides with iodide ions take place at the same time since the solvent mixture initially contains
potassium iodide (KI) as well. Anaerobic conditions are es-sential because molecular oxygen reacts competitive to per-oxides. Triiodide ions are formed in situ from generated io-dine and excess KI. After 60 min their absorbance is mea-sured using a long path detection cell (liquid core waveguide, LCW) and a photometer.
2.1 Analyser setup
Figure 1 presents a schematic of the new instrumental setup. The reaction vessel, the solvents, the liquid pump as well as the liquid core waveguide (LCW) are situated in an air tight PVC housing. This is permanently flushed with nitrogen (99.999 %, “5.0”). Liquids have to pass a PTFE (polytetraflu-oroethylene) in-line filter (Omnifit 003305, porosity 25 µm) before entering the LCW. Ultrapure nitrogen (UPN) is pro-duced from nitrogen (Carbagas, Alphagaz 2 N2, 99.9999 %,
<0.1 ppm O2)with a gas purifier (Entegris, GateKeeper).
This setup reduces the oxygen content to about 1 ppb, ac-cording to the manufacturer. Each solvent is purged for oxygen by bubbling with UPN before use in the test reac-tion. We exclusively use chemically resistant PTFE or PEEK (polyetheretherketone) tubings and fittings in the instrument. PTFE is known to be permeable to oxygen (Dobson and Tay-lor, 1986; Giacobbe, 1990) which requires that the entire extraction and measurement set up is placed in an oxygen-free atmosphere housing. Stainless steel tubings are used for nitrogen outside the housing. The piston cylinder and piston are made from ceramic and the cylinder case from Tefzel (Ismatec, REGLO-CPF RH00.CTC-LF). As detection cell we use a Teflon AF 2400 LCW tube (DuPont, 0.6 mm I.D.). This special type of Teflon differs from commonly used polyfluorocarbons by its very low index of refraction of 1.29 only (Resnick and Buck, 1999). Filled with water or ethanol the light is totally reflected inside the capillary. The optical path length was measured to be 0.46 m. The absorbance is measured by a spectrophotometer (Ocean Optics, SD 2000). White light is supplied via a 200-µm glass fiber (Fiber Optic, Switzerland, “Lichtleiter mit Quarzfaser” SFS200/220T UV-VIS) from a deuterium lamp (Avantes, AvaLight-DH-S). The glass fiber, the solvent tubing and the LCW are connected inside the housing via Tee fittings (VICI AG International, high pressure PEEK, 1/3200 fingertight nuts, bore 0.5 mm). The glass fibers are connected to these Tees via Nanovol-ume column replacement liners (VICI AG International, high pressure PEEK, 27 mm, 1/3200O.D., bore 225–250 µm). This system is easy to install, allows to change the LCW as well as the glass fibers easily and is air tight.
Fig. 1. Setup of the Peroxide-LOPAP. All tubings, fittings, vessels
and the pump are positioned in an air-tight PVC housing under a ni-trogen atmosphere (99.999 %). To position the reaction vessel into the analyser only that compartment has to be opened. Adding sol-vents into the reaction vessel as well as the triiodide solution into the LCW, the analyser has not to be opened. Before use, each solvent is purged of oxygen by bubbling with nitrogen (99.9999 %) cleaned with a gas purifier (Entegris, GateKeeper).
With this heater the temperature of the reaction solution in the reaction vessel can be elevated from 22◦C to about 39◦C within 2.5 min. This is very quick compared to the reaction time of 60 min. For each analysis, the test tube as well as the glass capillary was replaced by new ones.
2.2 Analysis protocol
Samples were extracted and reacted in 2.5 ml of 0.1 M HCl(aq)/ethanol (1:1 by volume) containing 26±0.3 mg
of potassium iodide (KI, 63±0.7 mM) (18 Mcm wa-ter; ethanol: Merck, EMSURE®, absolute for analysis; KI: Fisher Scientific). First, the reaction vessel containing the KI and the filter sample is placed in the heater within the reac-tion vessel compartment. This is then closed and the KI and the filter sample are flushed with ultrapure nitrogen (UPN) for 10 min. Then deoxygenated solvents are filled into the tube without opening the analyser housing. The heater is switched on during the filling time (∼4 min) and reaches 40◦C by the end of the filling.
To avoid semi-volatile compounds to evaporate from the aerosol samples while flushing with UPN, the aluminium heating block is cooled down from 40◦C to room temper-ature (RT) after each analysis with cooling spray. Homoge-neous mixing of the sample is achieved by bubbling UPN at the beginning of the extraction/reaction as well as after 60 min right before the photometric detection. A positive nitrogen pressure within all vessels is sustained during the analysis. At the end of the reaction, the mixture is pumped into the LCW to record the absorption spectrum.
2.3 Aerosol sampling and extraction
We used two different methods to sample aerosol particles: impaction and filter sampling. The aerosol mass collected was quantified gravimetrically (METTLER MT5, Max 5.1 g,
±1 µg).
For impaction we used an impactor described by Williams et al. (2006) with a particle size cut pointD50=85 nm.
Par-ticles impact on A4-steel plates (1 mm thickness) to ensure a flat surface. These steel plates are easier to handle compared to thin Teflon or aluminum foils and guarantee a constant dis-tance between critical orifice and sampling surface. Due to a high chromium content of A4-steel (16–18.5 %, X5CrNiMo 17-12-2, DIN EN 10088-3), these plates are inert and do not influence the test reaction as could be shown by blank (i.e. pure potassium iodide) experiments. The use of an im-pactor does not need a charcoal denuder to remove organic gases. However, the collection efficiency was just only 43 % as measured by gravimetry. The flow rate of the impactor was 7.2 l min−1.
For filter sampling we used 17 mm PTFE membranes (Flu-oropore Membrane, 3.0 µm, Millipore FSLW04700 or Fluo-ropore Membrane, 1.0 µm, Millipore FALP04700) behind a charcoal denuder to remove organic gas phase components. Flow rates were 14–15 l min−1for 3.0 µm pore size and 8– 9 l min−1 for 1.0 µm pore size. This type of sampling may suffer from positive artifacts from adsorbing gaseous species (if the denuder is not 100 % efficient) or negative artifacts by evaporation of semi-volatile species from the filter. The sam-pling times varied between 30 and 120 min depending on the aerosol mass concentration and sampling flow rate. During an experiment up to 5 samples were taken and analysed.
The aerosol sample on the filter or impactor steel plate stays in the reaction test tube during the entire reaction time. Hence, even peroxide species with a very low solubility in water or ethanol (e.g. benzoyl peroxide, lauroyl peroxide) are extracted and converted in the test reaction. Some extracted aerosol components may absorb visible or UV-light as well, as shown by Hecobian et al. (2010). To account for this inter-ference of absorbing aerosol components on the photomet-ric peroxide measurements, the Teflon filters were cut in two halves and one half was analysed without potassium iodide. In this way the background absorbance of the aerosol was subtracted from the triiodide signal.
2.4 Data acquisition
The absorbance was recorded using the software OOIBase32 (Ocean Optics). A reference spectrum was taken from the solvent mixture of 0.1 M HCl(aq)/ethanol (1:1 by volume).
Table 1. Organic peroxides used in this study.
26 Table 1. Organic peroxides used in this study.
1
benzoyl peroxide
lauroyl peroxide peracetic acid
tert -butyl hydroperoxide
2
3 Results and discussion
3.1 Calibration
Several peroxide species were used to calibrate the Peroxide-LOPAP. Standards were prepared from solutions of hydrogen peroxide (H2O2; Sigma-Aldrich, solution, 3 wt.% in water),
peracetic acid (PAA; Sigma-Aldrich,∼39 % in acetic acid,
≤6 % H2O2), tert-butyl hydroperoxide (tBuOOH; Aldrich,
Luperox® TBH70X, 70 wt.% in water), benzoyl peroxide (BenP; Aldrich, Luperox® A75, 75 %, remainder water) and lauroyl peroxide (LP; Aldrich, Luperox® LP, 97 %). Table 1 gives an overview of the chemical structures. Water solu-ble peroxides, i.e. H2O2, PAA and tBuOOH, were added in
different amounts to the reaction vessel as aqueous solution (40 µM). Solutions were positioned separately within the air-tight housing and purged for molecular oxygen with ultra-pure nitrogen (UPN, see Sect. 2.1) before use. Blank val-ues were measured from the solvent plus potassium iodide (KI). BenP and LP are soluble neither in water nor in ethanol. Therefore, standard solutions were prepared in ethyl acetate (Fluka, purum) and 2.5 µl thereof were pipetted on a Teflon filter and the filter was analysed analogously to an aerosol filter sample (see Sect. 2.3). The blank values were obtained using a clean Teflon filter.
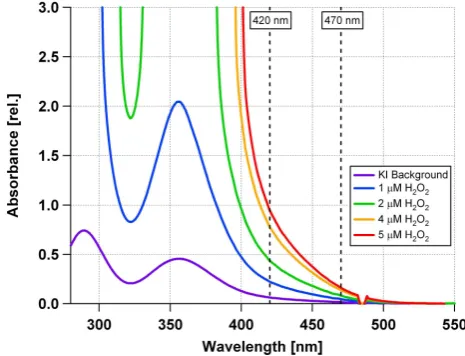
All samples were allowed to react for 60 min at 40◦C. In Fig. 2 the resulting absorbance spectra for H2O2are shown.
The absorbance at 420 nm is used for calibration and sam-ple measurement. The presence of triiodide ions in the blank measurement may result from iodine traces in KI or remain-ing impurities of molecular oxygen. The level of background absorbance was already reached after 15 min of reaction.
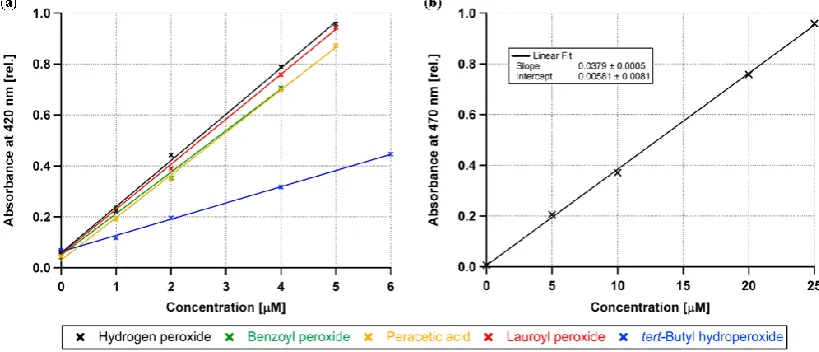
Figure 3 presents the calibration curves of different per-oxide standards. In Fig. 3a the absorbance data at 420 nm for all measured peroxides in the concentration range 0 to 6 µM and the resulting linear least squares regression fits are shown. All these calibration curves are similar except that of tBuOOH. At this wavelength, absorbance values up to 1 cor-relate linearly to the peroxide concentration. The slopes of the reactive peroxides vary between 0.163 and 0.181 giving
21 1
Figure 2. Absorption spectra of triiodide in 0.1 M aqueous HCl / ethanol (1:1 by volume). 2
Triiodide ions were produced from the reaction of hydrogen peroxide (H2O2) at different
3
concentrations with iodide ions. The concentration of potassium iodide (KI) was 63 mM. The 4
background spectrum was recorded from the pure KI solution. Absorbance values at 420 nm 5
and 470 nm were taken for calibration. 6
7
8
Fig. 2. Absorption spectra of triiodide in 0.1 M aqueous
HCl/ethanol (1:1 by volume). Triiodide ions were produced from the reaction of hydrogen peroxide (H2O2)at different
concentra-tions with iodide ions. The concentration of potassium iodide (KI) was 63 mM. The background spectrum was recorded from the pure KI solution. Absorbance values at 420 nm and 470 nm were taken for calibration.
an average slope of 0.172±0.009 (=±5.2 %). Other stud-ies used BenP (Docherty et al., 2005; Surratt et al., 2006) or H2O2(Nguyen et al., 2010) to calibrate their measurements.
According to Fig. 3a, these calibration curves can be used equally.
In contrast, the slope of the calibration curve of tBuOOH is 0.064 which is just 37 % of the other standards. The reactivity of tBuOOH may be reduced due to the donating inductive ef-fect of the tert-butyl group, which stabilises the O-O-bond of the peroxide group. Moreover, the tert-butyl group is known to protect neighbouring atoms sterically. Di-tert-butyl perox-ide being stabilised by two tertiary aliphatic groups is known to be not reactive at all in the iodometric reaction (Banerjee and Budke, 1964). We conclude that we can only measure reactive peroxides quantitatively.
In Fig. 3b, we extended the measurements of H2O2
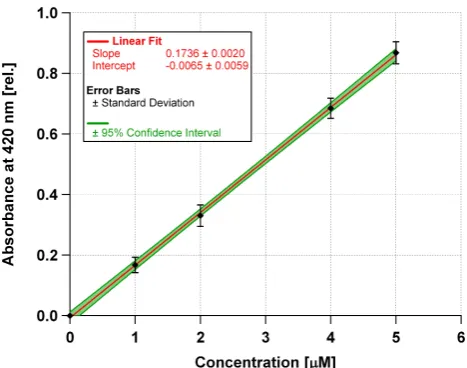
stan-dard solutions up to 25 µM by using the absorbance val-ues recorded at 470 nm. Due to the lower absorbance at this wavelength the measurement range can be extended to higher concentrations. Figure 4 shows the averaged values for the four reactive peroxides H2O2, BenP, LP and PAA at 420 nm.
Herein each curve was first blank corrected (i.e. intercept = 0) and the absorbances were averaged for each peroxide con-centration. From least squares linear regression, we obtained a slope of 0.174 µM−1with aR2of 99.96 % which defines the sensitivity of the method (Inczedy et al., 1998). This sensitivity was used to calculate the content of peroxides in aerosols from smog chamber experiments.
Fig. 3. (a) Calibration curves for absorbance data at 420 nm. Linear fits are shown for 5 different peroxides in the concentration range of
0 µM (i.e. KI only) up to 6 µM. The slopes from these least squares linear regressions range between 0.064 (tert-butyl hydroperoxide) and 0.181 (hydrogen peroxide). The slope of the less reactive tert-butyl hydroperoxide is about 2.5 times lower compared to those of the other peroxides. (b) Calibration curve of hydrogen peroxide from the absorbance at 470 nm. Peroxide concentrations range from 0 µM (i.e. KI only) up to 25 µM. Least squares linear regression gives aR2of 99.94 %.
corrected signal).cL was calculated according to Long and
Winefordner (1983) and is equal to 3 times the background signal standard deviation divided by the sensitivity. With respect to smog chamber experiments our detection limit for a sampling volume of 500 l is 0.52 nmol m−3, which is about 2000 times lower than the one reported by Docherty et al. (2005). This allowed us to perform the smog chamber experiments at much lower initialα-pinene concentrations.
3.2 Reaction time of triiodide formation
In order to explore the reason for the lower sensitivity of tert-butyl hydroperoxide and the optimal reaction time we per-formed calibrations with different reaction times while keep-ing the temperature at 40◦C. Figure 5 shows the temporal evolution of the absorbance at 420 nm from the triiodide for-mation for 2 µM solutions of hydrogen peroxide (H2O2),
lau-royl peroxide (LP) and tert-butyl hydroperoxide (tBuOOH). For H2O2, the triiodide concentration reaches the maximum
absorbance within 40 min and for LP within 60 min, while for tBuOOH the reaction does not go to completion even af-ter 5 h.
This confirms that the different sensitivity for tBuOOH is mainly due to its much lower reactivity. We conclude that when using a reaction time of 60 min, we are able to quantify the reactive peroxide species, i.e. H2O2, peracids and
per-oxides with vicinal carbonyl groups. In contrast, sterically protected and electronically stabilised peroxide species can not be captured quantitatively within 60 min even at an el-evated temperature of 40◦C. This shows the limitation of the iodometric peroxide quantification and underlines the importance of a constant reaction temperature to assure the comparability of all measured absorbance values.
3.3 Aerosol extraction
Banerjee and Budke (1964) quantified peroxide residues in organic solvents via iodometry/photometry in acetic acid/chloroform (2:1 by volume). Recent studies about the quantification of peroxides in aerosol particles used ethyl ac-etate (Docherty et al., 2005), ethyl acac-etate/methanol (1:1 by volume) (Surratt et al., 2006) or water (Nguyen et al., 2010) for particle extraction. For the test reaction, a mixture of this extraction solution plus acetic acid/chloroform (Docherty et al., 2005; Surratt et al., 2006) or acetonitril/methanol (Nguyen et al., 2010) was then used. In our method we use aqueous hydrochloric acid solution (0.1 M) and ethanol (1:1 by volume) for three reasons: (a) many solvents like esters contain large amounts of peroxide impurities; (b) the poly-imid coating of the glass fibers is not inert to mixtures of or-ganic acids with esters; (c) due to evaporation losses, highly volatile organic solvents are not suitable for our purging pro-cedure with ultrapure nitrogen to remove oxygen.
To assess the extraction efficiency of our method for per-oxides with low water/alcohol solubility, such as benzoyl peroxide (BenP) or lauroyl peroxide (LP), we spiked Teflon filters with defined amounts of BenP or LP dissolved in ethyl acetate (see Sect. 2.3). Then we analysed these filters for their peroxide content. We found the expected amount of these peroxides with our solvents as demonstrated by the corre-sponding calibration curves in Fig. 3a. Compared to the slope of the H2O2 calibration curve, the slope of BenP reaches
90 % and of LP even 98 % of this value.
Another important aspect of the extraction technique re-lates to the recently shown ability of different types of secondary organic aerosol (SOA) to produce H2O2 under
Fig. 4. Average of calibration curves from hydrogen peroxide,
ben-zoyl peroxide, lauroyl peroxide and peracetic acid. Measurements were blank corrected and absorbance values averaged for each con-centration. Error bars represent ±standard deviation. The green area illustrates the 95 % confidence interval. The slope of this curve was used to calculate peroxide concentrations from the smog cham-ber experiments.
This phenomenon was already observed earlier by an ex-ceedance of Henry’s law by H2O2associated with aerosols
(Arellanes et al., 2006). The authors suspected that the sam-pled particles are capable of generating H2O2 in aqueous
solution. Moreover, redox cycling abilities of PM2.5 have
been reported already a decade ago (Squadrito et al., 2001). All three cited studies performed the peroxide extraction of aerosols under aerobic conditions and hence did not exclude possible H2O2formation during extraction. In our
Peroxide-LOPAP the sampled particles are extracted under anaerobic conditions to avoid in-situ H2O2production.
3.4 Peroxides in SOA fromα-pinene
With our new instrument we analysed secondary organic aerosol particles produced in the PSI smog chamber. This is a 27-m3 flexible Teflon bag suspended in a temperature controlled wooden enclosure (Paulsen et al., 2005). Four xenon arc lamps combined with 80 black light lamps (SUN POWER Performance 100 W) are used to simulate the so-lar light spectrum and induce photochemical reactions. SOA was produced from α-pinene as biogenic precursor. The experiments were done at 20◦C. A scanning mobility particle sizer (SMPS, consisting of a differential mobility analyser (DMA, TSI 3071) and a condensation particle counter (CPC, TSI 3022)) measured the particle size distribution, which was converted to a mass concentration assuming spherical par-ticle geometry with a density of 1.3 g cm−3 (Alfarra et al., 2006; Ng et al., 2007). O3, NO, and NO2were all
continu-ously monitored.
Fig. 5. Time evolution curves for the conversion of iodide ions to
tri-iodide via molecular iodine (at an tri-iodide concentration of 63 mM). The diagram presents three exponential fits for 2 µM solutions of hydrogen peroxide, lauroyl peroxide and tert-butyl hydroperoxide at 40◦C. Background levels are subtracted.
The amount of peroxide functional groups was measured and normalised to the aerosol mass collected. Finally, total peroxide concentrations were determined in aerosol particles as a function of chemical age. The molecular weight of per-oxides was assumed to be 300 g mol−1, equal to Docherty et al. (2005).
3.4.1 SOA from ozonolysis ofα-pinene
After setting the relative humidity to 50 %, O3 was added
to the smog chamber followed by n-butanol as OH scav-enger and α-pinene (Aldrich, 98 %). Initial concentrations of reactants were 90 ppb ofα-pinene, 9.4 ppm of n-butanol and 500 ppb of O3. The reaction started with α-pinene
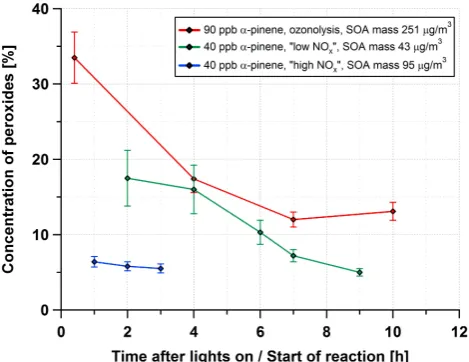
Fig. 6. Measured concentrations of peroxides in the aerosol
parti-cles after different reaction times in the smog chamber for ozonoly-sis as well as for photo-oxidation at low and high NOxofα-pinene.
An average molecular weight of 300 g mol−1was assumed for the peroxides. Maximum suspended SOA levels are given in legend. Error estimation includes uncertainties of the absorption measure-ment, sensitivity, solvent volume and aerosol mass. The largest con-tribution to the error is from filter weighing.
49 %, respectively. We assume that these cited values are not from aged aerosol but this remains unclear from their pa-pers. Docherty et al. (2005) assumed a density of 1 g cm−3
for the aerosol volume concentration from their SMPS mea-surements. Recalculating their peroxide content with a den-sity of 1.3 g cm−3as used by us yields 47/1.3 = 36 %, which is in good agreement with our first sample measurement. The aerosol density used by Surratt et al. (2006) is not reported in their paper.
3.4.2 SOA from photo-oxidation ofα-pinene
We performed two experiments with different NOx
concen-trations. First, nitrous acid (HONO) was added to the smog chamber as an OH radical source. As reagent solutions, 10 mM sulfuric acid and 1 mM or 3 mM sodium nitrite so-lution were used in a HONO generator similar to the one of Taira and Kanda (1990). Gaseous HONO was purged into the chamber by pure air and the gas flow was adjusted to main-tain a constant HONO level. The initial concentration ofα -pinene (98 %, Aldrich) was 40 ppb in both experiments. After reactants had been allowed to mix for 15 min, the photo-oxidation reaction was started by switching on all lights.
In the first experiment the relative humidity was 53 % and the initial NO concentration was 0.35 ppb. The reac-tion was continued for 10 h. Five filter samples (pore size 1.0 µm) were taken during the experiments and analysed for peroxides as well as aerosol absorbance. Sampling times ranged between 60 and 120 min (535–1066 l). At 420 nm, all
sample extracts again showed a very low original aerosol ab-sorbance of about 0.001, which is small compared to the per-oxide measurement uncertainty. As for the ozonolysis exper-iments, the triiodide signals did not have to be corrected for aerosol absorbance. The time series of the measured perox-ide concentrations is included in Fig. 6 (green line). Although the maximum aerosol mass concentration as determined by SMPS measurements was only 43 µg m−3, the measured per-oxide amounts were still at least 10 times above the limit of detection (LOD). Peroxide mass fractions ranged between 18 % and 5 %. During the first four hours of the experiment, the mass fraction was constant at about 17 % and decreased thereafter continuously, reaching 5 % at the end of the exper-iment. The NO mixing ratio started to increase 4 h after lights on from the initial 0.35 ppb to reach finally 1.8 ppb at the end of the experiment.
In the second experiment HONO and α-pinene were added to the smog chamber as described before. To generate higher NOxconditions via the HONO source, we used 3 mM
sodium nitrite solution and an increased flow of pure air to purge gaseous HONO into the chamber. We also introduced ammonium hydrogen sulfate as a seed aerosol. The mode of the seed aerosol was at a diameter of 48 nm and its initial mass concentration was 26.5 µg m−3. The relative humidity was set to 82 % to provide a wet aerosol to the condensing secondary organic aerosol species. After 15 min of mixing, the photo-oxidation was started by turning on all lights. The initial NO mixing ratio was about 3.3 ppb in the beginning, decreased during the first hour and stabilised at about 1.8 ppb. The SOA concentration reached a maximum of 95 µg m−3 af-ter about 3 h of reaction. Aerosol particles were collected on impactor steel plates for 60 min (∼430 l each). Three sam-ples were taken. The resulting peroxide concentrations in the first 3 h after lights on are given in Fig. 6 (blue line). The level slightly decreased from 6.4 % to 5.5 %.
Peroxides are formed in the gas phase via the bimolecu-lar combination of peroxy radicals (HO2+ RO2).
Compet-itive to this channel, peroxy radicals are removed by NO to form NO2, alkoxy or OH radicals. We compared the
simulated formation of the first generation peroxide uct hydroperoxy-pinanol and the second generation prod-uct perpinonic acid for the two experimental cases using the master chemical mechanism (MCM 3.2, http://mcm.leeds.ac. uk/MCM/home.htt). These two compounds were considered surrogates of peroxides which can partition into the particle phase. Both, hydroperoxy-pinanol and perpinonic acid con-centrations were roughly a factor of three higher in the low NOxcase after 3 h of simulation. This is in fairly good
4 Conclusions
Our new peroxide long path absorption photometer (Peroxide-LOPAP) is sensitive enough to quantify peroxide concentrations in smog chamber experiments at typical at-mospheric concentrations of volatile organic compounds and aerosols. Moreover, we are able to take several samples dur-ing a smog chamber experiment to follow the trend of the peroxide content in the aging aerosol with a time resolution of about 0.3 to 1 h.
The experiments performed confirmed the dependence of the peroxide concentrations on the NOxconcentration. The
peroxide levels were highest for the ozonolysis ofα-pinene and decreased with increasing NOxconcentrations. Even at
NO levels of 2–3 ppb, we could still measure peroxides in the aerosol. Model simulations predict a similar decrease in per-oxide concentrations as observed between low and high NOx
experiments. However, this could also be by accident. It may be that acylperoxynitrates might contribute to the measured signal. However, from a chemical point of view, these com-pounds are also peroxides. There is also the possibility that other oxidative compounds, e.g. quinones or metal ions, are present which could transform iodide into iodine. We do not expect either of these in our experiments but this might be an issue when this analytical method is applied to other samples. Wang et al. (2011) observed H2O2in SOA fromα-pinene
photo-oxidation experiments at high NO levels. They spec-ulated that H2O2 was likely formed in decomposition or
hydrolysis reactions of hydroperoxides. The peroxide levels found in our study would be high enough to explain their ob-servations of H2O2. Acid catalysed decomposition has been
shown to be rather slow (Miner and Hagan, 1972; Seubold and Vaughan, 1953). Based on those data, we estimate that the decomposition of the reactive peroxides by hydronium ions would be below 5 % within 60 min. We also do not have experimental evidence for this effect. Surratt et al. (2006) could not detect peroxides in SOA from isoprene under high NOxconditions. This may be due to the fact that the
perox-ide amount was below their detection limit or the NOxlevels
were higher than in our experiment.
An interesting feature was observed from the time trends. Both for ozonolysis and low NO photo-oxidation, a decrease of the peroxide content over time was observed, although the aerosol mass did not increase any further. This indicates a de-composition or hydrolysis of a large fraction of peroxides in the aerosol within a few hours. Surratt et al. (2006) reported a similar observation from isoprene SOA produced under low NOxconditions.
Acknowledgements. This study was financially supported by the Swiss National Science Foundation as well as the FP7 project EUROCHAMP-2. The authors thank I. El Haddad and M. J. Rossi for helpful and inspiring discussions as well as R. Richter and G. Wehrle for their competent technical advice.
Edited by: H. Herrmann
References
Alfarra, M. R., Paulsen, D., Gysel, M., Garforth, A. A., Dommen, J., Pr´evˆot, A. S. H., Worsnop, D. R., Baltensperger, U., and Coe, H.: A mass spectrometric study of secondary organic aerosols formed from the photooxidation of anthropogenic and biogenic precursors in a reaction chamber, Atmos. Chem. Phys., 6, 5279– 5293, doi:10.5194/acp-6-5279-2006, 2006.
Arellanes, C., Paulson, S. E., Fine, P. M., and Sioutas, C.: Exceeding of Henry’s law by hydrogen peroxide associated with urban aerosols, Environ. Sci. Technol., 40, 4859–4866, doi:10.1021/es0513786, 2006.
Atkinson, R.: Atmospheric chemistry of VOCs and NOx, Atmos.
Environ., 34, 2063–2101, doi:10.1016/s1352-2310(99)00460-4, 2000.
Atkinson, R. and Arey, J.: Atmospheric degradation of volatile organic compounds, Chem. Rev., 103, 4605–4638, doi:10.1021/cr0206420, 2003.
Banerjee, D. K. and Budke, C. C.: Spectrophotometric determina-tion of traces of peroxides in organic solvents, Anal. Chem., 36, 792–796, doi:10.1021/ac60210a027, 1964.
Bonn, B., von Kuhlmann, R., and Lawrence, M. G.: High contribution of biogenic hydroperoxides to secondary or-ganic aerosol formation, Geophys. Res. Lett., 31, L10108, doi:10.1029/2003gl019172, 2004.
Callahan, M. R., Rose, J. B., and Byrne, R. H.: Long path length absorbance spectroscopy: trace copper analysis using a 4.4 m liq-uid core wavegliq-uide, Talanta, 58, 891–898, doi:10.1016/s0039-9140(02)00403-4, 2002.
Dobson, J. V. and Taylor, M. J.: The permeability of gases through PTFE and other membranes at 25-degrees-C, Electrochim. Acta, 31, 231–233, doi:10.1016/0013-4686(86)87113-4, 1986. Docherty, K. S., Wu, W., Lim, Y. B., and Ziemann, P. J.:
Contri-butions of organic peroxides to secondary aerosol formed from reactions of monoterpenes with O3, Environ. Sci. Technol., 39,
4049–4059, doi:10.1021/es050228s, 2005.
Faust, B. C., Anastasio, C., Allen, J. M., and Arakaki, T.: Aqueous-phase photochemical formation of peroxides in authentic cloud and fog waters, Science, 260, 73–75, doi:10.1126/science.8465202, 1993.
Giacobbe, F. W.: Oxygen permeability of Teflon PFA tubing, J. Appl. Polym. Sci., 39, 1121–1132, doi:10.1002/app.1990.070390508, 1990.
Hallquist, M., Wenger, J. C., Baltensperger, U., Rudich, Y., Simp-son, D., Claeys, M., Dommen, J., Donahue, N. M., George, C., Goldstein, A. H., Hamilton, J. F., Herrmann, H., Hoff-mann, T., Iinuma, Y., Jang, M., Jenkin, M. E., Jimenez, J. L., Kiendler-Scharr, A., Maenhaut, W., McFiggans, G., Mentel, Th. F., Monod, A., Pr´evˆot, A. S. H., Seinfeld, J. H., Surratt, J. D., Szmigielski, R., and Wildt, J.: The formation, properties and im-pact of secondary organic aerosol: current and emerging issues, Atmos. Chem. Phys., 9, 5155–5236, doi:10.5194/acp-9-5155-2009, 2009.
2,3-dimethyl-2-butene, J. Geophys. Res.-Atmos., 106, 34131–34142, doi:10.1029/2001jd000597, 2001.
Hecobian, A., Zhang, X., Zheng, M., Frank, N., Edgerton, E. S., and Weber, R. J.: Water-soluble organic aerosol material and the light-absorption characteristics of aqueous extracts measured over the Southeastern United States, Atmos. Chem. Phys., 10, 5965–5977, doi:10.5194/acp-10-5965-2010, 2010.
Heland, J., Kleffmann, J., Kurtenbach, R., and Wiesen, P.: A new instrument to measure gaseous nitrous acid (HONO) in the atmosphere, Environ. Sci. Technol., 35, 3207–3212, doi:10.1021/es000303t, 2001.
Inczedy, J., Lengyel, T., and Ure, A. M.: Compendium of Analytical Nomenclature (Definitive Rules 1997) - The Orange Book, 3rd ed., Blackwell Science, 1998.
Jimenez, J. L., Canagaratna, M. R., Donahue, N. M., Pr´evˆot, A. S. H., Zhang, Q., Kroll, J. H., DeCarlo, P. F., Allan, J. D., Coe, H., Ng, N. L., Aiken, A. C., Docherty, K. S., Ulbrich, I. M., Grieshop, A. P., Robinson, A. L., Duplissy, J., Smith, J. D., Wilson, K. R., Lanz, V. A., Hueglin, C., Sun, Y. L., Tian, J., Laaksonen, A., Raatikainen, T., Rautiainen, J., Vaattovaara, P., Ehn, M., Kulmala, M., Tomlinson, J. M., Collins, D. R., Cu-bison, M. J., Dunlea, E. J., Huffman, J. A., Onasch, T. B., Al-farra, M. R., Williams, P. I., Bower, K., Kondo, Y., Schnei-der, J., Drewnick, F., Borrmann, S., Weimer, S., Demerjian, K., Salcedo, D., Cottrell, L., Griffin, R., Takami, A., Miyoshi, T., Hatakeyama, S., Shimono, A., Sun, J. Y., Zhang, Y. M., Dzepina, K., Kimmel, J. R., Sueper, D., Jayne, J. T., Herndon, S. C., Trim-born, A. M., Williams, L. R., Wood, E. C., Middlebrook, A. M., Kolb, C. E., Baltensperger, U., and Worsnop, D. R.: Evolution of organic aerosols in the atmosphere, Science, 326, 1525–1529, doi:10.1126/science.1180353, 2009.
Johnson, D., Jenkin, M. E., Wirtz, K., and Martin-Reviejo, M.: Simulating the formation of secondary organic aerosol from the photooxidation of toluene, Environ. Chem., 1, 150–165, doi:10.1071/en04069, 2004.
Kleffmann, J., Heland, J., Kurtenbach, R., Lorzer, J., and Wiesen, P.: A new instrument (LOPAP) for the detection of nitrous acid (HONO), Environ. Sci. Pollut. R., Special Issue 4, 48–54, 2002. Kok, G. L., Thompson, K., Lazrus, A. L., and McLaren, S. E.: Derivatization technique for the determination of peroxides in precipitation, Anal. Chem., 58, 1192–1194, doi:10.1021/ac00297a047, 1986.
Kroll, J. H. and Seinfeld, J. H.: Chemistry of secondary ganic aerosol: formation and evolution of low-volatility or-ganics in the atmosphere, Atmos. Environ., 42, 3593–3624, doi:10.1016/j.atmosenv.2008.01.003, 2008.
Lazrus, A. L., Kok, G. L., Gitlin, S. N., Lind, J. A., and McLaren, S. E.: Automated fluorometric method for hydrogen-peroxide in atmospheric precipitation, Anal. Chem., 57, 917– 922, doi:10.1021/ac00281a031, 1985.
Long, G. L. and Winefordner, J. D.: Limit of detection, Anal. Chem., 55, A712–A714, doi:10.1021/ac00258a001, 1983. Miner, F. J. and Hagan, P. G.: Rate of hydrogen-peroxide
decom-position in nitric-acid solutions, Ind. Eng. Chem. Proc. DD, 11, 547–549, doi:10.1021/i260044a017, 1972.
Morio, L. A., Hooper, K. A., Brittingham, J., Li, T. H., Gordon, R. E., Turpin, B. J., and Laskin, D. L.: Tissue injury following in-halation of fine particulate matter and hydrogen peroxide is asso-ciated with altered production of inflammatory mediators and
an-tioxidants by alveolar macrophages, Toxicol. Appl. Pharm., 177, 188–199, doi:10.1006/taap.2001.9316, 2001.
Ng, N. L., Chhabra, P. S., Chan, A. W. H., Surratt, J. D., Kroll, J. H., Kwan, A. J., McCabe, D. C., Wennberg, P. O., Sorooshian, A., Murphy, S. M., Dalleska, N. F., Flagan, R. C., and Seinfeld, J. H.: Effect of NOxlevel on secondary organic aerosol (SOA)
formation from the photooxidation of terpenes, Atmos. Chem. Phys., 7, 5159–5174, doi:10.5194/acp-7-5159-2007, 2007. Nguyen, T. B., Bateman, A. P., Bones, D. L., Nizkorodov, S.
A., Laskin, J., and Laskin, A.: High-resolution mass spec-trometry analysis of secondary organic aerosol generated by ozonolysis of isoprene, Atmos. Environ., 44, 1032–1042, doi:10.1016/j.atmosenv.2009.12.019, 2010.
Paulsen, D., Dommen, J., Kalberer, M., Pr´evˆot, A. S. H., Richter, R., Sax, M., Steinbacher, M., Weingartner, E., and Baltensperger, U.: Secondary organic aerosol formation by irradiation of 1,3,5-trimethylbenzene-NOx-H2O in a new reaction chamber for
at-mospheric chemistry and physics, Environ. Sci. Technol., 39, 2668–2678, doi:10.1021/es0489137, 2005.
Pope, C. A. and Dockery, D. W.: Health effects of fine particulate air pollution: lines that connect, J. Air Waste Manage., 56, 709–742, 2006.
Pope, C. A., Ezzati, M., and Dockery, D. W.: Fine-particulate air pollution and life expectancy in the United States, N. Engl. J. Med., 360, 376–386, doi:10.1056/NEJMsa0805646, 2009. Qi, X. H. and Baldwin, R. P.: Liquid-chromatography and
electro-chemical detection of organic peroxides by reduction at an iron phthalocyanine chemically-modified electrode, Electroanal., 5, 547–554, doi:10.1002/elan.1140050704, 1993.
Resnick, P. R. and Buck, W. H.: Teflon AF: a family of amor-phous fluoropolymers with extraordinary properties, in: Fluo-ropolymers 2: Properties, edited by: Hougham, G., Plenum Press, New York, 25–33, 1999.
Seubold, F. H. and Vaughan, W. E.: Acid-catalyzed decomposition of cumene hydroperoxide, J. Am. Chem. Soc., 75, 3790–3792, doi:10.1021/ja01111a055, 1953.
Squadrito, G. L., Cueto, R., Dellinger, B., and Pryor, W. A.: Quinoid redox cycling as a mechanism for sustained free radical generation by inhaled airborne particulate matter, Free Radical Bio. Med., 31, 1132–1138, doi:10.1016/s0891-5849(01)00703-1, 2001.
Surratt, J. D., Murphy, S. M., Kroll, J. H., Ng, N. L., Hildebrandt, L., Sorooshian, A., Szmigielski, R., Vermeylen, R., Maenhaut, W., Claeys, M., Flagan, R. C., and Seinfeld, J. H.: Chemical composition of secondary organic aerosol formed from the pho-tooxidation of isoprene, J. Phys. Chem. A, 110, 9665–9690, doi:10.1021/jp061734m, 2006.
Taira, M. and Kanda, Y.: Continuous generation system for low-concentration gaseous nitrous-acid, Anal. Chem., 62, 630–633, doi:10.1021/ac00205a018, 1990.
Wang, K. X. and Glaze, W. H.: High-performance liquid chro-matography with postcolumn derivatization for simultane-ous determination of organic peroxides and hydrogen per-oxide, J. Chromatogr. A, 822, 207–213, doi:10.1016/s0021-9673(98)00598-6, 1998.
Williams, B. J., Goldstein, A. H., Kreisberg, N. M., and Hering, S. V.: An in-situ instrument for speciated organic composition of atmospheric aerosols: Thermal Desorption Aerosol GC/MS-FID (TAG), Aerosol Sci. Tech., 40, 627–638, doi:10.1080/02786820600754631, 2006.
Yao, W. S., Byrne, R. H., and Waterbury, R. D.: Determination of nanomolar concentrations of nitrite and nitrate in natural waters using long path length absorbance spectroscopy, Environ. Sci. Technol., 32, 2646–2649, doi:10.1021/es9709583, 1998.