www.earth-syst-dynam.net/7/385/2016/ doi:10.5194/esd-7-385-2016
© Author(s) 2016. CC Attribution 3.0 License.
Effect of various climate databases on the results
of dendroclimatic analysis
Roman Sitko1, Jaroslav Vido2, Jaroslav Škvarenina2, Viliam Pichler2, ´Lubomír Scheer1, Jana Škvareninová3, and Paulína Nalevanková2
1Department of Forest Management, Faculty of Forestry, Technical University in Zvolen,
T. G. Masaryka 24, 960 53 Zvolen, Slovakia
2Department of Natural Environment, Faculty of Forestry, Technical University in Zvolen,
T. G. Masaryka 24, 960 53 Zvolen, Slovakia
3Department of Applied Ecology, Faculty of Ecology and Environmental Sciences, Technical University
in Zvolen, T. G. Masaryka 24, 960 53 Zvolen, Slovakia
Correspondence to: Roman Sitko ([email protected])
Received: 13 July 2015 – Published in Earth Syst. Dynam. Discuss.: 26 August 2015 Revised: 1 April 2016 – Accepted: 5 April 2016 – Published: 26 April 2016
Abstract. The paper deals with the comparison of the time series drawn from different climate databases. We compared the observed data with the modeled data of monthly and seasonal temperature means and precipitation totals. Reliable and longest available time series of such data represent the basic starting point of dendroclimatic analyses. We evaluated the differences in the growth response of spruce derived using different databases of the considered climatic variables. The stem cores used to derive the cross-correlation function were taken from Hårås locality situated in the boreal zone of the Swedish part of Lapland. We compared the observed records from the nearest weather stations situated 18, 40, 70 and 110 km away from the locality with the interpolated data from four modeled temperature databases and four modeled precipitation databases generated by KNMI Climate Explorer. The spatial resolution of the modeled databases was 0.5◦×0.5◦of latitude and longitude or 1◦×1◦ respectively. The evaluation revealed that in all modeled databases systematic errors of different magnitudes occurred. We also found that the radial increments of spruce correlated more tightly with the temperature than with the precipitation in the area of interest. Hence, in the conditions of the boreal zone, temperature could be a more important factor with regard to tree-ring formation. Because of higher spatial variability seen in precipitation data when compared to temperature data, we conclude that the nearest weather station is the most suitable for dendroclimatic analysis leaning on precipitation. Drawing on these results we recommend that the modeled precipitation and temperature databases examined in our study are used for dendroclimatic analyses within areas featuring a sparse network of weather stations.
1 Introduction
Dendroclimatology as a branch of dendrochronology uses dated ring series to reconstruct the current and past climate (Grudd et al., 2002; Luterbacher et al., 2004; Pauling et al., 2006). Reconstruction of temperature regime through tree-ring series establishes the starting point for the current de-bate on climate change. Detection of external climatic fac-tors, including changes in orbital solar flow, volcanic
erup-tions, greenhouse gases and combinations thereof by means of tree ring series analysis represents a major challenge for interdisciplinary research (Büntgen et al., 2013).
calibra-tion and creacalibra-tion of climate scenarios, while climate variabil-ity affects many natural and anthropogenic systems. Due to this, the need has arisen to create standard climate databases for different climate elements that would cover the vast area of the Earth. In dendroclimatology, monthly and sea-sonal databases of climate elements are mainly used. Several databases have been created for different primary and sec-ondary climate variables (Mitchell and Jones, 2005).
In dendroclimatological studies dealing with the growth responses of tree species to main climatic factors, i.e. temper-ature and precipitation (e.g. Babst et al., 2013; Büntgen et al., 2007; Gouirand et al., 2007; Wang et al., 2013), the world-wide database created by the Climatic Research Unit (here-after as CRU), which belongs to the University of East An-glia, is frequently used. Main data sources for this database are (Harris et al., 2014):
– CLIMAT reports, quality-controlled monthly means
and/or totals distributed via WMO-GTS
– Monthly Climatic Data for the World (MCDW),
cre-ated by the National Climatic Data Center (NCDC) for WMO
– World Weather Records (WWR) – 10-year long
databases, which are swapped between the National Meteorological Services (NMSs) and NCDC
– The Australian Bureau of Meteorology (BoM).
Besides the mentioned CRU database there are numerous other gridded databases with a monthly step of climate time series, eg.: HadCRUT4 (Cowtan and Way, 2014), GISS (Hansen et al., 2010), GPCC (Schneider et al., 2015), E-OBS (Haylock et al., 2008), as well as seasonal climatic databases, eg.: Luterbacher et al. Temperature (Luterbacher et al., 2004) and Pauling et al. Precipitation (Pauling et al., 2006), that are more or less suitable for the dendroclimatic analysis.
In dendroclimatological applications the selection of cli-mate data is necessary for the unambiguous explanation of climate impact on the creation of tree radial increment. It is important that these data reflect real conditions under which the increment was created. However, considering the density of weather stations and the variability of meteorological el-ements conditioned mainly by the morphological roughness of the terrain, this condition cannot always be met.
At this context, precipitation is characterized by much higher spatial variability than temperature, and many more sites are required for reliable spatial precipitation reconstruc-tions, whereas relatively robust spatial temperature estimates can be generated from only a couple of well-located proxy records (Büntgen et al., 2010).
The main objective of this work is to compare the various gridded databases of modeled temperature as well as precip-itation data with observed data from an array of the nearest weather stations. The essential question was to analyze the influence of different sources of climatic data on explaining
the formation of radial increment of spruce. From this point of view, measured tree ring widths are considered as refer-ence data.
Our study addressed three hypotheses:
i. The Swedish part of Lapland over the polar circle is an appropriate locality for extraction of significant climatic signal from tree rings dendrochronologies of spruce for the main climatic variables, i.e. temperature and precipi-tation. It is an area dominated by the temperature signal.
ii. The nearest weather station to locality of radial incre-ment formation is the most appropriate for dendrocli-matic growing response analysis.
iii. Gridded data sets of temperature and precipitation are appropriate enough for extracting existing significant climatic signal by dendroclimatic growing response analysis in areas with a sparse network of weather sta-tions. There are no significant differences between grid-ded and observed data sets.
2 Materials and methods
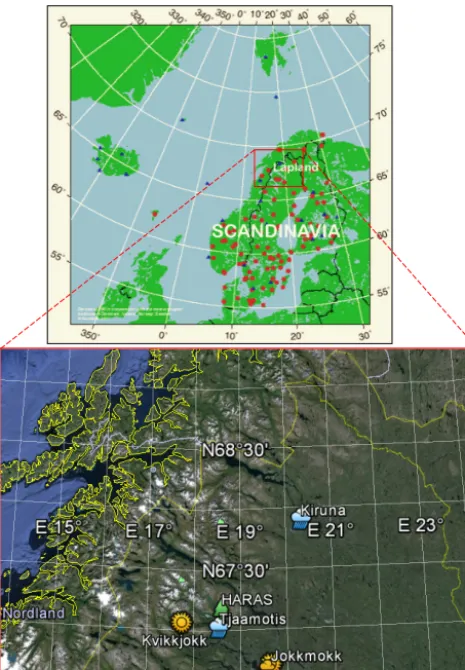
Our data were collected at Hårås, a hilly locality situated in the Swedish part of Lapland. Hårås is located 60 km north of the Arctic Circle border in Norrbotten region, 70 km west of Jokkmokk town. Its elevation is around 585 m a.s.l. Oro-graphically, Hårås belongs to the Scandinavian Mountains. Its soil can be classified as Podsol. Location of study area at the Swedish part of Lapland is shown in Fig. 1.
Regarding tree species composition, Pinus sylvestris and Picea excelsa dominate in local forest stands. As the eleva-tion increases, tree canopy opens up and the share of Betula sp. in species composition increases. The upper tree line at an elevation of around 715 m a.s.l. is formed by pure birch stands.
2.1 Climate of study area
According to the Köppen-Geiger climate classification (Kot-tek et al., 2006), the locality belongs to the subpolar climate Dfc. (snow zone, fully humid with cool summer) and it fea-tures long, usually very cold winters, and short, cool to mild summers. Based on the observed meteorological data from the Kvikkjokk station (between the years 1890 and 2001), the Walter climate diagram was constructed in order to ex-press the climate features in the area (Fig. 2).
Figure 1.Location of Hårås plot, Kvikkjokk, Tjåmotis and Kiruna meteorological stations in the Swedish part of Lapland. Meteosta-tion map of the NORDKLIM database: staMeteosta-tions with data series longer than 90 years, shorter than 90 years (modified from: Tuomen-virta et al., 2001).
and the maximum average monthly temperature was ob-served in July 1937 (16.8◦C). Because of the humid climate and a relatively low average air temperature due to energy balance of high latitudes, it is anticipated that air temperature represents the main climate driver for ecological processes in the studied area. This is confirmed also by Holtmeier and Broll (2005).
2.2 Climate databases
Two groups of databases were assessed in the study. The first one – NORDKLIM is the database of observed climate data. Three data sets of temperature records and six sets for the precipitation records, recorded on the four weather stations situated close to the locality Hårås, were used for compari-son.
The second group included eight data sets generated from five gridded databases. The data from this group are here-inafter called modeled data set. The four modeled data sets of
-30 -20 -10 0 10 20 30 40 50
-60 -40 -20 0 20 40 60 80 100
I II III IV V VI VII VIII IX X XI XII
Ai
r te
m
pe
ra
tu
re
(°
C)
Pr
ec
ip
ita
tio
n
(mm)
Month
Kvikkjokk 66°57′ N 17°43′ E Altitude: 344 m Annual precipitation sum: 581 mm; Annual average of temperature: -1.2 °C
Precipitation
Average monthly temperature Max. average monthly temp. Min. average monthly temp.
Figure 2.Walter climate diagram for the station Kvikkjokk (time period 1890–2001).
temperature were generated from various gridded databases and another four modeled data sets for precipitation.
For both groups of data sets the monthly and seasonal (3 months) temperature means and monthly and seasonal pre-cipitation totals were assessed. All database properties and labels (abbreviations) of assessed data sets are specified in Table 1.
The NORDKLIM database contains homogenized data sets for 12 climate variables, recorded on 114 weather sta-tions distributed in Scandinavian countries, 48 of which are in Sweden Fig. 1. The database was compiled by the Swedish Meteorological and Hydrobiological Institute (Tuomenvirta et al., 2001). Two weather stations (Kvikkjokk and Jokkmokk) located 40 and 70 km away from locality Hårås and two other stations (Tjaamotis and Kiruna), lo-cated 18 and 110 km from it, were selected. For Tjaamotis and Kiruna only precipitation data sets (P18, P18agr, P110,
P110agr) were provided for the above-mentioned database
and both variables (temperature and precipitation data sets) were available for Kvikkjokk and Jokkmokk stations (T40, T40agr, P40, T70, P70).
Table 1.Properties of climatic databases and labels (abbreviations) of evaluated data sets.
Label of the data sets
Database properties Temperature Precipitation
Name1, Location/Distance/Grid, References (1902–2001) (1910–1997)
Month Season Month Season
Observ
ed 2, Tjaamotis (66◦550N 18◦320E)/18 km,3 – – P18 P18agr 2, Kvikkjokk (66◦570N 17◦440E)/40 km,3 T40 T40agr P40 – 2, Jokkmokk (66◦
370N 19◦380E)/70 km,3 T70 – P70 –
2, Kiruna (67◦490N 20◦200E)/110 km,3 – – P110 P110agr
Modeled
CRU TS 3.23, 0.5◦, Harris et al. (2014) T_CRU T_CRUagr P_CRU P_CRUagr GISS 250 T2m/SST anom, 1◦, Hansen et al. (2010) GISS – – – Luterbacher et al. Temperature, 0.5◦, Luterbacher et al. (2004) – LT – –
GPCC V7 0.5, 0.5◦, Schneider et al. (2015) – – GPCC –
Pauling et al. Precipitation, 0.5◦, Pauling et al. (2006) – – – PP
1Names of modeled databases related to Climexp.KNMI (2014),2NORDKLIM,3Tuomenvirta et al. (2001).
For monthly temperature means data from CRU TS 3.21 database (T_CRU) and anomalies from GISS 250 T2m/SST anom (GISS) with grid resolution 0.5 and 1◦, respectively, were generated. The anomaly is a difference between the ab-solute temperature value and the value of the long-term aver-age determined from the reference period. Seasonal temper-ature was generated from Luterbacher et al. (2004) database (LT) as well as another one data set was derived by aggre-gation of CRU TS 3.21 (T_CRUagr). The period overlap for all temperature databases was 100 years (between 1902 and 2001).
Monthly precipitation data sets were generated from GPCC V7 0.5◦ (GPCC), CRU 3.21 database (P_CRU), as well as from Pauling et al. (2008; PP) and aggregated CRU 3.21 database (P_CRUagr) for seasonal precipitation data sets. The assessed period for which all precipitation data sets were available extends from 1910 till 1997, i.e. 88 years. Grid resolution of all utilized precipitation gridded databases is 0.5◦.
2.3 Building mean tree-ring chronology
At Hårås locality, 20 increment cores were taken from spruce tree stems at a height of 1.3 m. After pre-processing of sam-ples, they were analyzed in WinDENDRO computer im-age analysis system. The analysis consisted of measuring tree-ring widths and their dating. The created tree-ring se-ries were synchronized with the regional curve derived from the tree-ring series, which showed the highest correlation. We used visual synchronization supported by a graphical method known as “skeleton plot” (Cropper, 1979). The se-ries was considered to be satisfactorily synchronized if the value of coefficient of parallelism (GLK) exceeded 70 %. Tree-ring series, which did not exceed this threshold, were excluded from further analyses. The occurrence of
poten-tial misdating of tree-ring series was evaluated by the soft-ware COFECHA (Grissino-Mayer, 2001). With regard to the open crown canopy of the stands, the high-frequency signal of mean chronology was detrended using a modified neg-ative exponential function. The final tree-ring chronology was performed with the method of robust double-weighted-averaging of tree ring indices that included the removal of temporal autocorrelation. The values of tree-ring indices were calculated using the formula of Cook and Kariuk-stis (1990). Basic descriptive statistics were calculated to as-sess the potential of measured tree ring series for its accurate dating and for extraction of climatic signal.
2.4 Statistical evaluation
The comparison of climate databases gives us information about the systematic and random error of the modeled cli-mate data. As reference data observed data sets of temper-ature means and precipitation totals were used, which were recorded at the weather stations and located the closest to Hårås, i.e. Tjaamotis and Kvikkjokk. For these locations were generated modeled data sets from gridded databases. From the differences between the modeled and observed data we calculated the mean error (e) and the standard error (SE). Studentt test was applied to test the significance of the sys-tematic error at 5 and 1 % significance levels. The final ac-curacy of the modeled data was quantified by root mean square error (RMSE). The above-described evaluation was performed separately for the mean temperature and precipi-tation totals and separately for monthly and seasonal climatic data sets. The observed seasonal data were derived by aggre-gating the observed monthly records.
(tempera-Table 2.Statistical evaluation of the differences between the ob-served and modeled data of monthly and seasonal temperatures (∗significant value atα=1 %). T40 data set is used as reference data.
Temperature
T_CRU GISS T_CRUagr LT
Mean bias [◦C] −1.43∗ −0.15∗ −1.43∗ −1.39∗ Mean error [◦C] ±0.69 ±1.56 ±1.17 ±1.19 Mean quadratic error [◦C] ±1.59 ±1.57 ±1.85 ±1.83
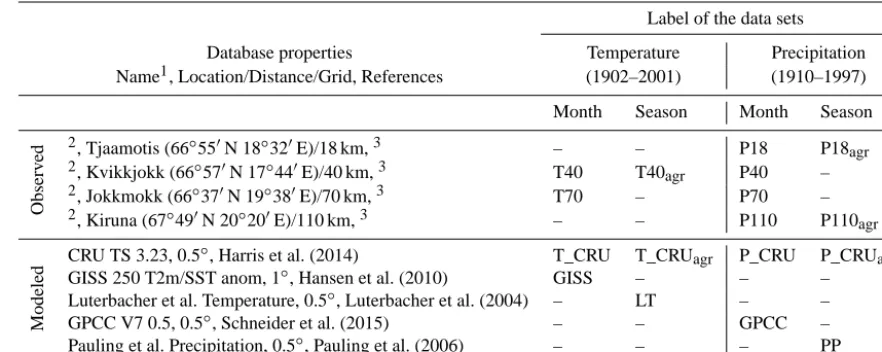
Table 3.Statistical evaluation of the differences between the ob-served and modeled data of monthly and seasonal precipitation to-tals (∗significant value atα=1 %). P18 data set is used as reference data.
Precipitation
P_CRU GPCC P_CRUagr PP
Mean bias [mm] 4.62∗ −0.73∗ 14.1∗ 15.75∗ Mean error [mm] ±5.12 ±6.77 ±17.05 ±31.84 Mean quadratic error [mm] ±6.90 ±6.81 ±22.07 ±35.52
ture, precipitation) and tree-ring indices within an 18-month long (April_preceding year to September) or a 7-season long (March–April–May_preceding year to September–October– November) dendroclimatic year. Student t test was used to evaluate the significance of the coefficients of correlation at 5 and 1 % significance level. With regard to the objective of the study, we compared the results of growth response de-rived from the observed climate data and from the modeled climate data sets. We wanted to reveal the cases with dif-ferent statistical significance of correlation coefficients com-pared toρ=0, caused by different climate databases and the significant differences between correlation coefficients de-rived for the same month or season, however using various climate databases. For evaluations thus created, regional tree ring chronology was considered as a reference data set.
3 Results
The results are subdivided to two sections, as they answer four groups of questions.
3.1 Comparison of climate databases
Question 1: what is the bias, precision, and overall accuracy of modeled data sets at the location of a weather station for monthly and/or seasonal average temperature and precipita-tion totals?
The differences between the modeled and observed cli-mate data were calculated separately for monthly and sea-sonal data of mean temperatures and precipitation totals. We analyzed the significance of deviation of the modeled data from the observed records, the presence of the random er-ror and the overall accuracy of the modeled data. Presented
statistics are valid for the specific combination of reference observed data and grid point of modeled data. It is due to a different scale of climatic information received by observed and modeled data. The grid point of modeled data repre-sent the same climatic value for the whole cell of grid (area 0.5◦×0.5◦or 1◦×1◦of latitude×longitude), and observed data are valid for the location of the weather station (one point). Maximum distance between grid point and weather station for this latitude is up to 30 or 60 km in the case of GISS database. For our evaluation the Kvikkkjokk weather station, as a temperature reference data set, is 11.6 km away from the nearest grid point of gridded databases and for Tjaamotis station (precipitation reference data) it is 9.4 km. The final values of the errors of the analyzed databases are presented in Tables 2 and 3.
In the case of mean temperature, T_CRU data set as well as T_CRUagr underestimated the monthly as well as sea-sonal data by 1.43◦C, and seasonal data LT by 1.39◦C, as documented by the values of mean error (e) in Table 2. The significance of bias was proved with the statistical test at α=1 % significance level. GISS data set was biased the least (−0.15◦C) due to its use of anomalies rather than absolute values. However the significance at 1 % level was also proved because of big sample size (n=1200). For the purpose of differences calculation, the GISS anomalies were recalcu-lated to absolute values using Kvikkjokk data set for refer-ence period 1950–1981 (Hansen et al., 2010).
The random error was quantified with the standard error of differences (SE). It describes the variation of the differences around the average differenceeand it is considered a mea-sure of precision of the modeled temperature data sets. The precision of the modeled monthly temperatures was found to be±0.69◦C (±27.26 %) for T_CRU data and±1.56◦C (±126 %) for GISS data. Precision of the seasonal data was ±1.19◦C (±46.49 %) for LT data and±1.17◦C (±46.57 %) for T_CRUagrdata set. The comparison of the relative
stan-dard errors shows that the monthly temperature data were approximately by 50 % more precise than the seasonal data. However, this comes from the fact that SE of the seasonal data was calculated from the differences, the number of which was probably two thirds smaller (n=400) than the amount of the monthly data (n=1200). The advantage of the database of the modeled seasonal temperatures is that it encompasses the reconstructed time series of more than 500 years (starting in the year 1500). If it had been possi-ble to calculate the differences for such a long time series, the mean error of the seasonal data would have probably de-creased.
The overall accuracy (RMSE) of the modeled monthly temperature data sets was ±1.59 and ±1.57◦C, and of the modeled seasonal temperature data it was ±1.83 and ±1.85◦C respectively.
Similar to temperature, the results of the statistical test proved a systematic deviation of the modeled data from the observed data. On the contrary to temperature, the modeled precipitation data sets mostly overestimated the observed records. In the monthly database, the P_CRU data biased the records by 4.62 mm (11 %) on average, while in the case of seasonal data the overestimation was 15.75 mm (12.5 %) for PP data and 14.1 mm for P_CRUagrdata, respectively. The
only GPCC data were underestimated by 0.73 mm. Bigger deviation of the seasonal data results from the nature of the data, since they were calculated as a sum of precipitation of 3 months in one season.
The standard error of the monthly precipitation data sets were ±5.12 mm (±11 %) for P_CRU and ±6.77 mm (±16 %) for GPCC. The precision of seasonal data sets amounted to ±31.84 mm (±22 %) for PP and ±17.05 mm (±12 %) for P_CRUagr data, respectively. The final accuracy of the modeled monthly and seasonal data sets of precipita-tion totals is presented in Table 3.
Based on results presented in Table 3, we conclude 99 % confidence that the modeled data of both climatic variables were significantly different from the observed data. This bias can be eliminated from the data by extracting the mean de-viation value (e) from every value of the modeled climatic series. Bigger variability of differences for modeled and ob-served data around its average difference was found in GISS temperature data set (±126 %).
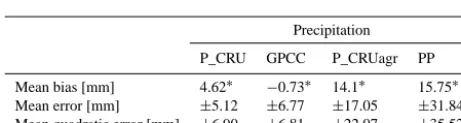
Question 2: how does the tightness of correlation change between modeled and observed climate data sets with in-creasing distance of weather station from the locality of radial increment formation? Does this correlation decrease faster with increasing distance of weather station for precipi-tation data sets due to its higher spatial variability compared to temperature?
At this section of results the correlation was examined be-tween the monthly data observed at the weather stations and the modeled data generated for the location of Hårås by the KNMI Climate Explorer application. The correlation was ex-amined on the sample size 1056 records. We investigated the correlation changes for modeled data with increasing dis-tance of the weather station to the Hårås locality.
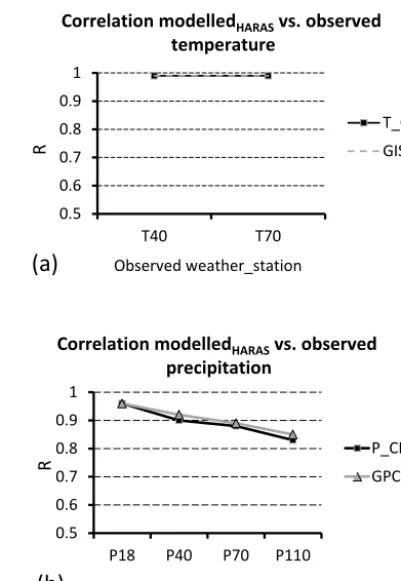
The relationship between the monthly temperatures of var-ious climate databases is shown in Fig. 3a. For the both modeled data (T_CRU, GISS) we revealed equal strength of correlation (r=0.99) within the data (T_40, T_70) of both weather stations (Kvikkjokk, Jokkmokk) located 40 and 70 km from Hårås. It means that 98 % (r2=0.98) of vari-ability of modeled temperature data can be explained by data of both used weather stations and the increasing distance of about 30 km between weather stations does not significantly influence the tightness of correlation.
The correlation between the databases of monthly precipi-tation totals was lower than that of temperature. The variance of the modeled precipitation data sets (P_CRUGPCC) ex-plained by the data observed at four weather stations (P_18,
0.5 0.6 0.7 0.8 0.9 1
T40 T70
T_CRU GISS
R
Correlation modelledHARAS vs. observed
temperature
Observed weather_station
(
a)
0.5 0.6 0.7 0.8 0.9 1
P18 P40 P70 P110
P_CRU GPCC
R
Correlation modelledHARAS vs. observed
precipitation
Observed weather station
(
b)
Figure 3. Change of correlation coefficients between (a) mod-elled monthly temperatures for Haras locality (T_CRU and GISS) and observed monthly temperatures (T40 and T70), (b) modelled monthly precipitation for Haras locality (P_CRU and GPCC) and observed monthly precipitation (P18, P40, P70 and P110), related to increasing distance of weather stations from Haras locality.
-0.50 -0.40 -0.30 -0.20 -0.100.00 0.10 0.20 0.30 0.40 0.50 ap _p re mj_ pre jn _p re jl_ pre au _p re se_p re ok _p re no _pr e de _pr
e ja fe ma ap mj jn jl au se
T_CRU T40 T70 GISS 99 % 95 % Spruce - growth response to temperature
Cor re la tion coe ff. Months ;a) -0.50 -0.40 -0.30 -0.20 -0.100.00 0.10 0.20 0.30 0.40 0.50 0.60 LT T40agr T_CRUagr 99 % 95 % Spruce - growth response to temperature
Cor re la tion coe ff. Seasons ;b)
Figure 4.Growing response of spruce radial increment to data sets of (a) monthly mean temperature, (b) seasonal mean temperature.
greater spatial variability of precipitation variable compared to temperature.
3.2 Comparing the suitability of the climatic databases for dendroclimatic analyses
Question 3: what is the growing response of spruce to monthly and/or seasonal temperature and precipitation? The climate of which months and/or seasons is significant (posi-tively or nega(posi-tively) for radial increment formation? Which of the two examined climatic variables is the more impor-tant factor for radial increment formation? Are there any sig-nificant differences between climate databases regarding the analysis of growing response of spruce?
Derived mean indexed chronology from measured tree-ring widths (radial increment) of spruce are considered a ref-erence data for comparison of suitability of climate databases for dendroclimatic analysis. Eighteen individual tree-ring se-ries with GLK > 70 % were selected to derive mean chronol-ogy. The check of measured series in software COFECHA has detected no crucial errors and misdated series. Series inter-correlation of mean chronology was 0.729 and aver-age mean sensitivity 0.204. Based on the statistics, we con-sider cross-dating process to be successful enough and de-rived mean indexed chronology has a high potential for ex-traction of climate signal.
The first step was to evaluate the cross-correlation func-tion derived from the mean indexed chronology and individ-ual climate data sets. The values of correlation coefficients presented in Fig. 4 quantify the tightness and the trend of the relationship between the indices of radial increment and the mean of monthly (Fig. 4a) or seasonal (Fig. 4b) temperatures within the 18-month long or 7-season long dendroclimatic year. The values of the correlation coefficients were tested at α=1 and 5 % significance level.
From Fig. 4a we can see that the radial increment was significantly negatively correlated with the temperatures in June and August of the preceding year at the levelα=5 % and in July of the preceding year at 1 % significance level. This means that with 99 % confidence, high values of tem-peratures in July of the preceding year negatively affected increment formation in the next year. On the other hand, tem-peratures in the summer season in the year of increment for-mation were positively correlated with the amount of incre-ment. Particularly June and July were the months that signif-icantly promoted the formation of the radial increment at 1% significance level. However, the differences between growth responses of spruce depending on the database used were not revealed with only two exceptions. The exceptions were presented in the observed data set T_40 and T_70. August of preceding year for T_70 was not considered significant (r=0.18) for radial increment formation in contrast with all the other databases and vice versa; December of the preced-ing year was significant atα=5 % but only for T_40 data set (r=0.20). Real differences of the correlation coefficients with the other databases, however, were less than1r≤0.03 (August_preceding) and 1r≤0.07 (December_preceding) respectively.
Similar results can be interpreted from Fig. 4b. Aggre-gation of monthly climate data to the seasons has removed the small differences between databases in the months men-tioned above. The radial increment is significantly negatively affected (α=1 %) by high temperatures in the season JJA of preceding year and vice versa; it is significantly positively affected by JJA temperature in the year of increment forma-tion. No differences in interpreting the growth response of spruce were found and no significant differences between the values of correlation coefficients depending on used climate database were detected.
con--0.40 -0.30 -0.20 -0.10 0.00 0.10 0.20 0.30 0.40
ap
_p
re
mj_
pre
jn
_p
re
jl_
pre
au
_p
re
se_p
re
ok
_p
re
no
_pr
e
de
_pr
e ja fe
ma ap mj jn jl au se
P_CRU P18 P40 P70 P110 GPCC 99 % 95 %
Spruce - growth response to precipitation
Cor
re
la
tion
coe
ff.
Months
;a)
-0.40 -0.30 -0.20 -0.10 0.00 0.10 0.20 0.30 0.40
PP P18agr P110agr P_CRUagr 99 % 95 %
Spruce - growth response to precipitation
Cor
re
la
tion
coe
ff.
Seasons
;b)
Figure 5.Growing response of spruce radial increment to data sets of (a) monthly precipitation totals, (b) seasonal precipitation totals.
firmed by two of the four compared data sets, namely mod-eled PP data and observed P_110agr data set. It is a surprising finding since the data observed the furthest away (110 km) from the locality of increment formation were more tightly correlated (r= −0.25) with data observed 18 km from Hårås (r= −0.09).
Monthly precipitation databases most closely correlate with the radial increment in May of the preceding year and in May and June the year of increment formation. For all those months and concerned data sets, the significant effect on in-crement formation was confirmed at 5 % significance level or even at 1 % level for the May of the actual year (Fig. 5a).
Regarding the interpretation of the growth response of spruce to precipitation within the mentioned significant months, its significance confirmed only two of the six data sets (Fig. 5a), modeled P_CRU and observed P110 data set. The result observed on seasonal precipitation totals was re-peated itself for P110 data set. The overall highest correla-tion coefficient (r= −0.32), i.e. in May of the actual year, occurred for the data observed at the most remote station (Kiruna), while precipitation at the nearest station (Tjaamo-tis) correlated only withr= −0.15.
The highest difference between correlation coefficients de-rived with all six precipitation data sets for 1 month was 1r=0.18. With sample size equaled 88 records per month, the difference is statistically significant at α=0.22.
There-(
a)
(
b)
Figure 6.Correlation between temperature and precipitation com-mon with overlapping (a) com-month (June), (b) season (JJA) signifi-cant for radial increment formation. Low correlation between the climatic variables in both cases (r=0.12 andr=0.11) confirms that climate regime for growing processes of spruce is not an in-versely proportional function of precipitation and temperature.
fore no significant difference of correlation coefficients could be recognized at conventional significance levelsα=5 % or α=1 %. This applies to all differences derived on the base of cross-correlation functions of all temperature and precipita-tion data sets examined at our study.
Higher correlation coefficients derived by cross-correlation function for the average temperature within the area of interest point to it as more limiting factor for the radial increment formation of spruce compared to precipitation. The highest correlation coefficient r=0.44 for monthly temperature data was obtained from a modeled T_CRU data set in June and from an LT data set in the JJA season asr=0.48. For comparison, the correlation of increment and precipitation rendered the highest correlation coefficients r= −0.32 in May as mentioned above and r=0.27 for modeled PP data set in the MAM season of the preceding year.
For the monthly data sets, temperature and precipitation have inverse trends with regard to increment formation in June (Figs. 4a and 5a). Similarly inverse trend could be ob-served for the JJA season (Figs. 4b and 5b). We investigated climate regime of the study area by correlating mean tem-perature and precipitation totals from the data sets with the tightest relationship to radial increment formation (Fig. 6a and b). Low correlation between the climatic characteristics in both cases (r=0.12 andr=0.11) confirms that climate regime for growing processes of spruce is not inversely pro-portional function of precipitation and temperature.
4 Discussion and conclusions
Our suitability assessment of different climate databases for the purpose of dendroclimatic analyzes was based on explor-ing the relationships between variability of climate data and measured radial increment of spruce. Differences between the absolute values of the climatic variables (temperature, precipitation) of gridded databases and data observed at the weather stations (Kvikkjokk and Tjåmotis) were also evalu-ated. It was revealed that all four gridded databases of tem-perature and four databases of precipitation had systematic errors of different magnitude. All modeled temperature data sets underestimated the values observed at the Kvikkjokk station. The lowest bias (−0.15◦C) was found in the GISS database. This low value is due to the fact that the GISS database unlike the other ones contains anomalies of temper-ature and absolute values have been recalculated using data of Kvikkjokk station.
On the contrary, the precipitation databases, except for GPCC, overestimated the data observed at Tjåmotis precipi-tation sprecipi-tation. GPCC underestimated observed monthly pre-cipitation totals by the lowest mean error−0.73 mm and the lowest bias (14.1 mm) among examined seasonal databases, as seen in aggregated CRU database of precipitation totals (P_CRUagr).
We assume that the different scale of information provided by gridded database and observed data set is the main source of the bias. Depending on the grid resolution, the values in the gridded database represent uniform values for the whole grid square of 0.5◦×0.5◦, or 1◦×1◦for GISS, respectively, although in reality there are differences in the values of cli-matic variables also inside such area. For the purposes of the application of the absolute values of climatic variables, e.g. finding the optimal climatic conditions for the radial incre-ment formation, it is possible to use any of the modeled data sets. But it is necessary to identify and eliminate its system-atic error. Bias can be extracted from the databases by sub-tracting the mean error from every value in the database.
In case of availability of satisfactory reference data, the database containing anomalies of climatic variables en-ables another method of bias elimination, such as the GISS database of temperature anomalies used in our work. The
cli-mate data expressed in this way enable a significant reduc-tion or even a complete eliminareduc-tion of systematic errors from the modeled data. Some more databases containing tempera-ture anomalies can be found at the KNMI Climate Explorer, for example CRUTEM 4.2.0.0 (Osborn and Jones, 2014) and HadCRUT4 (Morice et al., 2012). The disadvantage of those databases is lower grid resolution of 5◦×5◦. Here it is nec-essary to note that the bias of climate data does not affect the evaluation of the growth response of spruce. In order to correctly assess the impact of temperature and precipitation on the formation of radial increment it is important to en-sure that the variability of the time series of the considered climatic variables corresponds with the variability of the cli-mate at the place of increment formation.
Due to this fact, we analyzed the correlation of the ex-amined climate variables between all modeled monthly data generated for point of grid with location of Hårås and the data observed at the nearby weather stations. The compar-ison revealed that the modeled precipitation data correlated less than the temperature data at all four precipitation sta-tions. It must be pointed out, however, that the nearest pre-cipitation station was only 18 km away from Hårås, while the nearest station with the observed temperature was at a dis-tance of 40 km. Decreasing trend of correlation coefficients with increasing distance (18, 40, 70, 110 km) of precipita-tion staprecipita-tions, together with stable values of correlaprecipita-tion coef-ficients for temperatures observed 40 and 70 km from Hårås (Fig. 3) confirmed the well-known fact that precipitation is in the space more variable than temperature. This is also accounted for during the development of modeled climate databases. For example, the interpolation of precipitation val-ues was performed within a smaller radius per one grid point than the interpolation of temperatures in CRU database. In the case of precipitation, the correlation decreases faster as the distance increases, which is expressed by CDD (correla-tion decay distance) value during the selec(correla-tion of the sta(correla-tions for the interpolation of the grid point (Harris et al., 2014).
Comparison of effects of both climatic variables on the creation of radial increment of spruce has confirmed the dominance of the temperature signal. This is in coincidence with the results of Babst et al. (2013), who among others evaluated the impact of precipitation and temperature on spruce increment formation in the boreal zone of northern Scandinavia.
the observed and the modeled data. We can recommend CRU database for dendroclimatic analysis when observed data are not available. GISS database did not demonstrate statistically significant difference, but the trend in lower correlation co-efficients in all 3 months responsible for the increment for-mation may relate to lower grid resolution of the database (1◦×1◦). Confirmation of that hypothesis has to be exam-ined by further research.
Also the evaluation of seasonal temperature databases did not show any significant differences in growth response of spruce compared with observed data and therefore Luter-bacher et al. (2004) database and aggregated database of CRU can also be recommend for their use in dendroclimatic analysis.
The growth response of spruce to precipitation totals was less definite. The significance of correlation coefficients for relation precipitation versus increment was confirmed just with 95 % confidence and only for two of six examined databases of monthly precipitation. CRU database positively correlated with increment in May of the preceding year and negatively in May of the year of increment formation. The same negative correlation was observed in the data set of the Kiruna weather station located 110 km from Hårås. In addi-tion, a significant negative correlation was established for it in June.
Although the differences between correlation coefficients of the precipitation databases are bigger than those of tem-perature databases, none of them can be considered at a con-fidence level higher than 78 %. Therefore none of them can be singled out as the best option. However, it can be seen that the correlation coefficients of modeled databases range between coefficients of observed data sets. Based on our re-sults we recommend that, within areas featuring only a sparse network of weather stations, examined precipitation gridded databases (CRU, GPCC) can be employed for the purpose of dendroclimatic analysis.
It was shown that in two seasons with significant correla-tions (spring of the preceding year and summer of the cur-rent year), the PP gridded database reached the highest cor-relation coefficient despite the fact that none of the data ob-served achieved such high coefficients. This could be due to the fact that PP database represents a restored 502-year long database, created by means of dendrochronological data (Pauling et al., 2006) as well. Because of that, using this database in dendroclimatic analysis could overestimate cor-relations concerning the radial increment formation of trees, but it should be inspected in more detail.
Finally, based on our results we could not reject the hy-pothesis that the climate data from the nearest weather sta-tions are the most suitable for the purposes of dendroclimatic analysis. This is particularly true for precipitation data that are more variable in space than temperature.
Data availability
The data sets of the gridded climate databases are pub-licly available for; CRU TS 3.23 (Harris et al., 2014) at https://crudata.uea.ac.uk/cru/data/hrg/cru_ts_3.23/, for GISS 250 T2m/SST anom (Hansen et al., 2010) at https://climexp.knmi.nl/select.cgi?id=someone@ somewhere&field=giss_temp_250, for Luterbacher et al. Temperature (Luterbacher et al., 2004) at https: //crudata.uea.ac.uk/cru/projects/soap/data/recon/#luter04, for CPCC V7 (Schneider et al., 2015) at ftp://ftp.dwd.de/ pub/data/gpcc/html/fulldata_v7_doi_download.html and Pauling et al. Precipitation (Pauling et al., 2006) at https: //www.ncdc.noaa.gov/cdo/f?p=519:1:::::P1_study_id:6342.
The Supplement related to this article is available online at doi:10.5194/esd-7-385-2016-supplement.
Acknowledgements. This work was accomplished as a part of the projects of the Scientific grant agency of the Ministry of Education of the Slovak Republic, VEGA no.: 1/0281/11, 1/1130/12, 1/0008/13, 1/0463/14, 2/0101/14, 1/0589/15, 1/0367/16 and the projects of the Slovak Research and Development Agency no.: 0423-10, 0131-11, 0303-11, APVV-0480-12 and APVV-0069-12. The authors thank the agencies for the support.
Edited by: C. Franzke
References
Babst, F., Poulter, B., Trouet, V., Tan, K., Neuwirth, B., Wilson, R., Carrer, M., Grabner, M., Tegel, W., Levalic, T., Panayotov, M., Urbinaci, C., Bouriaud, O., Iais, P., and Frank, D.: Site and species-specific responses of forest growth to climate across to European continent, Global Ecol. Biogeogr., 22, 706–717, 2013. Büntgen, U., Esper, J., Verstege, A., Nievergelt, D., Frank, D. C., and Wilson, R. J. S.: Growth responses to climate in a multi-species tree-ring network in Western Carpathian Tatra Moun-tains, Poland and Slovakia, Tree Physiol. 27, 689–702, 2007. Büntgen, U., Franke, J., Frank, D., Wilson, R., González-Rouco, F.,
and Esper, J.: Assessing the spatial signature of European climate reconstructions, Clim. Res., 41, 125–130, 2010.
Büntgen, U., Kyncl, T., Ginzler, C., Jacks, D. S., Esper, J., Tegel, W., and Kyncl, J.: Filling the Eastern European gap in millennium-long temperature reconstructions, P. Natl. Acad. Sci. USA, 110, 1773–1778, 2013.
Climexp.KNMI: Climate explorer, http://climexp.knmi.nl, last ac-cess: 18 April 2014.
Cook, E. R. and Kairiukstis, L. A.: Methods of Dendrochronology: Aplications in the Environmental Sciences, Dordrecht: The Inter-national Institute for Applied Systems Analysis, 394 pp., 1990. Cowtan, K. and Way, R. G.: Coverage bias in the HadCRUT4
Cropper, J. P.: Tree-ring skeleton plotting by computer, Tree-Ring Bulletin, 39, 47–54, 1979.
Gouirand, I., Linderholm, H. W., Moberg, A., and Wohlfarth, B.: On the spatiotemporal characteristics of Fennoscandian tree-ring based summer temperature reconstruction, Theor. Appl. Clima-tol., 91, 1–25, 2007.
Grissino-Mayer, H. D.: Evaluating crossdating accuracy: Manual and tutorial for the computer program COFECHA, Tree-Ring Res., 57, 205–221, 2001.
Grudd, H., Briffa, K. R., Karlén, W., Bartholin, T. S., Jones, P. D., and Kromer, B.: A 7400-year tree-ring chronology in northern Swedish Lapland: natural climatic variability expressed on an-nual to millennial timescales, Holocene, 12, 657–667, 2002. Hansen, J., Ruedy, R., Sato, M., and Lo, K.: Global
sur-face temperature change, Rev. Geophys., 48, RG4004, doi:10.1029/2010RG000345, 2010.
Harris, I., Jones, P. D., Osborn, T. J., and Lister, D. H.: Up-dated high-resolution grids of monthly climatic observations – the CRU TS3.10 Dataset, Int. J. Climatol., 25, 623–642, doi:10.1002/joc.3711, 2014.
Haylock, M. R., Hofstra, N., Klein Tank, A. M. G., Klok, E. J., Jones, P. D., and New, M.: A European daily high-resolution gridded dataset of surface temperature and precipitation, J. Geo-phys. Res.-Atmos., 113, D20119, doi:10.1029/2008JD010201, 2008.
Holtmeier, F. K. and Broll, G.: Sensitivity and response of north-ern hemisphere altitudinal and polar treelines to environmental change at landscape and local scales, Global Ecol. Biogeogr., 14, 395–410, 2005.
Luterbacher, J., Dietrich, D., Xoplaki, E., Grosjean, M., and Wan-ner, H.: European Seasonal and Annual Temperature Variabil-ity, Trends, and Extremes Since 1500, Science, 303, 1499–1503, doi:10.1126/science.1093877, 2004.
Mitchel, T. D. and Jones, P. J.: An improved method of constructing a database of monthly climate observations and associated high-resolution grids, Int. J. Climatol., 25, 693–712, 2005.
Morice, C. P., Kennedy, J. J., Rayner, N. A., and Jones, P. D.: Quan-tifying uncertainties in global and regional temperature change using an ensemble of observational estimates: The HadCRUT4 data set, J. Geophys. Res., 117, 1–22, 2012.
Osborn, T. J. and Jones, P. D.: The CRUTEM4 land-surface air temperature data set: construction, previous versions and dis-semination via Google Earth, Earth Syst. Sci. Data, 6, 61–68, doi:10.5194/essd-6-61-2014, 2014.
Pauling, A., Luterbacher, J., Casty, C., and Wanner, H.: Five hun-dred years of gridded high-resolution precipitation reconstruc-tions over Europe and the connection to large-scale circulation, Clim. Dynam., 26, 387–405, doi:10.1007/s00382-005-0090-8, 2006.
Schneider, U., Becker, A., Finger, P., Meyer-Christoffer, A., Rudolf, B., and Ziese, M.: GPCC Full Data Reanaly-sis Version 7.0 at 0.5◦: Monthly Land-Surface Precipitation from Rain-Gauges built on GTS-based and Historic Data, doi:10.5676/DWD_GPCC/FD_M_V7_050, 2015.
Tuomenvirta, H., Drebs, A., Førland, E., Tveito, O. E., Alexan-dersson, H., Laursen, E. V., and Jónsson, T.: Nordklimdata set 1.0, KLIMA Report no. 08/01, DNMI, 26 pp., http://www.smhi. se/hfa_coord/nordklim/index.php?page=dataset (last access: 16 January 2016), 2001.