NEURAL NETWORK BASED RAINFALL
PREDICTION
Iram Naim
1, Nalini Maheshwari
2, Priyanka Gangwar
3 1 2 3Department of Computer Engg & Information Tech, M.J.P. Rohilkhand University,
Bareilly, U.P., (India)
ABSTRACT
Flooding is a severe natural hazard with potentially devastating consequences, giving rise to many losses of human life and property worldwide. One of the primary factors of flooding is “Rainfall”. In this paper we are trying to predict upcoming Rainfall data on the basis of previously recorded rainfall data. For this propose we use artificial neural network. To train neural network we provide multiple districts’ rainfall data and a desired overall data. Then, this system learns weights for the neural network to predict a list that matches the desired overall rainfall data of those districts. For training purpose of neural network we take 25 different districts of Tamil Nadu state. All the data is from India water web portal. To compute performance of system we use mean squared error (MSE) and Root mean squared error (RMSE) between predicted rainfall data and actual rainfall data.
Keywords
:
Rainfall Prediction, Supervised Learning, Artificial Neural Network, Flood
Forecasting.
I. INTRODUCTION
Floods can occur anywhere after heavy rain. All flood plains are vulnerable and heavy storms can cause flash flooding in any part of the world. One of the prime factor of flooding is “Rainfall”. In this paper we are trying to predict upcoming Rainfall data on the basis of previously recorded rainfall data.This is based on artificial neural networks. ANNs are commonly used to model complex relationships between inputs and outputs or to find patterns in the given data [1]. The neural network based system provides prediction by learning neural network weights for combining the different individual list of the rainfall data on the basis of the training data. For the training of neural network, system is provided with multiple districts rainfall data and a desired overall data. Then, this system learns weights for the neural network to predict a list that matches the desired overall rainfall data of those districts.
As the multilayer perceptrons are considered as universal approximators [2], we used a multilayer perceptron. Multilayer feed forward neural network popularly called as multilayer perceptrons consists of multiple layers of computational units, usually interconnected in a feed-forward way[3]. In this work, we try to predict monthly average state rainfall data by using previous rain fall data. For training purpose of neural network we take 25 different districts of Tamil Nadu state. All the data is from India water web portal. To compute performance of system we use mean squared error (MSE) and Root mean squared error (RMSE) between predicted rainfall data and actual rainfall data.
95 | P a g e implementation as compare to sensor networks, GIS (geography information systems), satellites, mobile phones and SMS text messages, etc which are very costly. The predicted rainfall data can be further used for flood forecasting.
This paper is organized as follows. In section 2, we briefly look at the background and related work. In section 3, we briefly review the theoretical details of neural network and related terminologies. We show our experimental results in section 4. Finally, we conclude in section 5.
II. BACKGROUND AND RELATED WORK
Lets us begin with some useful definitions and notations used in this paper. Then, we discuss the previous work done in the area of flood forecasting.
2.1 Usefull Definitions
2.1.1 Cross Validation: Cross-Validation is a statistical method of evaluating and comparing learning
algorithms by dividing data into two segments: one used to learn or train a model and the other used to validate the model. In typical cross-validation, the training and validation sets must cross-over in successive rounds such that each data point has a chance of being validated. The basic form of validation is k-fold cross-validation. Other forms of cross-validation are special cases of k-fold cross-validation or involve repeated rounds of k-fold cross-validation.
2.1.2 Mean squared error (MSE)
If is a vector of n predictions, and is the vector of the true values, then the (estimated) MSE of the
predictor is:
2.1.3 Root Mean squared error (RMSE)
The RMSD of predicted values for times t of a regression's dependent variable is computed for n different predictions as the square root of the mean of the squares of the deviations:
2.2 Related Work
There are a good number of studies performed on flood warning or forecasting in the past. “Model-Based Monitoring for Early Warning Flood Detection, SenSys”[4], define use of artificial neural network models to predict the onset of floods. “An Intelligent Grid-Based Flood Monitoring and Warning System[5] describes a wireless sensor network for flood warning which is capable of integrating with remote fixed-network grids for computationally-intensive flood modeling purposes. “Neural Net Water Level Trend Prediction and Dynamic Water Level Sampling Frequency”[6]Presents an alternative approach in which the river network is modeled as a cascade of interconnected input-output systems.
“An adaptive predictive approach for river level forecasting”[7] define no need of topographic information on
Processes”[8] uses BP neural network was used to construct a soft measurement approach to monitor the
effluent COD and BOD in wastewater treatment processes. “A Simple Flood Forecasting Scheme Using Wireless Sensors Networks” [9] uses multiple variable robust linear regression and designed using wireless
sensor network. “Validation of a TRMM-based global flood detection system in Bangladesh”[10] define tropical rainfall measurment mission that utilise a microwave imager. “Artificial Neural networks For flood forecasting
at Dongola Station in the river Nile Sudan”[11] uses ANNs as a modeling tool. “An artificial neural network model for flood simulation using GIS: Johor river basin, Malayasia” [12], presents flood maps in geographic information system.
III. NEURAL NETWORK BASED RAINFALL PREDICTION SYSTEM
In this section, we first discuss the basics of artificial neural networks then we discuss the details of the rainfall prediction system based on the neural network.
3.1 Artificial Neural Network
An artificial neural network (ANN), often just called a neural network is a mathematical model or computational model based on biological neural networks. It consists of an interconnected group of artificial neurons and processes information using a connectionist approach to computation. ANNS are usually used to model complex relationships between inputs and outputs or to find patterns in the given data. [1]
Multilayer Feed forward neural network was the first and simplest type of artificial neural network devised. In this network, the information moves in only one direction, forward, from the input nodes, through the hidden nodes (if any) and to the output nodes[2]. Multilayer feed forward neural network popularly called as multilayer perceptrons consists of multiple layers of computational units, usually interconnected in a feed-forward way. Back propagation is a popular method of training multilayer feed forward ANNs.
An ANN is typically defined by three types of parameters:
1) The interconnection pattern between the different layers of neurons. 2) The learning process for updating the weights of the interconnections.
3) The activation function that converts a neuron's weighted input to its output activation.
The back propagation algorithm uses supervised learning, which means that we provide the algorithm with examples of the inputs and outputs. We want the network to compute the error (difference between actual and expected results). The artificial neurons, which are organized in different layers, send their signals “forward”, and then the errors are propagated backwards [3].
Each propagation involves the following steps:
1. Forward propagation of a training pattern's input through the neural network in order to generate the propagation's output activations.
2. Back propagation of the propagation's output activations through the neural network using the training pattern's target in order to generate the deltas of all output and hidden neurons.
For each weight-synapse:
1. Multiply its output delta and input activation to get the gradient of the weight.
2. Bring the weight in the opposite direction of the gradient by subtracting a ratio of it from the weight.
97 | P a g e Repeat the phase 1 and 2 until the performance of the network is good enough.
3.2 Rainfall prediction using Neural Network
Design of ANN consist of one Input layer, two Hidden layer and one Output layer. Input layer consist of four neurons, first Hidden layer consist of five neurons, second Hidden layer consist of ten neurons and output layer has only one neurons illustrated in fig 3.1.
Fig3.1: Design of MLP
A neural network has to be configured such that the application of a set of inputs produces (either 'direct' or via a relaxation process) the desired set of outputs. Various methods to set the strengths of the connections exist. One way is to set the weights explicitly using prior knowledge. Another way is to 'train' the neural network by feeding it teaching patterns and letting it change its weights according to some learning rule. Here we use the first approach i.e. we provide target output values on the basis of which MLP will be trained by using given set of input and generate set of weights on intermediate nodes. These weights will further used to categorize test examples.
We use Multi-layer perceptron as feed forward neural network to train our system. To provide values to the input nodes of neural network we use first 4 column which denotes 4 years rainfall data ( i.e. Y1, Y2, Y3, & Y4) and for target output last 5th column (i.e. Y5) is used. As we know the rainfall measuring units are millimeter, inch and gauge. We have data available in inch. For providing value to neural network we normalized all the data by using normalization formula:
V’ = [(V-minA)/(maxA-minA)
Where,
minA = is the minimum value along particular column, maxA = is the maximum value along particular column, V = Original value,
V’ = Normalized value.Table 3.1 and 3.2 shows actual rainfall data and normalized values of same data
IV. EXPERIMENTS AND RESULTS
We have gathered the data from India water Portal which contains the rainfall data from 2004 to 2010. This includes the data for 28 state (with its all districts) and 7 union territories. In our work we use the data of Tamil Nadu state including its 25 districts out of 30 districts as a training set. These districts are Chennai, Coimbaotre, Cuddalore, Dharmapuri, Dindigul, Erode, Kanchipuram, kanyakumari, karur, krishnagiri, Madurai, Nagapatinam, Namakkal, Niligiri, Perambulur, Pudukottai, Ramanathapuram, Salem, Sivaganga, Thanjavur, thaeni, Tirunelveli, Triuvallur, Trichy and vellore.
We take the rainfall data of each state normalize the values build 25 different tables as T1,T2…….T25. One of
the sample table of a district having rainfall data is shown in table 4.1 and normalized values of rainfall data is shown in table 4.2.
As described in section 3.2 we provide first 4 coloumn which denotes 4 years rainfall data which is data of year 2004, 2005, 2006 and 2007 ( i.e. Y1, Y2, Y3, & Y4) and for target output last 5th column which is data of year 2008 (i.e. Y5) is used. For the calculation of desired output we train the network by providing normalized table of rainfall data. After training of neural network we obtain a set of weights of intermediate node. We store these weights in a file and these will be used to find unavailable rainfall data for upcoming years. Sample file of weights is shown in fig 4.1.
We performed 5 fold cross validation with training set. To perform 5 fold cross validation we divide 25 tables (T1, T2……..T25) into 5 equal groups having 5 district data in each group. We already calculate normalized
rank table of all 25 districts as in table 4.2. By using these groups we form 5 different sets for Training, Validation and Testing purpose of Neural Network and to perform 5 fold Cross- Validation of the obtained results.
After performing cross validation our Neural Network is now fully trained to categorize any new example. So, for any new rainfall data we can use obtained weights (say W) of Neural Network to get an output list for a particular year which is close to the actual rainfall data.
As a test set we take two years data (i.e. year 2009 and 2010) for prediction from this model. To predict the outcomes of rainfall for year 2009 we provide previous four years data to the designed MLP apply the obtained weights after training and get an output list (T1). This list represents predicted rainfall data for the year 2009. Similarly we can obtain rainfall
99 | P a g e
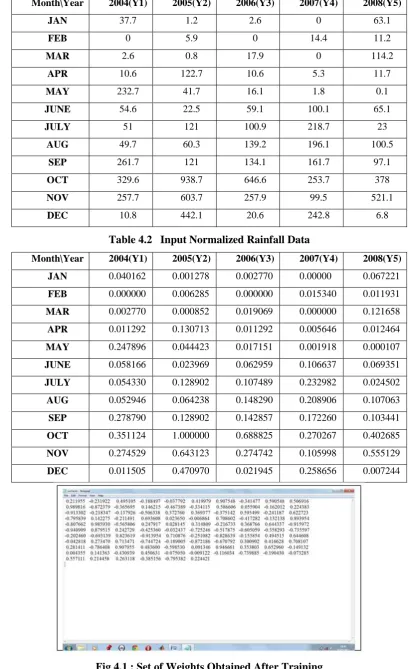
Table 4.1 Input Rainfall Data
Table 4.2 Input Normalized Rainfall Data
Month\Year 2004(Y1) 2005(Y2) 2006(Y3) 2007(Y4) 2008(Y5)
JAN 0.040162 0.001278 0.002770 0.00000 0.067221
FEB 0.000000 0.006285 0.000000 0.015340 0.011931
MAR 0.002770 0.000852 0.019069 0.000000 0.121658
APR 0.011292 0.130713 0.011292 0.005646 0.012464
MAY 0.247896 0.044423 0.017151 0.001918 0.000107
JUNE 0.058166 0.023969 0.062959 0.106637 0.069351
JULY 0.054330 0.128902 0.107489 0.232982 0.024502
AUG 0.052946 0.064238 0.148290 0.208906 0.107063
SEP 0.278790 0.128902 0.142857 0.172260 0.103441
OCT 0.351124 1.000000 0.688825 0.270267 0.402685
NOV 0.274529 0.643123 0.274742 0.105998 0.555129
DEC 0.011505 0.470970 0.021945 0.258656 0.007244
Fig 4.1 : Set of Weights Obtained After Training
Month\Year 2004(Y1) 2005(Y2) 2006(Y3) 2007(Y4) 2008(Y5)
JAN 37.7 1.2 2.6 0 63.1
FEB 0 5.9 0 14.4 11.2
MAR 2.6 0.8 17.9 0 114.2
APR 10.6 122.7 10.6 5.3 11.7
MAY 232.7 41.7 16.1 1.8 0.1
JUNE 54.6 22.5 59.1 100.1 65.1
JULY 51 121 100.9 218.7 23
AUG 49.7 60.3 139.2 196.1 100.5
SEP 261.7 121 134.1 161.7 97.1
OCT 329.6 938.7 646.6 253.7 378
NOV 257.7 603.7 257.9 99.5 521.1
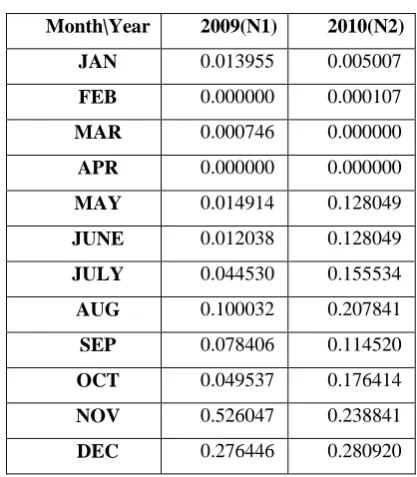
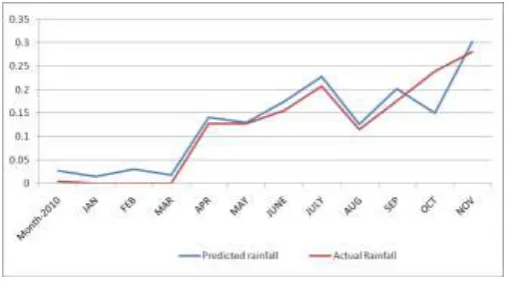
To analyze the performance of our proposed system we compare the obtained rainfall data with actual rainfall data of year 2009 and 2010. We calculate mean square error (MSE) and root mean square error (RMSE) of these two lists. Table 4.3 defines the obtained result list for year 2009 and 2010. Table 4.4 defines the actual values and table 4.5 shows its normalized value for year 2009 and 2010. Table 4.6 represents the value of MSE and RMSE. The performance of system is represented by graph (figure 4.2 and 4.3) between obtained rainfall data and actual rainfall data of year 2009 and 2010.
Table 4.3: Obtained rainfall data
Month\Year 2009 (T1) 2010 (T2)
JAN 0.02989238 0.02657086
FEB 0.01072381 0.01407124
MAR 0.01291153 0.02996665
APR 0.01407125 0.01791647
MAY 0.02516095 0.14033721
JUNE 0.04740029 0.12913954
JULY 0.05539278 0.174188758
AUG 0.110021995 0.227257488
SEP 0.096980176 0.12570034
OCT 0.064233938 0.201132414
NOV 0.236955712 0.149749712
DEC 0.291142939 0.30170461
Table 4.4: Actual rainfall data
Month\Year 2009 2010
JAN 13.1 4.7
FEB 0 0.1
MAR 0.7 0
APR 0 0
MAY 14 191.1
JUNE 11.3 120.2
JULY 41.8 146
AUG 93.9 195.1
SEP 73.6 107.5
OCT 46.5 165.6
NOV 493.8 224.2
DEC 259.5 263.7
Table 4.5: Normalized rainfall data
Month\Year 2009(N1) 2010(N2)
JAN 0.013955 0.005007
FEB 0.000000 0.000107
MAR 0.000746 0.000000
APR 0.000000 0.000000
MAY 0.014914 0.128049
JUNE 0.012038 0.128049
JULY 0.044530 0.155534
AUG 0.100032 0.207841
SEP 0.078406 0.114520
OCT 0.049537 0.176414
NOV 0.526047 0.238841
DEC 0.276446 0.280920
Table 4.6: value of MSE and RMSE
Error
parameter 2009 2010
MSE 0.00721992 0.00098845
RMSE 0.084970124 0.031439687
101 | P a g e
Fig 4.3 : Rainfall Data for Year 2010
V. CONCLUSION
In this paper we proposed a neural network based rainfall prediction system. This can provide help in flood forecasting and warning approaches. We have developed an automated computer program in which by providing the past or previous rain fall data we can predict for upcoming events of rain fall.
As the multilayer perceptrons are considered as universal approximators, we used a multilayer perceptron. In this work, we predict monthly average state rainfall prediction by using previous rain fall data. Rainfall data between year 2004 and year 2008 are used for training and learning the neural network, while data of year 2009 and 2010 are used for testing. To analyse the performance of system we calculate mean square error (MSE) and root mean square error (RMSE) between the obtained values and actual values of rainfall data for year 2009 and 2010. Experimentally, we find that neural network based rainfall prediction gives a good performance with minimum values of the mean square error (MSE) and root mean square error (RMSE).
VI. ACKNOWLEDGMENT
We would like to acknowledge the help we received from the India water Portal, our sincere thanks especially to Prof. Sumathi Sivam for providing us previous year’s rain fall data.
REFERENCES
[1] J.V. Aguilar, P. Langarita, L. Linares, M. Gómez, and J. Rodellar, Senior Membe Haykin, S., River level forecasting “Neural Networks”, Prentice-Hall International Inc., 1999.
[2] Fausett, L., “Fundamental of Neural Networks: Architechtures, Algorithms and Application”, Prentice-Hall, New Jersey, USA, 1994.
[3] Freeman, J. A. and Skapura, D.M., ” Neural Networks: Algorithms, Application and Programming Techniques”, Pearson-Education Pte. Ltd., 2005.
[4] E. A. Basha, S. Ravela and D. Rus, “Model-Based Monitoring for Early Warning Flood Detection, SenSys”, Raleigh, North Carolina, USA, ’08, November5-7, 2008.
[6] Steven P Sweeney, Sehwan Yoo, Albert Chi, Frank Lin, Taikyeong Jeong, Sengphil Hong, Sam Fernald “Neural Net Water Level Trend Prediction and Dynamic Water Level Sampling Frequency”,Sixth
International Conference on Natural Computation (ICNC 2010),2010.
[7] J.V. Aguilar, P. Langarita, L. Linares, M. Gómez, and J. Rodellar, Senior Member, IEEE “An adaptive predictive approach for river level forecasting”, International Conference on Networking, Sensing and Control Delft, the Netherlands, 11-13 April 2011.
[8] Liping Fan and Kosta Boshnakov “Neural-Network-Based Water Quality Monitoring for Wastewater Treatment Processes”, Sixth International Conference on Natural Computation, ICNC 2010, Yantai,
Shandong, China, 10-12 August 2010
[9] Victor Seal, Arnab Raha, Shovan Maity, Souvik Kr Mitra1, Amitava Mukherjee and Mrinal Kanti Naskar “A Simple Flood Forecasting Scheme Using Wireless Sensors Networks” International journal of Ad hoc,
sensor & Ubiquitous compution(IJASUC)vol.3 No.1,Febuary 2012.
[10]Caitlin Balthrop Moffitt, Faisal Hossain, Robert F.Adler, Koray K. Yilmaz, Harold F. Pierce., “ validation of a TRMM-based global flood detection system in Bangladesh”. International Journal of Applied Earth Observation and Geo-informaion,2010.
[11]Sulafa Hag Elsafi ., “Artificial Neural networks For flood forecasting at Dongola Station in the river Nile Sudan”, Alexandria Engineering journal, 2014.
[12]Masoud bakhtyari Kia, Said Pirasteh, Biswajeet pradhaan, Ahmad Rodzi Mahmud, Wan Nor Azmin Sulaiman, Abbas Moradi., “ An artificial neural network model for flood simulation using GIS: Johor river basin, Malayasia”, Environ Earth sci, Springer-Verlag, 2011.
[13]Rashid Ali and Iram Naim, “Neural Network Based Supervised Rank Aggregation,” Proc. of the International Conference on Multimedia, Signal Processing and Communication Technologies (IMPACT-2011), Aligarh, India, IEEE press, ISBN: 978-1-4577-1105-3, pp. 72-75, December 2011.
[14] Iram Naim and Rashid Ali, “Metasearching using Modified Rough Set Based RankAggregation,” Proc. of the International Conference on Multimedia, Signal Processing and Communication Technologies (IMPACT-2011), Aligarh, India, IEEE press, ISBN:978-1-4577-1105-3, pp.208-211, December 2011. [15] Rashid Ali and Iram Naim, "Metasearching using Supervised Rank Aggregation," Proc.of the 2011 IEEE
International Conference on Computational Intelligence and Computing Research (2011 IEEE ICCIC), Kanyakumari, India, IEEE press, ISBN: 978-1-61284-693-4, December 2011.
[16]R. L. Wilby, R. J. Abrahart, C. W. Dawson “Detection of conceptual model rainfall run off processes inside an artificial neural network” Hydrological Sciences Journal Volume 48, Issue 2, 2003.
[17]Steven P Sweeney, Sehwan Yoo2, Albert Chi1, Frank Lin1, Taikyeong Jeong, Sengphil Hong, Sam Fernald “Neural Net Water Level Trend Prediction and Dynamic Water Level Sampling Frequency” Ninth ACIS