University of Pennsylvania
ScholarlyCommons
Publicly Accessible Penn Dissertations
2018
Development Of A Methodology For Fast
Optimization Of Building Retrofit And Decision
Making Support
Pengyuan Shen
University of Pennsylvania, [email protected]
Follow this and additional works at:
https://repository.upenn.edu/edissertations
Part of the
Architectural Engineering Commons
This paper is posted at ScholarlyCommons.https://repository.upenn.edu/edissertations/2852 For more information, please [email protected].
Recommended Citation
Shen, Pengyuan, "Development Of A Methodology For Fast Optimization Of Building Retrofit And Decision Making Support" (2018).Publicly Accessible Penn Dissertations. 2852.
Development Of A Methodology For Fast Optimization Of Building
Retrofit And Decision Making Support
Abstract
The condition of current building stock in the United States raises the question of whether the energy performance of existing buildings can ever be environmentally sustainable. In the United States, buildings accounted for 39% of total energy consumption and 72% of total electricity consumption (USEPA 2009). In addition, current building energy use is projected to increase by 1.7% annually until 2025 ( J.D. Ryan 2004). The great potential for energy reduction in existing buildings has created opportunities in building energy retrofit projects (Noris et al. 2013). A building renovation project must not only be affordable, taking into account factors such as investor budgets, payback period, economic risks and uncertainties, but also create a thermally comfortable indoor environment and is sustainable through its lifetime. The research objective of this dissertation is to develop a novel method to optimize the performance of buildings during their post-retrofit period in the future climate. The dissertation is organized in three sections:
a) Develop a data-driven method for the hourly projection of energy use in the coming years, taking into account global climate change (GCC). Using machine learning algorithms, a validated data-driven model is used to predict the building’s future hourly energy use based on simulation results generated by future extreme year weather data and it is demonstrated that GCC will change the optimal solution of future energy conservation measure (ECM) combination.
b) Develop a simplified building performance simulation tool based on a dynamic hourly simulation algorithm taking into account the thermal flux among zones. The tool named SimBldPy is tested on EnergyPlus models with DOE reference buildings. Its performance and fidelity in simulating hourly energy use with different heating and cooling set points in each zone, under various climate conditions, and with multiple ECMs being applied to the building, has been validated. This tool and modeling method could be used for rapid modeling and assessment of building energy for a variety of ECM options.
c) Use a non-dominated sorting technique to complete the multi-objective optimization task and design a schema to visualize optimization results and support the decision-making process after obtaining the multi-objective optimization results. By introducing the simplified hourly simulation model and the random forest (RF) models as a substitute for traditional energy simulation tools in objective function assessment, certain deep retrofit problem can be quickly optimized. Generated non-dominated solutions are rendered and displayed by a layered schema using agglomerative hierarchical clustering technique. The optimization method is then implemented on a Penn campus building for case study, and twenty out of a thousand retrofit plans can be recommended using the proposed decision-making method. The proposed decision making support framework is demonstrated by its robustness to the problem of deep retrofit optimization and is able to provide support for brainstorming and enumerate various possibilities during the process of making the decision.
Degree Type
Dissertation
Degree Name
Doctor of Philosophy (PhD)
Graduate Group
Architecture
First Advisor
William W. Braham
Keywords
building retrofit, building simulation, climate change, decision making, multiobjective optimization, thermal modeling
Subject Categories
Architectural Engineering
DEVELOPMENT OF A METHODOLOGY FOR FAST
OPTIMIZATION OF BUILDING RETROFIT AND DECISION MAKING
SUPPORT
Pengyuan Shen A DISSERTATION
in Architecture
Presented to the Faculties of the University of Pennsylvania in
Partial Fulfillment of the Requirements for the Degree of Doctor of Philosophy
2018
Supervisor of Dissertation
_____________________
William W. Braham Professor of Architecture
Graduate Group Chairperson
_____________________
David Leatherbarrow Professor of Architecture
Dissertation Committee
David, Leatherbarrow, Professor & Chair of the Graduate Group in Architecture Yun Kyu Yi, Assistant Professor, Illinois School of Architecture
DEVELOPMENT OF A METHODOLOGY FOR FAST OPTIMIZATION OF BUILDING
RETROFIT AND DECISION MAKING SUPPORT
COPYRIGHT
2018
Pengyuan Shen
This work is licensed under the
Creative Commons Attribution-
NonCommercial-ShareAlike 3.0
License
To view a copy of this license, visit
ii
iii
ACKNOWLEDGMENT
I am so excited at this point. There are so many people to whom I want to express my
gratitude during these years of study abroad. I still remember how eager I was to go to Penn when
I opened the letter of admission and received the fellowship six years ago. Time flies by, I really
cannot imagine how fast the six years at Penn have gone. The most important people that I want
to thank are my family members who supported me all the way through both emotionally and
financially. Without you, I would not be able to go to the United States and fulfil my dream of
studying at a world-renowned university. My deepest thoughts go to my grandma who raised me
and passed away shortly before my graduation. I feel so sorry for not being beside her to spend
the last moment of her life with her.
I am lucky and grateful to be a student of Professor William Braham, who offered great
help and advice for my thesis, shared with me his knowledge in learning and teaching, and gave
me invaluable advice in every course and research project along the way. His unwavering passion
for research, spirit of scholarship, visionary and innovative ideas, diligence, sense of humor, will
always be the criteria to be pursued in my future professional life. I also could not be more
delighted and fortunate to have Dr. Yunkyu Yi and Dr. Eric Eaton sit on my dissertation
committee. Both of them gave me inspiration and suggestions for the completion of the
dissertation. I wish them all the success in their field of research and study. I also want to thank
Professor Ali Malkawi for bringing me to Penn at the very beginning, otherwise I will not have
those wonderful memories here at all.
Moreover, I would like to thank my girlfriend, Rui Pei, for being with me in the last two
iv
happiness and bitterness. Thank you for the great patience and attentiveness in proof reading my
dissertation.
Finally, I want to thank all the extraordinary teachers and amazing colleagues who have
v
ABSTRACT
DEVELOPMENT OF A METHODOLOGY FOR FAST OPTIMIZATION OF BUILDING
RETROFIT AND DECISION MAKING SUPPORT
Pengyuan Shen
William W. Braham
The condition of current building stock in the United States raises the question of whether
the energy performance of existing buildings can ever be environmentally sustainable. In the
United States, buildings accounted for 39% of total energy consumption and 72% of total
electricity consumption (USEPA 2009). In addition, current building energy use is projected to
increase by 1.7% annually until 2025 (J.D. Ryan 2004). The great potential for energy reduction
in existing buildings has created opportunities in building energy retrofit projects (Noris et al.
2013). A building renovation project must not only be affordable, taking into account factors such
as investor budgets, payback period, economic risks and uncertainties, but also create a thermally
comfortable indoor environment and is sustainable through its lifetime. The research objective of
this dissertation is to develop a novel method to optimize the performance of buildings during
their post-retrofit period in the future climate. The dissertation is organized in three sections:
a) Develop a data-driven method for the hourly projection of energy use in the coming
years, taking into account global climate change (GCC). Using machine learning algorithms, a
validated data-driven model is used to predict the building’s future hourly energy use based on
simulation results generated by future extreme year weather data and it is demonstrated that GCC
vi
b) Develop a simplified building performance simulation tool based on a dynamic hourly
simulation algorithm taking into account the thermal flux among zones. The tool named
SimBldPy is tested on EnergyPlus models with DOE reference buildings. Its performance and
fidelity in simulating hourly energy use with different heating and cooling set points in each zone,
under various climate conditions, and with multiple ECMs being applied to the building, has been
validated. This tool and modeling method could be used for rapid modeling and assessment of
building energy for a variety of ECM options.
c) Use a non-dominated sorting technique to complete the multi-objective optimization
task and design a schema to visualize optimization results and support the decision-making
process after obtaining the multi-objective optimization results. By introducing the simplified
hourly simulation model and the random forest (RF) models as a substitute for traditional energy
simulation tools in objective function assessment, certain deep retrofit problem can be quickly
optimized. Generated non-dominated solutions are rendered and displayed by a layered schema
using agglomerative hierarchical clustering technique. The optimization method is then
implemented on a Penn campus building for case study, and twenty out of a thousand retrofit
plans can be recommended using the proposed decision-making method. The proposed decision
making support framework is demonstrated by its robustness to the problem of deep retrofit
optimization and is able to provide support for brainstorming and enumerate various possibilities
vii
TABLE OF CONTENTS
ACKNOWLEDGMENT
... III
ABSTRACT
... V
LIST OF TABLES
...
XI
LIST OF ILLUSTRATIONS
...
XIII
1.
INTRODUCTION AND STATEMENT OF THE PROBLEM
... 1
1.1 Challenges for Building Retrofit Optimization ... 4
1.2 Optimization Approach and Objectives ... 8
1.3 Future Building Energy Use ... 12
2.
DEVELOPMENT OF DATA‐DRIVEN MODEL FOR FUTURE ENERGY
PROJECTION
...
15
2.1 Parametric Study Tool ... 15
2.2 Future Local Hourly Weather Data ... 18
2.3 Feature selection for ECMs ... 20
2.4 Random Forest Algorithm ... 24
3.
TEST OF THE DATA‐DRIVEN METHOD AND DISCUSSIONS ...
27
3.1 Test residential and office building ... 27
viii
3.3 Validation of the data-driven model ... 33
3.4 Discussion of future ECM selection ... 39
3.4.1 ECM selections for each building ... 39
3.4.2 Future years’ ranking of ECM combination ... 47
3.4.3 Ranking change of ECMs in the future ... 49
4.
DEVELOPMENT OF SIMPLIFIED BUILDING MODELING TOOL
...
53
4.1 Modeling Methods ... 59
4.2 Structure of the Tool ... 65
4.3 Built-in Parallelized Model Calibration ... 67
5.
CALIBRATION AND VALIDATION OF SIMPLIFIED MODELING TOOL
...
69
5.1 Reference Buildings ... 69
5.2 Model Calibration Results ... 73
5.3 Indoor Air Temperature ... 74
5.4 Heating and Cooling Load ... 75
5.5 Performance of Model under Various Climates and Various Retrofit Combinations 79 5.5.1 Validation under different climate conditions ... 80
5.5.2 Validation with ECMs ... 86
ix
6.
OPTIMIZATION APPROACH
...
96
6.1 Decision Variables ... 97
6.1.1 Discrete variable scaling ... 98
6.1.2 Continuous variable scaling ... 98
6.1.3 User defined scaling ... 99
6.2 Objective Functions ... 99
6.2.1 Building energy simulation ... 99
6.2.2 Future year energy projection under climate change ... 100
6.2.3 Thermal comfort ... 102
6.2.4 Financial modeling ... 102
6.2.5 Formulation of the optimization problem ... 104
6.2.6 Optimization algorithm ... 106
7.
DECISION MAKING SUPPORT METHOD
... 110
8.
CASE STUDY AND RESULTS DISCUSSION
... 116
8.1 Building Description and Model Calibration ... 116
8.2 ECM Options and Costs ... 121
8.3 Preliminary Run with Single ECM ... 125
8.4 Optimization Results ... 126
8.5 Implementation of Decision Making Support Method ... 129
x
8.7 Summary ... 138
9.
CONCLUSIONS ... 139
APPENDIX
... 143
xi
LIST OF TABLES
Table 1Commercial building median lifetime in years ((EIA) 2011) ... 3
Table 2 Literature review on building retrofit optimization ... 8
Table 3ECMs and parameters ... 18
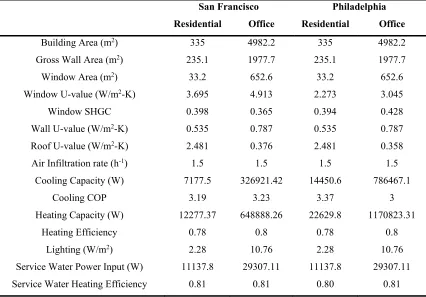
Table 4Major model parameter for the two buildings in San Francisco and Philadelphia ... 28
Table 5 Rankings of ECM importance for each building ... 33
Table 6Future years’ annual BEU validation of twenty randomly chosen ECM combinations for each building ... 38
Table 7 Rankings of top ten ECM combinations from year of 2020 to 2055 ... 43
Table 8Ranking changes of ECM combinations for four buildings compared with TMY scenario ... 50
Table 9 Thermal properties and system configuration of the two buildings ... 70
Table 10 Building occupancy schedule and use schedule ... 71
Table 11 Building indoor air temperature set point schedule ... 72
Table 12 Calibrated model parameters for the sim model ... 73
Table 13 Sim model performance in energy use prediction in different climate conditions (unit: GJ) ... 81
Table 14 ECMs and their parameters for consideration ... 86
Table 15 Comparison of computational cost and bias between EnergyPlus and SimBldPy ... 95
Table 16 Algorithm: non-dominate sorting differential evolution ... 107
xii
Table 18 Calibrated thermo physical properties of building envelopes ... 118
Table 19 Towne building operation schedule ... 118
Table 20 Window replacement properties and cost ... 122
Table 21 ECM parameters and costs (w/cost) ... 123
Table 22 ECM parameters and costs (w/o cost) ... 124
xiii
LIST OF ILLUSTRATIONS
Fig. 1Year in which commercial buildings were constructed ((EIA) 2009) ... 2
Fig. 2Observed annually averaged combined land and ocean surface temperature
anomaly 1850 – 2012 (IPCC 2013) (Top panel: annual mean values. Bottom panel: decadal mean
values including the estimate of uncertainty for one dataset (black). Anomalies are relative to the
mean of 1961−1990) ... 12
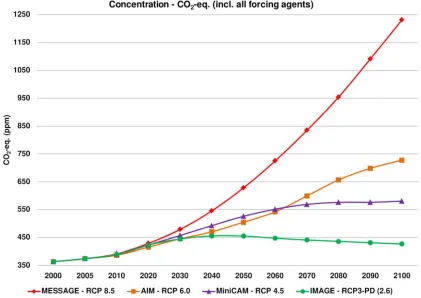
Fig. 4 All forcing agents' atmospheric CO2-equivalent concentrations (in
parts-per-million-by-volume (ppmv)) according to four RCPs (IPCC 2013) ... 19
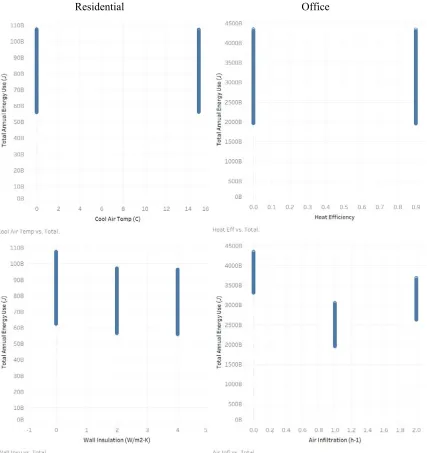
Fig. 5Different ECM’s impact to building annual energy use simulated by EnergyPlus 22
Fig. 6Average feature selection accuracy with different folds by using LHS and random
sampling ... 31
Fig. 7Biased prediction results of the model for random ECM combination by using
TMY weather data for model training ... 34
Fig. 8 The construction process of the extreme year hourly weather data (Philadelphia) 35
Fig. 9The constructed hourly temperature profile for extreme weather year... 36
Fig. 10Validation of annual BEU prediction of three random ECM for each building ... 42
Fig. 11End use breakdown of BEU for the four buildings ... 47
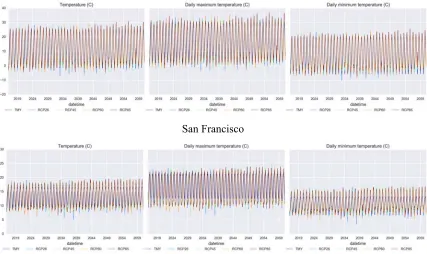
Fig. 12 Downscaled monthly mean temperature, daily maximum and minimum
temperature under different RCPs (2015 to 2069) and TMY in Philadelphia and San Francisco . 51
Fig. 13 Improved hourly method in EN ISO 52016-1 (b) compared to simplified method
in EN ISO 13790:2008 (a). ... 58
Fig. 14 5R1C model used for the simplified hourly method from non zone thermal
xiv
Fig. 15 Flow chart of the simulation tool ... 65
Fig. 16 Hierarchy of the building inputs information ... 66
Fig. 17 Two reference building model in EnergyPlus ... 70
Fig. 18 Indoor air temperature of the residential building with and without zone thermal coupling ... 74
Fig. 19 Heating and cooling load comparison between ep and sim model for the residential building (line with apostrophe is the case with different indoor air temperature set points) ... 77
Fig. 20 Heating and cooling load comparison between ep and sim model for the office building (line with apostrophe is the case with different indoor air temperature set points) ... 78
Fig. 21 Hourly heating and cooling load validation of the buildings in other climate zones ... 85
Fig. 22 Heating and cooling energy use of the two buildings when different ECM combinations are applied ... 92
Fig. 23 Annual heating, cooling energy use, and end use of the two buildings under different ECM combinations ... 94
Fig. 24 Work flow of optimization approach ... 97
Fig. 25 Example of hierarchical clustering of a dataset in a layered framework ... 115
Fig. 26 Building model calibration ... 118
Fig. 27 “Signature” plot of cooling and heating energy from meters, SimBldPy model, and RF model for Towne Building ... 120
xv
Fig. 29 Monthly mean downwelling shortwave radiation in different RCPs and TMY in
Philadelphia ... 121
Fig. 31 Convergence of the optimization results ... 128
Fig. 32 2-D projection of Pareto fronts with all combinations of objective functions .... 128
Fig. 33 3-D projections and dimensionality reduction visualization (t-sne & PCA) of the
clustered Pareto fronts ... 130
Fig. 34 Plotting of sub-objectives in the first layer clustering ... 132
1
1.
Introduction and Statement of the Problem
Buildings consume a vast amount of resources in constructing, operating, maintaining,
and demolishing. This process requires huge amounts of high quality resources, and human needs
are steadily increasing with a higher standard of living. Buildings are the most essential and
fundamental element in the formation of a city, the place where people gather and share their
thoughts, beliefs, interests, and affections of their inhabitants. The networks of buildings create a
multidimensional space that is essential for interpersonal relationships. Buildings have always
been so important to us. However, they are also important to the functioning of the environmental
system because the land we use, the trees we cut, the concrete and steel we produce, all come
from the ecosystem around us. The contribution of buildings to society’s collective environmental
footprint is partly measurable and at the same time, unmeasurable—partly measurable because of
the rapid development of engineering techniques for calculation and building performance
simulation, which allows us to quantitatively assess the amounts of energy and resources used in
their environmental footprint; while it is unmeasurable because a building’s environmental
performance system is so complex and involves so many social and cultural factors.
For the measurable or quantifiable dimension, it is reported that in the United States,
buildings consume 39% of the energy and 72% of the electricity, and they generate 38% of the
carbon dioxide, 49% of the sulfur dioxide and 25% of the nitrogen oxides found in the air (Ravi
S. Srinivasan et al. 2012). Contemporary buildings cannot function without the energy provided
by fossil fuels, while pollutants from fossils fuels pose risks to the local and global environment
with the growing needs of the development of human civilization. For decades, much research
attention has been paid to the energy efficiency of building, as existing buildings play an
important role in building sector’s energy consumption and carbon footprint. The method to find
2
Architects and engineers are concerned by the energy consumption and carbon emission
associated with existing buildings. The energy performance of buildings deteriorates as it ages in
an ever-changing outdoor environment. Global climate change (GCC), aging equipment and
building systems, technology progress and adoption, among other factors, are challenges and
opportunities for existing buildings. According to previous research by Aktas and Bilec, the
average life of residential building in the United States is currently 61 years and has a linearly
increasing trend (Aktas and Bilec 2011). For commercial buildings, the EIA estimates that the
median service life of commercial buildings varies from 65 to 80 years depending on the type of
building, based on data analysis from Commercial Building Energy Consumption Survey
(CBECS) ((EIA) 2009). Approximately half of all commercial buildings were built before 1980
according to CBECS, as shown in Fig. 1, and Table 1 shows the distribution of lifetimes in
different types of commercial buildings in the United States according to EIA annual energy
outlook in 2011 ((EIA) 2011).
3
Table 1Commercial building median lifetime in years ((EIA) 2011)
Building Type Median 66% Survival (*) 33% Survival (*)
Assembly 55 40 75
Education 62 45 86
Food Sales 55 41 74
Food Service 50 35 71
Health Care 55 42 73
Large Office 65 46 92
Mercantile & Service 50 36 69
Small Office 58 41 82
Warehouse 58 41 82
Lodging 53 38 74
Other 60 44 81
Note: Number of years after which the building survives. For example, a third of the large office
building constructed today will survive 92 years later.
As a matter of fact, an estimated 14 billion m2 of existing buildings (about 50% of the
total building stock) are expected to be renovated in the next 30 years in the United States (Zhai,
Bendewald, and Hammer 2011). In 2003, only 26% of the commercial buildings in the United
States were built in the last ten years (EIACBECS 2003). Approximately 86% of current building
construction expenditures are spent on renovating existing buildings and the rest on new
construction (Levine et al. 2014). With the low newly constructed building number and the trend
in recent years, many of the existing buildings in the United States will be renovated if energy
consumption and carbon emissions are expected to be significantly reduced in the future.
Regarding building retrofit, one of the most important things is to evaluate the building
energy use (BEU) with different combinations of energy conservation measures (ECM). This has
been done by many studies in the past under the current climatic conditions (Asadi et al. 2012a, b,
4
Rysanek and Choudhary 2013, Yalcintas 2008). However, finding a computationally efficient
way of assessing the different energy performance provided by different ECM combination in
future climatic condition has not yet been fully developed. In this chapter, the background of the
research subject, discussion of the state of the art, and its challenges and limitations will be
discussed.
1.1 Challenges for Building Retrofit Optimization
The building retrofit process can be complicated, involving the efforts of different parties
including property owners, building clients, architects, and engineers. One of the most important
issues facing building owners and clients is finding the best ECM combination for the existing
building. This is a problem that the building energy research community has been facing for over
thirty years. Asked from different perspectives, this question also means differently by saying the
“best” or the “bests” because various emphasis is often put on the renovation of buildings:
sometimes, it could simply be economic benefits brought by the renovation, or the enhancement
of the building indoor environment and quality, or the reduction of BEU and greenhouse gases
(GHGs). Thus, the optimization function is generally multi-objective and multi-constrained
(Asadi et al. 2012a, b, Asadi et al. 2014, Sun, Huang, and Huang 2015, Wang, Xia, and Zhang
2014, Lu et al. 2015). In this dissertation, the most imminent problem --- how to optimize the
retrofit project in a computationally affordable manner will be addressed when decision-making
factors such as indoor environment and quality, investment value, economic uncertainties are
taken into account.
In recent years, the rapid development of computer technology and building energy
simulation (BES) software has become a powerful tool for answering the question of how to
5
of BEU of different ECM combinations but also its environmental impacts and building wellness.
Simulation becomes a powerful tool to achieve the goal — that is, to critically assess, refute and
further propose new direction of future high performance building design. It also makes it
possible to study the performance of independent subsystem and their interactive behavior
between them, notably by using object-oriented simulation tools. Existing BES tools like
EnergyPlus, eQuest, TRNSYS, ESP-r, etc. (LBNL 2015, Hirsch 2016, Klein and al. 2010), can
model and analyze building energy performance in terms of thermal dynamic features, day
lighting, and human behavioral factors. Thus, various retrofit measures can be applied to virtually
to buildings and simulated results inform us about the decision-making process in selecting
ECMs. In general, computer-based simulation tools allow us to test different combinations of
ECMs for a particular building in a relatively efficient and cost-effective way given a calibrated
and accurate baseline model. However, the use of BES for optimizing ECM building
combinations with parametric case studies presents several challenges:
a) First, the use of BES to evaluate building performance for the huge combinatorial
problem when dealing with multiple ECMs brings an overwhelming computational cost. In a
retrofit optimization problem, each ECM and its parameter are considered as a vector of design
variable. Due to the non-linear nature of optimizing building retrofit problem, it is hard to
construct an objective function with derivative using method of gradient descent or ascent
(Wetter and Wright 2004, Michael and Jonathan 2003, Chidiac et al. 2011a). In order to find the
interactions between different variables and their parameters, a huge combinatorial problem will
be formed. The introduction of an additional ECM into a retrofit project will result in an
exponential increase in simulation cases. Thus, using current optimization techniques to find
solutions to the optimization problem would be infeasible, even with parallel computing
technology. The application of gradient-free and non-derivative optimization algorithms such as
6
problem, but without a computationally efficient method for evaluating future year’s building
energy use, it is difficult to obtain optimal ECM combinations in the future.
b) Secondly, simplified and static simulation methods are unwieldy and
non-generalizable because of the lack of availability of the tools developed by these methods. There
are simplified BES modeling methods, such as gray models like R-C (resistance & capacitance)
models and static simulation method like degree-day approach, which have been applied to
building retrofit analysis. For example, Asadi et al. developed a multi-objective mathematical
model to help stakeholders make decisions by seeking ECM that minimizes energy in a
cost-effective manner (Asadi et al. 2012a). They used an R-C model to simultaneously evaluate the
effectiveness of all available combinations of retrofit actions. Murray et al. developed a static
simulation modeling process using a degree-day methodology to evaluate the gross building
energy use (Murray, Rocher, and O'Sullivan 2012). The large monthly time step of these methods
makes high-resolution analysis impossible, such as demand response and real-time pricing, the
production of onsite renewable energy supply systems and the effect of cooling and heating
setback during unoccupied hours. Hillebrand et al. developed and designed a simplified method
to evaluate ECMs for office buildings in Europe by adopting a retrofit matrix method that takes
into account ecological and economic efficiency (Hillebrand et al. 2014). The basis of this
method is mainly predicated on standardized building types. However, each building is different
from another. While the use of an established database of prototypical building to guide typical
building types could assist in the preliminary phase of retrofit planning, it can not provide a
detailed, reproducible and generalizable tool that addresses individual building. Moreover, each
building model needs parameter optimization, model testing and calibration, and only then can a
model be adopted for the prediction of energy load with different ECMs being applied. This is not
easy for existing buildings where many complexities reside and where multiple zones exist. As a
7
building or individual zone, such as a single-zone building model with single occupancy schedule
being applied to the building after the parameters and configurations of the model for this
building are calibrated. But the modeling and calibration can be difficult and time-consuming
when it is implemented on more complex building types, such as mixed-use buildings, various
schedules of room temperature set point, occupancy and equipment. The advantages of the gray
model are the lesser amount of inputs needed and the uncertainties of the input data are well
controlled. However, the disadvantage of the existing simplified method is also salient for the
purpose in this study: compared to the white models like EnergyPlus, a simulation tool based on
simplified gray model that has the flexibility, the generalizability, and the reproducibility in
modeling the building thermophysics including building geometry, solar heat gains and
infiltration (e.g. opening, blinds, shadings) are not available and need to be developed.
c) The huge computational cost in generating a training database for the data-driven
model. Data-driven method can be used to significantly reduce computational cost in solving the
building retrofit optimization problems because it can be used to predict BEU of each ECM
combination applied to the target building with potentially high reliability if data samples are
sufficient and the model is properly trained. In a research that uses data-driven method to learn
how different ECMs and their parameters will change the BEU, a huge database shall be
established and used as the training database for the optimization problem (Eisenhower et al.
2012). Nevertheless, if EnergyPlus is used to simulate the BEU of different combinations of
ECMs under current climatic conditions, the enormous calculation cost is expected as mentioned
in point a) and also mentioned by Rysanek and Choudhary (Rysanek and Choudhary 2013), not to
mention running each case for the next 30 years with hourly weather data from each year
generated by the future climate scenario. In fact, without the help of data driven model, it is rather
8
judiciously reduce the size of the training database and save computing power in database
generation as well as in the training and forecasting process needs to be resolved.
1.2 Optimization Approach and Objectives
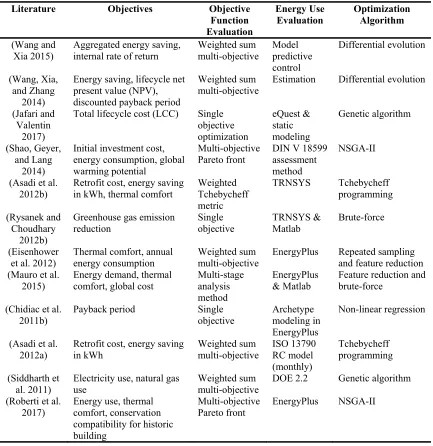
Table 2 Literature review on building retrofit optimization
Literature Objectives Objective
Function Evaluation
Energy Use
Evaluation Optimization Algorithm
(Wang and
Xia 2015) Aggregated energy saving, internal rate of return Weighted sum multi-objective Model predictive control
Differential evolution
(Wang, Xia, and Zhang
2014)
Energy saving, lifecycle net present value (NPV), discounted payback period
Weighted sum
multi-objective Estimation Differential evolution
(Jafari and Valentin
2017)
Total lifecycle cost (LCC) Single objective optimization eQuest & static modeling Genetic algorithm (Shao, Geyer, and Lang 2014)
Initial investment cost, energy consumption, global warming potential
Multi-objective
Pareto front DIN V 18599 assessment method
NSGA-II
(Asadi et al.
2012b) Retrofit cost, energy saving in kWh, thermal comfort Weighted Tchebycheff metric
TRNSYS Tchebycheff programming
(Rysanek and Choudhary
2012b)
Greenhouse gas emission
reduction Single objective TRNSYS & Matlab Brute-force
(Eisenhower et al. 2012)
Thermal comfort, annual energy consumption
Weighted sum multi-objective
EnergyPlus Repeated sampling and feature reduction (Mauro et al.
2015) Energy demand, thermal comfort, global cost Multi-stage analysis method
EnergyPlus
& Matlab Feature reduction and brute-force
(Chidiac et al.
2011b) Payback period Single objective Archetype modeling in EnergyPlus
Non-linear regression
(Asadi et al. 2012a)
Retrofit cost, energy saving in kWh Weighted sum multi-objective ISO 13790 RC model (monthly) Tchebycheff programming (Siddharth et
al. 2011) Electricity use, natural gas use Weighted sum multi-objective DOE 2.2 Genetic algorithm (Roberti et al.
2017) Energy use, thermal comfort, conservation compatibility for historic building
Multi-objective
9
Literature Objectives Objective
Function Evaluation
Energy Use
Evaluation Optimization Algorithm
(Tadeu et al.
2015) Global cost, primary energy use Multi-objective Pareto front EnergyPlus Brute-force (Son and Kim
2016) Energy consumption, CO2 emissions, retrofit costs, and thermal comfort
Multi-objective
Pareto front EnergyPlus NSGA-III
(Wu et al.
2017) Annualized costs and life cycle GHGs emissions Single obejective & Multi-objective Pareto front
EnergyPlus Epsilon-constraint method
(Asadi et al.
2014) Energy consumption, retrofit cost, thermal comfort
Single objective and Multi-objective Pareto front
TRNSYS Latin-hypercube sampling, artificial neural network, MOGA (Multi-Objective Genetic Algorithm) (Rysanek and Choudhary 2013)
Marginal abatement cost vs. GHGs emissions saved; discounted payback period vs. required capital
Primary and secondary objectives TRNSYS & Matlab Brute-force (Chantrelle et al. 2011) EnergyConsumption, investment, thermal comfort
Multi-objective Pareto front
TRNSYS NSGA-II
(Pombo et al.
2016) Lifecycle financial saving, energy saving Multi-objective Pareto front EnergyPlus Brute-force
Table 2 lists research related to building retrofit optimization and methods. These studies
dealt with different objectives and different methods for forming optimization problems. The
most often used objectives in the optimization are the energy use or consumption, the economic
metrics taking into account lifecycle analysis and thermal comfort. For the BES tools used in
those research, EnergyPlus (LBNL 2015) is mostly used, and others include TRNSYS (Klein and
al. 2010), eQuest, which uses the DOE simulation engine (Hirsch 2016). Most popular
optimization algorithm is evolutionary algorithm including genetic algorithm (GA),
multi-objective genetic algorithm (MOGA), non-dominated sorting genetic algorithm (NSGA). The
advantages of GA are that unlike brute force, it does not exhaust the entire design space of the
ECM variables included in a retrofit project. After generations of evolution, GA is able to provide
an optimal solution to the given objective function, although global optima are not guaranteed. It
10
use of GA is usually coupled with BES tools to evaluate the energy use under different ECM
bundles since energy performance always plays an indispensable role, directly or indirectly, in the
objective function. As discussed, EnergyPlus is one of the most popular tools that are used
together with evolutionary algorithms. White box modeling tools like EnergyPlus that involve a
lot of input information and manipulate dynamic functions in building energy modeling can be
time consuming to model and simulate, especially when it is faced with exponentially increasing
simulations that are required in such a combinatorial optimization problem for the retrofit. How
to facilitate the evaluation of objective function during optimization that may involve various
factors such as building energy performance, indoor thermal comfort, investment and returns
could be Limitation One of this research problem.
Limitation Two would be the difficulty of generalizing the result of all the ECMs to the
same type of building by means of an archetypical building study (Chidiac et al. 2011b) and
providing clients with better decision-making support regarding the optimization results. As we
discussed in the beginning of the dissertation, it is not reasonable to treat an individual building as
its archetypical representative, because modern buildings are different in terms of geometric
shape, use of materials, building systems, etc. even if it is classified as the same use type. For
example, the lab buildings on the University of Pennsylvania campus are so diversified in their
win-wall ratio, use schedule, equipment type, and thermal capacity, even within the same type of
use (laboratory), making the variance of energy use intensity large. Therefore, for the purpose of
deep energy retrofitting, it would be important to develop a broadly applicable methodology for
the rapid optimization of individual building retrofitting planning..
In addition, two mechanisms for optimizing the building retrofit are mainly used in the
reviewed research: the deterministic method (weighted sum method is often used) and the
11
user’s decision-making in both methods. Most building retrofit optimization problems involve
several objectives, making them multi-objective problems. Although giving different weights to
each sub-objectives before optimization takes place would reduce the complexity of the problem
by converting the multi-objective problem into a single objective one, the “a priori” nature of this
method requires preferential information to solve the problem. It would be difficult for users or
clients to define appropriate weight values in the final objective function, with little knowledge
about how the optimization results will look like. Moreover, when implementing this
deterministic method, each sub-objective function should be transformed and normalized into a
uniform scale to achieve dimensionless comparison among each other. This process also requires
the intervention from client or decision maker to determine the labeling criteria and transform the
output of each sub-objective function into the same scale. Compared to the disadvantage of
deterministic method in decision-making process, non-dominated method is able to visualize the
trade-offs in retrofit planning, but the drawback could be that the optimized Pareto front curve is
so widespread that it will be difficult to have an idea of where to start and which range on the
Pareto curve might be interesting to look at.
Limitation Four is that it should be noted that LCA is necessary for a retrofit project
because clients tend not to do retrofit too frequently in a short period of time, while the most
reviewed research do not take into account future climate uncertainties. Certainly, it will not be so
difficult to simulate future years’ hourly energy use by using hourly downscaled future weather
data (Shen , Xu et al. 2012, Chan 2011, Belcher, Hacker, and Powell 2005), but a thirty-year
lifespan of hourly energy simulation by using tools like EnergyPlus for the objective function
evaluation could be rather unprocurable given the immense scale in computation. A method to
circumvent the huge computational cost engendered by simulation runs should be found and
12 1.3 Future Building Energy Use
The level of greenhouse gases (GHGs) under different scenarios projected by the
Intergovernmental Panel on Climate Change (IPCC) demonstrates a dramatic increase of GHGs
in the future (IPCC 2007). The status quo of GCC is also updated due to changing trends in
GHGs emission levels and human activities. The IPCC is continuously paying attention to the
ever-changing status of GCC and the carbon emission scenarios since they were first put forward
in the year of 2000. In the recently released IPCC Fifth Assessment Report (AR5), common facts
and basics have been achieved and updated. It is stated that “human influence on the climate
system is clear, and the atmospheric concentrations of carbon dioxide, methane, and nitrous oxide
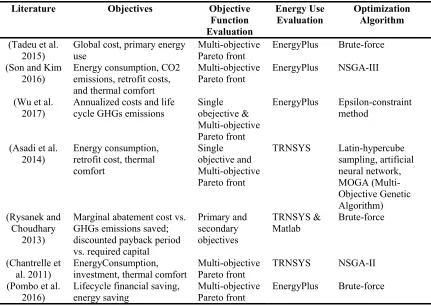
have increased to levels unprecedented in at least the last 800,000 years” (IPCC 2013). Fig. 2
shows the history of surface temperature change on both land and ocean over the last century.
Fig. 2Observed annually averaged combined land and ocean surface temperature anomaly 1850 – 2012 (IPCC 2013) (Top panel: annual mean values. Bottom panel: decadal mean values including the estimate of
13
Many studies have shown that GCC brings great influences to BEU around the world. In
Australia, Wang et al. evaluated the heating and cooling energy requirements and the
corresponding carbon emissions of residential houses under different future climatic
conditions(Wang, Chen, and Ren 2011), and found that the carbon emission of a 5-star house
was projected to have an average increase of 30% in Darwin, 15% in Alice Springs and 19% in
Sydney. Hassan Radhi assessed the potential impact of GCC on residential buildings in the
United Arab Emirates with regard to CO2 emissions (Radhi 2009). In this research, the design of
building envelope and fenestrations in the future is given highlight in combating the increase of
building energy consumption as well as CO2 emission. Researchers in China have also evaluated
the GCC’s impact on the regional renewable energy (RE) system and found that the extreme
events (such as rainstorms, frost, etc.) and the variation of climatic elements will have substantial
impacts on RE systems in different province of China including Guangdong, Gansu, and Tibet
will be most vulnerable to GCC in terms of installing RE system (Wang et al. 2014). Shen stated
that in four representative cities in the United States, the annual energy use is expected to change
from -1.64% to 14.07% for residential buildings and from -3.27% to -0.12% for office buildings
under A2 scenario (a carbon emission scenarios defined by IPCC) in different regions during
2040 to 2069 (Shen 2017). Two recent studies also reveal that GCC will affect the efficiency of
building onsite renewable systems: one claims that GCC will bring down the energy efficiency of
the GSHP system in residential applications in the United States using TRNSYS and eQuest
modeling technique as the warmer ground in the future will result in an average rise of about 2–
3 °C in the inlet and outlet water temperatures of GSHP during the cooling season (Shen and
Lukes 2015), while the other research indicates that for all the existing net zero energy buildings
located in the ten climate zone in the United States, the proportion of decreased annual PV output
is 5 out of 20, while that of wind turbines is 12 out of 20, indicating the comparatively lower
14
system (Shen and Lior 2016). The impacts of GCC on energy use in different types of buildings
in the future are expected and analyzed in various research. Given the fact that the retrofitted
building will last for a certain period of time during post-retrofit stage, it is essential that during
the decision-making process, the situation of the possible change in building energy performance
introduced by climate change as well as the retrofit measures should be studied. Therefore, it is
necessary that GCC’s implication to building performance should be studied since building
energy retrofit will be made for the “future” building instead of buildings in current situation.
Most research on existing building retrofit evaluation and optimization method does not
take into account the impacts of GCC. Meanwhile, the research on GCC's impact is generally
focused on the energy performance of existing buildings. Little work has been done on the
ongoing energy performance of existing buildings during the post-retrofit stage and the long-term
performance of renewable energy system under climate change conditions. Recent research by
Chow et al. studied the effectiveness of retrofitting existing public buildings in the face of GCC
in the “hot summer and cold winter” climate region in China (Chow, Li, and Darkwa 2013). The
study focuses mainly on existing buildings in Zhejiang Province. It uses the HadCM3 global
climate model results to estimate the future building energy use by running the new weather file
in DOE2 simulation engine. Only two retrofit measures are considered in the context of this
research: a) improving the U-Values of the building enclosure; and (b) improving the domestic
hot-water system by replacing the electric boiler with an air-source heat pump. Another research
in 2016 by Swedish and Swiss researchers showed a research closely related to building energy
retrofit measures and theirs robustness to future climate change in terms of mainly heating energy
consumption using a simplified model (Nik, Mata, and Sasic Kalagasidis 2015). The research
focuses on a residential stock in Stockholm to 2100 for five climate scenarios. The simulation is
carried out using a lumped system in Simulink involving all 153 residential buildings. Again,
15
building stock by 50%, by installing more efficient lighting equipment; b) upgrading the building
envelope by adding thermal insulation. Limitations still exist in related studies, including very
few ECM options, limitation of regional application, large simulation time step, and lack of an
inclusive methodology that can be applied to any building type in various climate zones.
2.
Development of Data-driven Model for Future Energy Projection
2.1 Parametric Study Tool
The purpose of this chapter is to look for a data driven method to replace energy
simulation method to predict hourly energy use in future years. We use EnergyPlus as the
baseline simulation engine for the validation of the developed data-driven method. EnergyPlus is
a widely used BES model in both academic and commercial studies, which is developed by the
Department of Energy (DOE). Its precedent versions are BLAST and DOE-2 and it inherited the
features and strengths of both programs. EnergyPlus is able to model the whole building energy
performance and has undergone numerous reliability tests (DOE 2014). One of the characters of
EnergyPlus is that it uses ASCII text based weather data, building input, and simulation output
files and is able to handle design and engineering alterations by modifying the textual information
in the input file. This important feature allows user to process inputs and transform the user inputs
into text based information for EnergyPlus to override the baseline building model. In this way,
different retrofit scenarios of implementing various ECM combination for the existing building
can be realized in EnergyPlus model. The text based outputs generated by EnergyPlus can be
collected and analyzed later. In this study, Python is used as the packaging tool for feeding
16
processing, and has strong support and capability in data processing. It is chosen to program the
main console and tool that helps ECM information injection and EnergyPlus output handling.
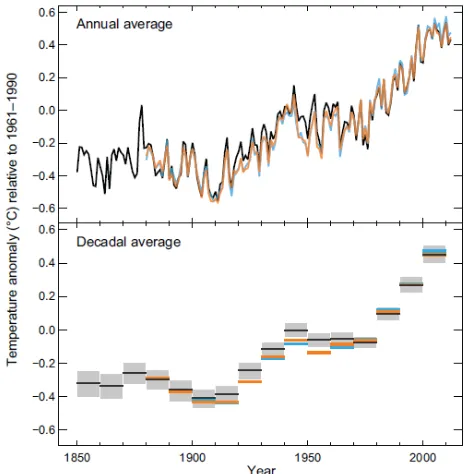
Building ECMs mainly fall into three major categories: passive, active, and renewables as
shown in Fig. 3: 1) Passive retrofit is mainly about reducing the heating and cooling load of a
building, including building envelope insulation, fenestration system retrofit, and natural
ventilation. Passive retrofit ECMs aim to curb the heating and cooling load of the building when
the building is supposed to maintain at a certain thermally comfortable condition for occupants;
2) Active retrofit refers to system efficiency, including HVAC system efficiency (heat source,
pump, fan, valves, and etc.), lighting system efficiency, building control system. Active retrofit
ECMs are applied to these building systems that are used to meet the energy demand caused by
load as described in point 1 with decent efficiency; 3) Renewables refers primarily to the onsite
renewable energy system, which provides additional or major portion of the required energy for
the building in place of traditional fossil fuel energy source in order to reduce GHGs emission
and total energy consumption. Renewables energies have attracted a great deal of interest in
recent years, with the onsite renewable energy systems providing cleaner and less
17
Fig. 3Categories of building retrofit ECMs
In this study, we included eleven ECMs, but the retrofit options and their parameters are
not limited to these ECMs in practice for different retrofit projects. In addition, new emerging
ECMs can be added to the Python retrofit tool. The eleven pioneer ECMs and their parameters
are presented in Table 3.
Retrofit ECMs Passive (Load):
focuses on load reduction
Window retrofit Building Envelope
Green roof Natural ventilation
Sun shading Daylighting Occupant behavior, etc
Renewables (Supply)
focuses on onsite renewable energy source
PV system Wind resource Geothermal resource
Biomass Solar thermal system
Gray water system
Active (Efficiency)
focuses on system efficiency
HVAC system Lighting upgrade Control system upgrade Efficient chiller and boiler
18
Table 3ECMs and parameters
Number ECM Parameter Range
1 Window SHGC 0.3 0.5 0.8
2 Window U-value (W/m2-K) 0.4 1 2
3 Window shading N/A Internal Blind External Blind
4 Wall Insulation (m2K/W) N/A 2 4
5 Air infiltration rate for residential (h -1)
N/A 0.5 1
Air infiltration rate for office (h-1) N/A 1 2
6 Roof Insulation (m2K/W) N/A 3 6
7 Heating efficiency N/A 0.9
8 Cooling COP N/A 4.5
9 Cooling supply air temperature (°C) N/A 15
10 Lighting efficiency improvement N/A 40% (compared with current condition)
11 Daylighting control and dimming N/A Applied
Note: N/A: ECM not applied to the building; SHGC: solar heat gain coefficient.
2.2 Future Local Hourly Weather Data
In this research, the global climate model (GCM) --- HadCM3, developed at the Hadley
Center in the United Kingdom, is adopted to generate future weather file. HadCM3 (Hadley
Center Coupled Model Version 3), like other GCMs, is a grid point model with large grid cells
(2.5o in latitude and 3.75o in longitude over land areas, which gives 96 * 73 grid points on the
scalar grid) (Pope et al. 2000). The outputs of the HadCM3 model are monthly averages for each
climatic variables of the chosen future period. This model has been used in some building energy
research (Gaterell and McEvoy 2005) (Chan 2011). It is assumed that the building retrofit will
last about 35 years in this research. A recent run of HadCM3 model’s outputs is used (IPCC Fifth
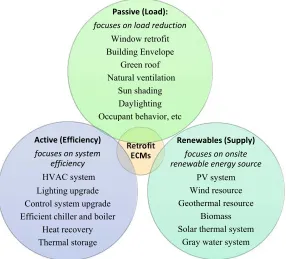
19
concentrations reaching 421 ppm (RCP2.6), 538 ppm (RCP4.5), 670 ppm (RCP6.0), and 936 ppm
(RCP 8.5) by the year 2100 (IPCC 2013). These scenarios are described in the IPCC Fifth
Assessment Report (AR5) and are named representative concentration pathways (RCPs). In this
dissertation, the RCP6.0 scenario is selected to predict future climate condition for the building
retrofit. In RCP6.0, emissions peak around 2080, then decline. The different RCPs are plotted in
Fig. 4:
Fig. 4 All forcing agents' atmospheric CO2-equivalent concentrations (in
parts-per-million-by-volume (ppmv)) according to four RCPs (IPCC 2013)
Due to the fact that GCM operates on a coarse global grid to model and predict the future
GCC scenarios using a numerical solution to Navier-Stokes equations to save the computational
20
be “downscaled” to the local geographic location with finer granularity and mapped to hourly
step. Thanks to the times series based morphing downscaling method proposed by Belcher et al.
(Belcher, Hacker, and Powell 2005), it is computationally efficient to obtain local hourly weather
data in the future. The detailed morphing algorithm and its results in 10 climate zones in the
United States are conducted and obtained in (Shen and Lior 2016). In this study, San Francisco
and Philadelphia are chosen to be experimented with the proposed optimization approach. The
reason for choosing these two cities for this study is because San Francisco has stable temperature
spread over a year with lowest temperature at 10 in January and high temperature at around
27 in summer while the variance of outdoor dry bulb temperature in Philadelphia is high
throughout the year (humid subtropical climate zone that has hot summer and cold winter)
(NOAA 2016), making comparison for prioritizing different ECMs for buildings in the two
climate zones interesting.
2.3 Feature selection for ECMs
For the eleven proposed ECMs in Table 3, if all of their combinations are considered in
the building retrofit optimization, then there will be 23328 EnergyPlus simulation cases in total,
not to mention the exponential growth of simulation cases when new ECMs are added in practice.
In fact, for a specific existing building, there will be ECMs that are not so effective in reducing
BEU. For example, we performed the 23328 simulations for a residential building and an office
building in San Francisco (see the detailed description of the model in section 3.1) respectively
and found that the effects of cooling supply air temperature adjustment in residential building as
well as improving the heating efficiency in office building are not obvious to BEU, while the
21
rate in office building are rather significant to BEU (Fig. 5) (or any other objective function
depending on the different needs of the research; other criteria may also be used, such as financial
payback period, environmental impacts of greenhouse gas emission, etc.). This brings about a
question: is running the combinations of all suggested ECMs required? Because it is not hard to
think of the situation that some ECM’s benefits for the existing building is trivial from the
perspective of BEU saving. This purveys a possible way to circumvent the large combinatorial
search space by fist finding the most influential ECMs to the BEU --- before starting to spend
22
Residential Office
Fig. 5Different ECM’s impact to building annual energy use simulated by EnergyPlus
In this research, a feature selection algorithm based on information theory is used to
search the most influential ECMs to an existing building in terms of the criterion for reducing
energy use. The method is called Joint Mutual Information Maximization (JMIM), which uses
joint mutual information and the “maximum of the minimum” approach that chooses the most
23
importance of the features compared with conventional joint mutual information (JMI) method
(Bennasar, Hicks, and Setchi 2015). To have an idea of the method, let’s first start with the
concept of entropy in information theory (Shannon 1948):
Equation 1:
In Equation 1, H(X) is the entropy of the distribution of variable X, which concerns about
the uncertainty level for its distribution and the average amount of information required to
describe the random variable. For discrete variables, p(x) can be calculated by the proportion of
the number of instants with value x in the total number of instants (N). Then we can calculate the
conditional entropy H(X|Y) of two distributions as:
Equation 2:
Conditional entropy basically tells the amount of uncertainty left in X after Y is seen.
Then mutual information I(X;Y) between X and Y is defined as:
Equation 3:
Equation 4:
The first term explains the uncertainty before Y is known, while the second term
represents the uncertainty after Y is known. Mutual information can be thought of the amount of
uncertainty in X that is removed by knowing Y. Then conditional mutual information can be
defined as:
Equation 5:
24
Lemma 1 basically says that for a feature , if the m-joint mutual information is larger
than that of all other features , where and , then it is the most relevant
feature to the target in the context of the subset of S. Here F is the full set of features, and let S be
the subset of features that are selected already. JMIM employs joint mutual information and the
‘maximum of the minimum’ approach, which should choose the most relevant features according
to Lemma 1 and is given by (Shannon 1948):
Equation 6: arg , ;
where , ; ; ; / .
With the help of the JMIM algorithm, it is possible to find the most effective ECMs in an
ECM combination. However, it is undoubted that the most effective ECM can be identified by
the ranking of the features when JMIM is run on the complete annual BEU database of all
possible ECM combinations, but what we need is to use fewer samples of simulation results to
find out what these ECMs are. Therefore, we used Latin-hypercube sampling (LHS) technique to
sample the combinatorial design space. Since LHS works only with continuous design space, the
discrete retrofit design space is converted to continuous variable space, with each ECM parameter
mapped to a uniform distribution. We then experimented with different sample sizes to find the
minimum sample size that is sufficient to obtain a rough ranking of the feature importance. The
results of the LHS sampling and random sampling are compared in this research when the method
is applied to test case buildings, which will be presented in section 3.2.
2.4 Random Forest Algorithm
According to the challenge introduced in section 1.1, the BEU simulation in future years
25
overwhelming computational cost. In this research, a data-driven method is used to predict the
future years’ BEU for each ECM combination after that the most significant ECMs are selected
using the feature selection method proposed in section 2.3.
The Random forest (RF) algorithm is used as a data mining method in this study. It is an
ensemble learning method based on a non-parametric supervised learning method called a
decision tree algorithm that uses a graph or tree model to learn and predict the schema of the best
routes or rules. When applying the decision tree algorithm, the features of the independent
variables can be either categorical or continuous. For a single decision tree, the simplest
consistent explanation is the best, and such bias is called inductive bias. It is the set of
assumptions that the learner uses to predict outputs given inputs that it has not encountered
(Mitchell 1980). The basic algorithm for top-down induction of decision trees (ID3, C4.5 by
Quinlan) is as follows (Quinlan 1986):
1. A, which is the “best” decision attribute for the next node. 2. Assign A as decision attribute for node.
3. For each value of A, create a new descendent of node. 4. Sort training examples to leaf nodes.
5. If training examples are perfectly classified, stop. Else, repeat over new leaf nodes.
In choosing the “best” attribute, the concept of entropy in Equation 1 is also used in decision tree algorithm. Another important notion is Information Gain:
Equation 7:
Where,
H(S) - Entropy of set S
T - The subsets created from splitting set S by attribute A
26
Furthermore, if the attribute has many values, information gain will select it. Hence, in
order to evade such node as date time like node, Gain Ratio should be used to evaluate the “best”
attribute.
Equation 8:
Equation 9:
where, Xv is a subset of X for which A has value v. Using this node division criterion
when choosing the next division in the node, a tree-type model will be constructed. The more the
tree develops in depth, the more complex the decision rules or routes and the fitter the model will
be adapted to the training data. However, a single decision tree will be biased because it will
overfit the training data, which means that if the hypothesis space has many dimensions (large
number of attributes), meaningless regularity in the data that is irrelevant to the true, important,
distinguishing features will be established. For example, a single decision tree will be sensitive to
data outliers, making it fit the outliers and decreasing its predictive power, or if there is too little
training data, even a reasonable hypothesis space will overfit. To settle this problem, RF is
constructed by a set of decision trees in the training process and produces the rule that is the mean
prediction of the individual trees. This corrects the overfitting behavior of a single decision tree.
For RF, each tree in the ensemble is built from a sample drawn with replacement of the training
set. When dividing a node during the construction of the tree, the chosen division is no longer the
best split among all features. Instead, the split that is picked is the best split among a random
subset of the features. Using RF instead of a single decision tree will effectively lower the
27
In this study, RF is trained by the BEU database containing the hourly simulation results
of selected influential ECM combinations based on future extreme year’s hourly weather data
constructed as described in section 3.3. The features of the database include the weather variables
including temperature, relative humidity, solar irradiation, wind speed, and building occupancy
reported by EnergyPlus. Two different models are trained for electricity use and gas use of the
building (if the building uses gas) for each building under certain future climate scenario
(RCP6.0). Each retrofit plan will have its respective RF model for the prediction of future hourly
BEU. The results and validity of the model will be discussed in section 3.3.
3.
Test of the Data-driven Method and Discussions
3.1 Test residential and office building
In this research, we use two reference EnergyPlus building models in the United States
that are compliant with American Society of Heating, Refrigerating, and Air-Conditioning
Engineers (ASHRAE) 90.1’s 2004 building code and International Energy Conservation Code
(IECC) 2006 as the baseline case. San Francisco and Philadelphia are two climate zones where
we apply and validate the proposed data-driven workflow and methods. It is assumed that the
building retrofit lasts 35 years from the year of 2020 to 2055. Detailed descriptions of the
building physical and thermal characteristics are shown in Table 4. The occupancy behavior,
lighting and equipment intensity, and system schedule are shared for two types of buildings in
28
Table 4Major model parameter for the two buildings in San Francisco and Philadelphia
San Francisco Philadelphia
Residential Office Residential Office
Building Area (m2) 335 4982.2 335 4982.2
Gross Wall Area (m2) 235.1 1977.7 235.1 1977.7
Window Area (m2) 33.2 652.6 33.2 652.6
Window U-value (W/m2-K) 3.695 4.913 2.273 3.045
Window SHGC 0.398 0.365 0.394 0.428
Wall U-value (W/m2-K) 0.535 0.787 0.535 0.787
Roof U-value (W/m2-K) 2.481 0.376 2.481 0.358
Air Infiltration rate (h-1) 1.5 1.5 1.5 1.5
Cooling Capacity (W) 7177.5 326921.42 14450.6 786467.1
Cooling COP 3.19 3.23 3.37 3
Heating Capacity (W) 12277.37 648888.26 22629.8 1170823.31
Heating Efficiency 0.78 0.8 0.78 0.8
Lighting (W/m2) 2.28 10.76 2.28 10.76
Service Water Power Input (W) 11137.8 29307.11 11137.8 29307.11 Service Water Heating Efficiency 0.81 0.81 0.80 0.81
3.2 Feature selection for training database size reduction
The proposed feature selection algorithm is applied both types of building in two climate
zones and we try to find the best sampling size with a decent chance to get the most influential
ECMs for the target building without exhausting the whole combinatorial search space. To
illustrate the validity of using the portion of the entire combinatorial space to obtain these ECMs,
we validate the method in the following steps:
1) A “fold” concept is introduced here to describe the sample size by defining one “fold”
of sample size as the number of all the ECM parameters considered in a retrofit, which
means that, in this study, one fold of sampling size is thirty one samples because there
29
2) LHS sampling is used to generate different number of sampling folds ranging from one
to forty for the continuous design space of eleven dimensions, which has been mapped
from the discrete space containing the ECM by uniform distribution between 0 and 1.
We performed 200 times of feature selection for each number of folds and calculate the
average accuracy of the feature importance rankings and compare it with the true
feature importance rankings generated by the entire database with 23328 cases.
3) The same process in step 2 is performed with random sampling to compare the feature
30 Residential Building in PHL w/ 6 chosen
ECMs
Residential Building in PHL w/ 7 chosen ECMs
Residential Building in PHL w/ 8 chosen ECMs
Residential Building in SF w/ 6 chosen ECMs
31
Office Building in PHL w/ 6 chosen ECMs Office Building in PHL w/ 7 chosen ECMs Office Building in PHL w/ 8 chosen ECMs
Office Building in SF w/ 6 chosen ECMs Office Building in SF w/ 7 chosen ECMs Office Building in SF w/ 8 chosen ECMs