University of Pennsylvania
ScholarlyCommons
Publicly Accessible Penn Dissertations
2017
Towards Precision Psychiatry: gray Matter
Development And Cognition In Adolescence
Efstathios Dimitrios Gennatas
University of Pennsylvania, [email protected]
Follow this and additional works at:
https://repository.upenn.edu/edissertations
Part of the
Neuroscience and Neurobiology Commons
Recommended Citation
Gennatas, Efstathios Dimitrios, "Towards Precision Psychiatry: gray Matter Development And Cognition In Adolescence" (2017). Publicly Accessible Penn Dissertations. 2302.
Towards Precision Psychiatry: gray Matter Development And Cognition
In Adolescence
Abstract
Precision Psychiatry promises a new era of optimized psychiatric diagnosis and treatment through comprehensive, data-driven patient stratification. Among the core requirements towards that goal are: 1) neurobiology-guided preprocessing and analysis of brain imaging data for noninvasive characterization of brain structure and function, and 2) integration of imaging, genomic, cognitive, and clinical data in accurate and interpretable predictive models for diagnosis, and treatment choice and monitoring. In this thesis, we shall touch on specific aspects that fit under these two broad points. First, we investigate normal gray matter development around adolescence, a critical period for the development of psychopathology. For years, the common narrative in human developmental neuroimaging has been that gray matter declines in adolescence. We demonstrate that different MRI-derived gray matter measures exhibit distinct age and sex effects and should not be considered equivalent, as has often been done in the past, but complementary. We show for the first time that gray matter density increases from childhood to young adulthood, in contrast with gray matter volume and cortical thickness, and that females, who are known to have lower gray matter volume than males, have higher density throughout the brain. A custom preprocessing pipeline and a novel high-resolution gray matter parcellation were created to analyze brain scans of 1189 youths collected as part of the Philadelphia Neurodevelopmental Cohort. This work emphasizes the need for future studies combining quantitative histology and neuroimaging to fully understand the biological basis of MRI contrasts and their derived measures. Second, we use the same gray matter measures to assess how well they can predict cognitive performance. We train mass-univariate and multivariate models to show that gray matter volume and density are complementary in their ability to predict performance. We suggest that parcellation resolution plays a big role in prediction accuracy and that it should be tuned separately for each modality for a fair comparison among modalities and for an optimal prediction when combining all modalities. Lastly, we introduce rtemis, an R package for machine learning and visualization, aimed at making advanced data analytics more
accessible. Adoption of accurate and interpretable machine learning methods in basic research and medical practice will help advance biomedical science and make precision medicine a reality.
Degree Type Dissertation
Degree Name
Doctor of Philosophy (PhD)
Graduate Group Neuroscience
First Advisor Ruben C. Gur
Keywords
Adolescence, Development, Gray matter, Machine Learning, MRI, Neuroimaging
Subject Categories
TOWARDS PRECISION PSYCHIATRY:
GRAY MATTER DEVELOPMENT AND COGNITION IN ADOLESCENCE
Efstathios D. Gennatas, MBBS AICSM
A DISSERTATION
in
Neuroscience
Presented to the Faculties of the University of Pennsylvania
in
Partial Fulfillment of the Requirements for the
Degree of Doctor of Philosophy
2017
Supervisor of Dissertation
__________________________
Ruben C. Gur, PhD
Professor of Psychiatry
Graduate Group Chairperson
__________________________
Joshua I. Gold, PhD
Professor of Neuroscience
Dissertation Committee
Geoffrey K. Aguirre, MD PhD, Associate Professor of Neurology
TOWARDS PRECISION PSYCHIATRY: GRAY MATTER DEVELOPMENT AND COGNITION IN ADOLESCENCE
© COPYRIGHT
2017
Efstathios Dimitrios Gennatas
This work is licensed under the Creative Commons Attribution NonCommercial-ShareAlike 3.0 License
To view a copy of this license, visit
To my parents, Eleni and Costas, my brother, Spyros, and my mentor, Bill Seeley.
ABSTRACT
TOWARDS PRECISION PSYCHIATRY:
GRAY MATTER DEVELOPMENT AND COGNITION IN ADOLESCENCE
Efstathios D. Gennatas
Ruben C. Gur
Precision Psychiatry promises a new era of optimized psychiatric diagnosis
and treatment through comprehensive, data-driven patient stratification.
Among the core requirements towards that goal are: 1) neurobiology-guided
preprocessing and analysis of brain imaging data for noninvasive
characterization of brain structure and function, and 2) integration of
imaging, genomic, cognitive, and clinical data in accurate and interpretable
predictive models for diagnosis, and treatment choice and monitoring. In this
thesis, we shall touch on specific aspects that fit under these two broad
points. First, we investigate normal gray matter development around
adolescence, a critical period for the development of psychopathology. For
years, the common narrative in human developmental neuroimaging has
been that gray matter declines in adolescence. We demonstrate that different
MRI-derived gray matter measures exhibit distinct age and sex effects and
should not be considered equivalent, as has often been done in the past, but
complementary. We show for the first time that gray matter density increases
from childhood to young adulthood, in contrast with gray matter volume and
matter volume than males, have higher density throughout the brain. A
custom preprocessing pipeline and a novel high-resolution gray matter
parcellation were created to analyze brain scans of 1189 youths collected as
part of the Philadelphia Neurodevelopmental Cohort. This work emphasizes
the need for future studies combining quantitative histology and
neuroimaging to fully understand the biological basis of MRI contrasts and
their derived measures. Second, we use the same gray matter measures to
assess how well they can predict cognitive performance. We train
mass-univariate and multivariate models to show that gray matter volume and
density are complementary in their ability to predict performance. We suggest
that parcellation resolution plays a big role in prediction accuracy and that it
should be tuned separately for each modality for a fair comparison among
modalities and for an optimal prediction when combining all modalities.
Lastly, we introduce rtemis, an R package for machine learning and
visualization, aimed at making advanced data analytics more accessible.
Adoption of accurate and interpretable machine learning methods in basic
research and medical practice will help advance biomedical science and make
TABLE OF CONTENTS
ABSTRACT
...
iv
LIST OF TABLES
...
ix
LIST OF ILLUSTRATIONS
...
x
1. INTRODUCTION
...
1
2. AGE-RELATED EFFECTS AND SEX DIFFERENCES IN GRAY MATTER
DENSITY, VOLUME, MASS, AND CORTICAL THICKNESS FROM
CHILDHOOD TO YOUNG ADULTHOOD
...
7
INTRODUCTION
...
7
MATERIALS AND METHODS
...
10
Subjects and MRI acquisition...10
MRI preprocessing...10
Gray matter density and cortical thickness estimation...12
Quality assurance...13
High-resolution gray matter parcellation...13
Native space parcelwise data extraction...14
Age-related effects and sex differences...16
RESULTS
...
18
Whole-brain age-related effects: Gray matter density increases while volume and thickness decrease...18
Whole-brain sex differences: Females have lower volume, higher density than males...19
Regional variability in age-related and sex effects...19
Development modulates intermodal relationships among structural measures... 26
DISCUSSION
...
27
Not all gray matter declines in adolescence...27
Age-related effects and sex differences in density may help understand cognitive abilities...28
Biological basis of structural MR measures: the need for large scale, quantitative histological – MRI studies...28
Limitations and implication for future work: Phenotypes of structural brain development and links to cognition...32
3. GRAY MATTER INCREASINGLY PREDICTS COGNITIVE
PERFORMANCE DURING ADOLESCENCE
...
34
INTRODUCTION
...
34
MATERIALS AND METHODS
...
35
Subjects and neuroimaging...35
Generalized Additive Models: Whole brain data & age...36
Gradient Boosting: High dimensional regional brain data...37
RESULTS
...
38
Regional gray matter correlates weakly with verbal reasoning...38
Whole brain volume is a good predictor of verbal reasoning...39
Multivariate models of regional GMD increasingly predict performance...40
Age predicts performance only in children...40
DISCUSSION
...
41
4. ADVANCED BIOMEDICAL DATA ANALYSIS WITH rtemis
...
44
INTRODUCTION
...
44
Design Principles...45
R6 class system...46
VISUALIZATION
...
47
UNSUPERVISED LEARNING: Clustering & Decomposition
...
50
SUPERVISED LEARNING: Classification, Regression, Survival
...
51
learnCV: One-step model tuning and testing...53
bagLearn: Bootstrap aggregating...54
decomLearn: Decompose and learn...54
CROSS-DECOMPOSITION
...
55
META-MODELING
...
55
Model stacking...56
Modality stacking...57
Group-weighted stacking...57
rtemis-POWERED WEB APPLICATIONS
...
58
DISCUSSION
...
60
5. DISCUSSION & FUTURE WORK
...
62
NEUROIMAGING & THE BRAIN
...
62
ACCURATE & INTERPRETABLE: MACHINE LEARNING FOR BASIC
RESEARCH AND PRECISION MEDICINE
...
63
SHARING & CARING: THE NEED FOR TEAM SCIENCE
...
64
APPENDIX – rtemis Algorithms
...
66
LIST OF TABLES
Table 2.1 Summary statistics of regional gray matter measures averaged by
MNI label ...17
Table 2.2 Generalized Additive Models: Main effects and interaction by MNI label ...20
Table 2.3 Generalized additive models: FDR threshold and median p values 20 . Table 2.4 Net percent change from 8 to 23 years and variance explained by MNI label ...24
Table 4.1 The mplot3 family for static graphics ...48
Table A.1 Clustering algorithms ...66
Table A.2 Decomposition algorithms ...66
Table A.3 Supervised learning algorithms ...67
Table A.4 Cross-decomposition algorithms ...68
LIST OF ILLUSTRATIONS
Figure 2.1 T1 preprocessing and high-resolution gray matter parcellation ...11
Figure 2.2 Density increases in adolescence while other measures largely decrease ...18
Figure 2.3 Percentage net change and variance explained by sex and modality ...21
Figure 2.4 Sex differences by modality by MNI label against age ...23
Figure 2.5 Intermodal correlations averaged by MNI label ...25
Figure 3.1 Example learnCV command ...38
Figure 3.2 Density plots of parcelwise Spearman correlations between regional gray matter measures and verbal reasoning ...39
Figure 3.3 Prediction of performance using Generalized Additive Models of whole brain data ...40
Figure 3.4 Prediction of performance using gradient boosting of regional gray matter measures ...41
Figure 4.1 Error reporting in rtemis ...46
Figure 4.2 Example of an R6 object of class rtMod ...47
Figure 4.3 Screenshot of a dynamic plot drawn with dplot3 ...49
Figure 4.4 Unsupervised learning example ...50
Figure 4.5 Summary method on an rtMod object ...53
Figure 4.6 rtemis web app: PNC Explorer ...58
1. INTRODUCTION
The assessment and management of psychiatric disorders have always
been greatly challenging. Psychiatric research and clinical management have
come a long way over the past century, yet diagnosis still suffers from low
accuracy rates and current treatment efforts enjoy limited success, both in
terms of numbers effectively treated and the extent of their improvement.
Research and clinical assessment tools, including neuroimaging, genomic
sequencing, and clinical and cognitive testing, are helping accumulate large
datasets on healthy subjects and patients with psychiatric symptoms.
Advanced data analysis methods are becoming increasingly available and
promise to deliver important insights to fill in the gaps in our understanding
of psychopathology and suggest better ways to manage it.
Precision medicine refers to clinical decision-making tailored to the
individual. The term has emerged in recent years to describe the goal of
capturing and addressing individual idiosyncrasy in order to optimize clinical
decision making and outcomes by capitalizing on a) the increasing amounts
of available clinical data b) increasing computational power, and c) advanced
data analytic methods. Consider the stark contrast between the common
approach in biomedical research versus the reality of clinical practice. The
former has in large part focused on comparing groups of patients vs. healthy
controls to test hypotheses, while the latter has always focused on
and diagnostic manuals, DSM 5 and ICD 10, suggest clinicians fit patients into
groups using a discrete set of labels. It is becoming increasingly clear that
these categories correspond very poorly with underlying brain pathology
(Hyman, 2007; Insel and Cuthbert, 2015). Perhaps more than clinical practice,
this has affected psychiatric research, as researchers end up studying
inhomogeneous groups of subjects based on their DSM, or similar, labels and
often deriving divergent results. To address this, the National Institute of
Mental Health (NIMH) introduced in 2010 the Research Domain Criteria
(RDoC) project to shift focus from symptoms to underlying neuropathology,
thus providing a framework for enhanced patient stratification that would
better support ongoing psychiatric research and would help shape future
brain-based clinical classification schemes (Insel et al., 2010). Importantly,
the RDoC project, an ongoing experiment (https://www.nimh.nih.gov/about/
director/messages/2017/the-future-of-rdoc.shtml), stresses the dimensional
aspect of behavior and psychopathology and the need for a robust,
data-driven discovery process. Symptoms are not either present or absent and do
not come in discrete sets, but can be present at a variable extent in
overlapping combinations.
Magnetic resonance neuroimaging affords researchers and clinicians
the ability to study the human brain in vivo in a safe and noninvasive way.
MRI scanners can be programmed to create different contrasts to focus
water diffusion, blood oxygenation level, etc. Trade-offs between temporal
and spatial resolution, among other parameters, can be exploited to create
sequences that create one or more high-resolution images or a whole
timeseries. A T1-weighted image can differentiate protons based on their
immediate environment and provides a high-resolution structural image of
the brain with good tissue contrast. A diffusion-weighted image (DWI)
measures water diffusion which can be used to estimate direction of
myelinated white matter tracts. Blood-oxygen-level-dependent (BOLD)
signal can be acquired in rapid succession to study changes in blood flow over
time across the brain. Human subjects can be imaged at any age, from infancy
to advanced age, even in utero, to build extensive cross-sectional and
longitudinal datasets on healthy subjects and patients. As such, MR
neuroimaging is one of the core tools for the study of human subjects in
neurologic and psychiatric research.
Data analysis, in general, can be divided into two main steps: data
preprocessing, and statistical analysis / modeling. Preprocessing, which
includes data inspection, cleaning, and transformation forms the bulk of the
work and commands most of the attention both because it consists of
multiple steps, each involving multiple parameters, and because the success
of any subsequent modeling is directly dependent on it. It is also not unique:
different analysis methods may benefit from, or require, different preparation
far more meaningful and useable results than the most powerful algorithm
trained on bad data. “There is no substitute for good data” (Luck, 2014).
Each type of MRI requires its own set of preprocessing steps before any
statistical analysis and modeling can be applied. A main challenge across MRI
modalities remains the scarcity of validation data. Little is known about the
direct relationship between MRI contrasts and the underlying neurobiology,
which makes tuning of preprocessing parameters particularly tricky. As no
gold standards exist in preprocessing, variability in methods remain a source
of uncertainty and heterogeneity across studies and their results.
Following preprocessing, approaches for hypothesis testing and
modeling are drawn from all of statistics and machine learning. Formal
statistical methods come with specific assumptions that must be met if they
are to be employed, while other methods can be applied more universally. For
example, the Generalized Linear Model has been the de facto standard for
neuroimaging data analysis, and while it remains a valid choice for many
applications, a lot of datasets it is commonly applied on violate some of its
core assumptions, commonly the assumptions of normality and linearity.
Even after careful consideration of modeling assumptions, it is not possible to
accurately predict which combination of methods will yield best results. This
can lead to repeated attempts at data preprocessing and modeling until a
specific preconceived relationship is found or any significant result is
published results. The need is evident for informed preprocessing and
modeling of biomedical data.
In this thesis, we shall focus on specific aspects of data preprocessing
and analysis of neuroimaging data that we believe form part of core
considerations for neuropsychiatric imaging research. Specifically, we shall
explore structural brain development around adolescence and its relation to
cognition. The first chapter has four broad goals:
• Recommend a pipeline for T1-weighted MRI preprocessing and
estimation of gray matter measures: gray matter density, volume, mass,
and cortical thickness
• Propose a method for high-resolution gray matter parcellation
• Characterize age-related and sex effects on different gray matter
measures from childhood to young adulthood and clear longstanding
confusion by showing they are unique and complementary, not equivalent
• Provide an overview of factors known to affect structural MRI signal
and emphasize the need for combined histology and MRI studies to fully
understand the biological basis of MRI contrasts and derived measures
In the second chapter, we explore how well these gray matter measures
predict cognitive performance in different age groups:
• We hypothesize that structural-functional coupling grows stronger
• Based on this, we predict that prediction accuracy will be highest in
the oldest subjects.
Finally, in the third chapter we present rtemis, an R package for
machine learning and visualization, which was developed to support the
above work and is aimed at making advanced data analytics more accessible
2. AGE-RELATED EFFECTS AND SEX DIFFERENCES IN GRAY
MATTER DENSITY, VOLUME, MASS, AND CORTICAL
THICKNESS FROM CHILDHOOD TO YOUNG ADULTHOOD
INTRODUCTION
Structural neuroimaging provides insights into the spectrum of typical and
non-typical brain and neurocognitive development. T1-weighted imaging is
the most commonly acquired MRI sequence and offers high-resolution,
low-noise images of brain structure with good tissue contrast. Several structural
measures can be derived from a single T1-weighted image, including gray
matter density (GMD), gray matter volume (GMV), and cortical thickness
(CT). Since the early days of MRI, a large body of research has utilized these
measures to study healthy and clinical populations. Perhaps surprisingly,
confusion exists in the field as GMD, GMV, and CT are often wrongly assumed
to be equivalent or highly related measures of regional gray matter quantity.
GMV and CT are measured in mm3 and mm, respectively. GMD, on the other
hand, is a unitless, scalar measure derived from image segmentation and
related to T1 signal intensity. In one form or other, gray matter abnormalities
have been described in all major neurologic and psychiatric diseases. Voxel
Based Morphometry (VBM) analyses have suggested syndrome-specific
regional atrophy patterns in neurodegenerative diseases (Seeley et al., 2009).
Gray matter abnormalities are widely reported in psychiatric disorders as well
2015), likely reflecting both increased neuropathological heterogeneity and
diagnostic variability. Much of psychopathology emerges around adolescence,
a period characterized by rapid changes in behavior. Detecting and
interpreting what may often be subtle and diffuse disease-related differences
on top of profound and variable age-related changes is particularly
challenging. A clear, multidimensional understanding of normative structural
brain development is therefore essential.
The first two years of life are characterized by rapid gray matter
growth, which reaches its lifetime maximum at around age 2-3 (Matsuzawa
et al., 2001; Knickmeyer et al., 2008). In contrast, myelination of white matter
tracts continues well into adulthood, until the late 30s (Grydeland et al.,
2013). Several developmental neuroimaging studies have described modest
decreases in gray matter during adolescence using measures derived from
gray matter volume and cortical thickness (Sowell et al., 2003; Gogtay et al.,
2004; Sowell et al., 2004; Shaw et al., 2008; Brain Development Cooperative
Group, 2012). It should be noted that some of the early studies used the term
“gray matter density” to refer to the proportion of gray matter voxels around
a sphere of fixed diameter following hard segmentation of the brain (Sowell
et al., 2003; Gogtay et al., 2004; Sowell et al., 2004), and suggested this
quantity reflected local cortical thickness. Today, cortical thickness can be
measured directly using automated methods and GMD usually refers to a
segmentation, where each voxel is labeled as “gray”, “white”, or “CSF” (for
the common 3-class case), soft segmentation creates a GMD map by
assigning voxels a value between zero and one, which is considered to reflect
the amount of gray matter in each voxel. It is related to the T1 signal and thus
to the regional proton density as well as the tissue microenvironment. To
complicate things further, one of the most common measures employed in
the literature, and the default option in many VBM pipelines, is “modulated”
gray matter density. This is equal to GMD multiplied by a scaling factor to
account for volume change from the individual’s native space image to the
registration template. It adds to the confusion because the relative
contribution of each measure is unclear and likely variable spatially and
temporally (with regards to age). To date, no study has compared age-related
effects on these four commonly used gray matter measures.
In this study, we used the extensive cross-sectional neuroimaging
dataset collected on the Philadelphia Neurodevelopmental Cohort (PNC) to
characterize age effects and sex differences on native space gray matter
density, volume, and mass (defined as density times volume; equivalent to
MATERIALS AND METHODS
Subjects and MRI acquisition
All data was collected as part of the Philadelphia Neurodevelopmental Cohort
as previously described (Satterthwaite et al., 2014). Procedures were approved
by the Institutional Review Boards of the Children’s Hospital of Philadelphia
and of the University of Pennsylvania. 1189 subjects (648 females) aged 8 to
23 years were selected from a starting total of 1601 after excluding those with
neurological or psychiatric history, use of psychoactive medication or
incidental findings and those whose structural data failed quality control.
Scanning of all subjects was performed on the same Siemens TIM Trio
scanner (Erlangen, Germany) at the Hospital of the University of
Pennsylvania. T1-weighted imaging was obtained using a magnetization
prepared, rapid-acquisition gradient-echo (MPRAGE) sequence (TR = 1810, TE
= 3.5, TI = 1100; FOV = 180 RL / 240 AP).
MRI preprocessing
A custom T1 preprocessing pipeline was created using ANTs (https://
github.com/stnava/ANTs; RRID: SCR_004757). Raw T1 volumes were first
corrected for bias due to field inhomogeneity using the N4 algorithm
(Tustison et al., 2010). The bias-corrected volumes were then registered to a
whole-head MNI template (whole-head-to-whole-head registration). The
which was used to isolate the brain in native space (skull-stripping). The
skull-stripped volume was then registered to the skull-stripped MNI
template (brain-to-brain registration), which results in improved registration
accuracy compared to the whole-head-to-whole-head registration (Klein et
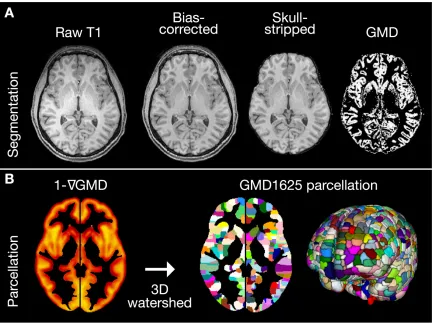
Figure 2.1 T1 preprocessing and high-resolution gray matter parcellation. A, Raw T1 MPRAGE volumes were first corrected for field inhomogeneity and then skull stripped by transforming the MNI brain mask to native space. Gray matter segmentation was
al., 2010). Registrations were performed by a sequence of rigid, affine and
symmetric diffeomorphic (SyN) transformations (Avants et al., 2008; Klein et
al., 2009).
Gray matter density and cortical thickness estimation
MRI brain tissue segmentation is commonly guided by a set of tissue priors.
Given the wide age range of our sample, we wanted to avoid using a single set
of priors for all subjects or different sets of priors for different age bins. We
therefore implemented an iterative process based on Atropos (Avants et al.,
2011) that requires no tissue priors. On the first iteration, K-means
initialization was used to derive 3 classes. The following two iterations used
the segmentation output of the previous step for initialization. This procedure
resulted in a 3-class hard segmentation and a GMD map (soft segmentation)
for each subject in native space (Figure 2.1A). Cortical thickness was obtained
using ANTs’ diffeomorphic registration-based cortical thickness (DiReCT)
estimation procedure (Das et al., 2009) as implemented in the ANTsCT
pipeline, following registration of all T1 images to a study-specific template.
This method offers reliable CT estimation (Tustison et al., 2014) and, by
providing a voxelwise measure in native volumetric space, allows the use of
Quality assurance
To assess the quality of the T1 acquisition and segmentation, we calculated
pairwise spatial correlations among all subjects for two sets of images:
bias-field corrected, normalized T1s and normalized GMD maps. All images whose
spatial correlation was more than two standard deviations lower than the
mean in either case were excluded (n = 56). Visual check confirmed variable
extent of motion artifact in the excluded images, with those near the
threshold being only minimally affected (still excluded). Motion artifact is
known to significantly affect tissue segmentation and all our derived
measures (Blumenthal et al., 2002; Savalia et al., 2016) and our large sample
afforded us this perhaps conservative exclusion threshold.
High-resolution gray matter parcellation
Multiple methods for whole brain parcellation have been previously proposed.
Anatomical parcellations, like the AAL atlas (Tzourio-Mazoyer et al., 2002),
and the Harvard-Oxford Atlas (distributed with FSL; https://
fsl.fmrib.ox.ac.uk/; RRID:SCR_002823) are based on neuroanatomy but
consist of a small number of relatively large regions. Using large parcels or
regions of interest (ROIs) runs the risk of averaging over inhomogeneous
regions, resulting in signal loss. On the other hand, a number of approaches
have been proposed for parcellation based on functional connectivity derived
from task-free functional MRI data (also known as resting state fMRI), but
data to create a parcellation of 180 regions in each hemisphere. As the authors
note, the parcels show high variance in shape and size and consider their
number to be “a lower bound, as some parcels are probably complexes of
multiple areas” (Glasser et al., 2016).
Our goal was to develop a high-resolution parcellation derived from
structural data where parcels are centered around GMD peaks, i.e. cortical gyri
and subcortical nuclei. An age- and sex-matched subsample of the 1189
subjects was created by first splitting the initial sample by sex, then splitting
each set into deciles based on its age range, and finally randomly selecting 12
subjects from each resulting subset (i.e. 12 subjects per sex per age decile),
giving a total of 240 subjects. A mean image was created from the
normalized, smoothed GMD maps of these subjects. In order to identify GMD
peaks, the gradient of the mean GMD image was calculated, subtracted from
1, and smoothed. A 3D watershed algorithm was applied on the resulting
image, producing 1625 parcels covering the whole brain gray matter (Figure
2.1B).
Native space parcelwise data extraction
The PNC-GMD1625 parcellation was transformed to each subject’s native
space by applying the inverse of the brain-to-brain transformation (i.e.
MNI-to-native space) and masked by each subject’s gray matter hard
parcel for each subject using the c3d utility (part of ITK-SNAP; http://
www.itksnap.org/; RRID: SCR_002010). CT values were measured for 1339 of
the 1625 regions, after excluding subcortical regions. In order to get a native
space equivalent of modulated density, we derived gray matter mass (GMM)
as the product of GMD and GMV. Native space analysis allows direct
measurement of GMV and extraction of mean GMD and CT values with no
interpolation. Averaging GMD and CT values within each parcel instead of
applying Gaussian smoothing avoids smoothing-related artifacts which are
exaggerated in a segmented image. Cortical thickness (and therefore the gray
matter segmentation) varies around 2-5mm while smoothing kernels are
commonly at least 8mm full width at half maximum (FWHM). In a gray
matter segmentation, this results in voxel intensities being averaged with
surrounding empty voxels (i.e. voxels of zero intensity), causing a drop in
signal. The extent of signal drop depends on the number of surrounding
empty voxels, which varies both by brain region and age. This makes
intensity values from different locations incomparable and directly confounds
age-related effects. Interpolation results in a similar artifact, equivalent to
Age-related effects and sex differences
Generalized additive models (GAMs) were used to characterize age-related
effects and sex differences on GMD, GMV, GMM, and CT using the mgcv
package (Wood, 2011; Wood, 2012) in R (R Project for Statistical Computing;
https://www.r-project.org/; RRID:SCR_001905). A GAM is similar to a
generalized linear model where predictors can be replaced by smooth
functions of themselves, offering efficient and flexible estimation of
non-linear effects. Three sets of models were fit. Full models included age and
age-by-sex interaction terms represented using penalized smoothing splines
with smoothing parameters selected by restricted maximum likelihood. For
each modality in turn, for each gray matter parcel p, a model of form (1) was
fit:
{GMD, GMV, GMM, CT}p ~ Sex + s(Age) + s(Age * Sex) (1)
where s() represents a penalized smoothing spline. The dimension of the
basis used to represent the smooth terms was limited to a maximum of 5 in
all models. Reduced models were fit in order to obtain accurate p-values for
the main effects of sex and age. Specifically, model (2) omits the interaction
term and was fit for each parcel in order to obtain p-values for the main
effect of sex. Model (3) omits sex entirely and was therefore fit separately for
each sex s in order to obtain p-values for the main effect of age.
{GMD, GMV, GMM, CT}s, p ~ s(Age) (3)
Models of form (3) were also fitted at the whole brain level, using mean
GMD and CT (weighted by number of voxels in each parcel), and total GMV
and GMM, as separate dependent variables.
{MeanGMD, MeanCT, TotalGMV, TotalGMM}s, p~ s(Age) (4)
In each case, p-values were corrected for multiple comparisons by
controlling the false discovery rate (FDR; Benjamini and Hochberg method;
q-value = 0.05).
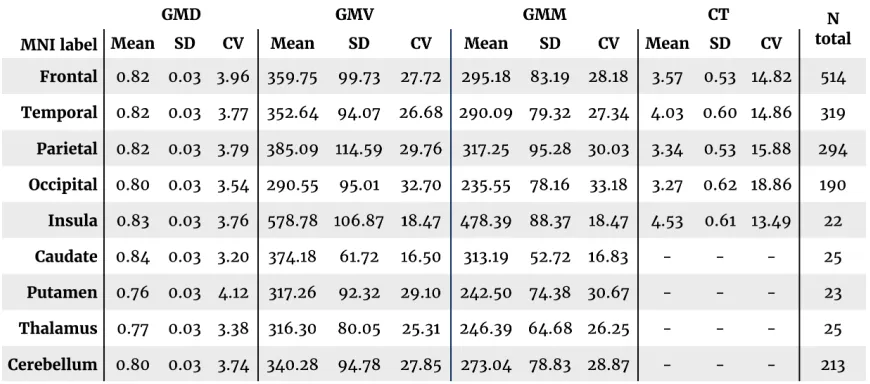
Table 2.1 Summary statistics of regional gray matter measures averaged by MNI label.
RESULTS
Whole-brain age-related effects: Gray matter density increases while volume and
thickness decrease
We sought to characterize age-related effects and sex differences at the whole
brain and regional level on three independent gray matter measures, GMD,
GMV, and CT, and a derived measure, GMM = GMD * GMV. At the whole brain
level, we find that total brain GMV and CT decrease from childhood to young
adulthood (8 to 23 years) in accordance with previous studies. In contrast,
mean brain GMD increases during the same period. Whole brain GMM shows
only a modest decrease. Figure 2.2 shows plots of fitted values converted to
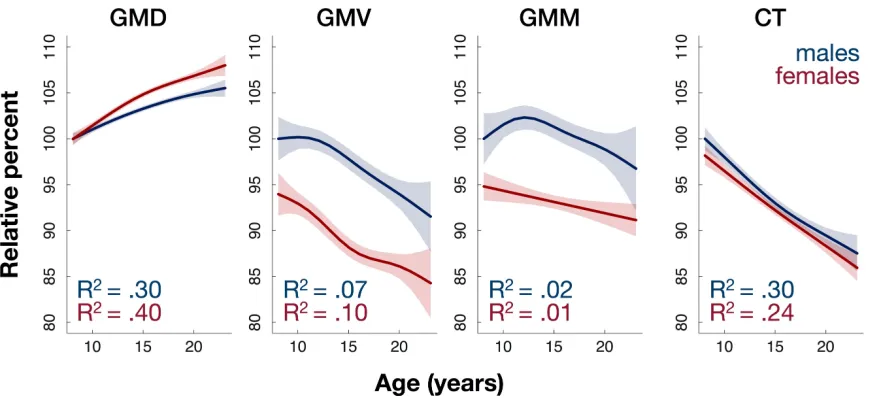
Figure 2.2 Density increases in adolescence while other measures largely decrease. Females have higher density and lower volume. Plots show fitted values of whole-brain gray matter measures against age for the two sexes. GMD and CT were averaged across the brain (weighted by N voxels in each parcel), and GMV and GMM were summed. To make results comparable across measures, they are plotted as
relative percentages (fitted values for 8 y.o. males are defined as 100%)
derived from whole brain models (model of form 4 under Materials and
Methods, Age-related effects and sex differences). Importantly, GMD is most
sensitive to age: 30% and 40% of variance of mean brain GMD is explained by
age at scan time for males and females respectively. CT follows with
respective values of 30% and 24%, while only 7% and 10% of variance of total
brain GMV is explained by age for males and females respectively.
Whole-brain sex differences: Females have lower volume, higher density than males
Females were found to have lower total GMV than males, as expected by
known sex differences in average head and brain size. At the same time,
however, we show that females have higher mean GMD than males. Total CT
was not significantly different between the two sexes in our analysis (Figure
2.2).
Regional variability in age-related and sex effects
To achieve regional specificity, we created a high-resolution parcellation
covering the whole brain gray matter and consisting of 1625 regions. To
summarize the large number of regional results, each of the 1625 gray matter
parcels was assigned one of nine MNI labels (Frontal Lobe, Temporal Lobe,
Parietal Lobe, Occipital Lobe, Insula, Caudate, Putamen, Thalamus, and
Cerebellum), as defined by the MNI atlas in FSL. Table 2.1 presents summary
highest coefficient of variation (mean
CV = 26.7 and 26.0, respectively),
followed by CT (mean CV = 15.6). GMD
showed the lowest CV (mean CV = 3.7).
Parcel-wise GAMs were fitted to
investigate the regional variability of
age-related and sex effects in our
sample (1625 parcels for GMD, GMV,
Table 2.3 Generalized additive models: FDR threshold and median p values. M, Male; F, Female; Threshold, unadjusted p value corresponding to FDR q value of 0.05;
Median, median of unadjusted p values surviving FDR correction.
and GMM; 1339 for CT). Table 2.2 shows the percentage of parcels with
significant main effect of age, main effect of sex, and age-by-sex interaction
after FDR correction (q = 0.05), aggregated by MNI label. GMD showed
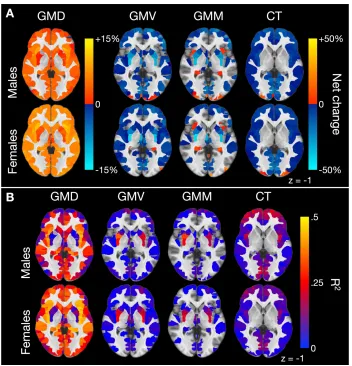
Figure 2.3 Percentage net change and variance explained by sex and modality. A, For each parcel, the percentage net change was calculated as follows: (fitted value at 23 fitted value at 8)/(fitted value at 8) 100%. GMD increased virtually throughout the brain, while the other modalities show mostly decreases. Females showed a greater increase in density than males throughout the brain. B, Percentage variance of each measure explained by age. GMD showed the highest R2 values, followed by CT. High bilateral
significant age effects throughout the brain (99% of parcels in males, 99.9%
in females), followed by CT (89% males, 88% females). GMV, on the other
hand, showed significant age effects only in 52% and 65% of parcels in males
and females respectively, while the numbers for GMM were 41% and 33%. Sex
effects were strong for GMD, GMV, and GMM. Indeed, main effect of sex was
more widespread than main effect of age in GMV and GMM. Sex effects in CT
were present in a minority of regions across the whole brain, but in just over
half of all temporal and parietal parcels. Age-by-sex interactions were
virtually limited to GMD. Table 2.3 shows the unadjusted p-value
corresponding to FDR q-value of 0.05 and the median of unadjusted p-values
surviving FDR correction.
To study the direction of age-related effects in each parcel, the net
change from youngest to oldest was estimated by subtracting the fitted value
at 8 years from the fitted value at 23 years for each modality, sex, and region
and converted to a percentage (by dividing with the fitted values at 8 years).
Net change for parcels not surviving FDR correction was set to zero. GMD
increased, on average, within all MNI labels, while GMV and CT decreased.
Mean GMM decreased in all MNI regions other than the temporal lobe, insula,
and cerebellum. The bilateral insula stands out showing the highest increase
in GMD and GMM of all MNI regions. To characterize each parcel’s sensitivity
to age, we examined each model’s adjusted R2, denoting percent variance of
percent change for each modality. Averaging by MNI label masks the
variability within each label, for example, a lobe may on average decrease in
volume, but some parcels within it may increase. For this reason, Table 2.4
includes numbers of individual parcels with a net positive and net negative
change from 8 to 23 years within each MNI label. Brain slices mapping net
change and R2 for each modality are shown in Figure 2.3 and are available in
interactive format online (https://egenn.github.io/gmdvdev.html).
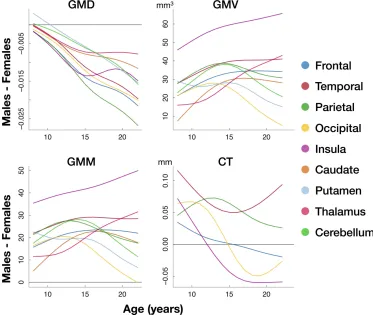
Figure 2.4 helps describe how development modulates sex effects by
plotting the average difference of male and female fitted values per modality
per MNI region by age from 8 to 23 years. Males and females have no
differences in GMD at age 8, but females start to lead soon thereafter
throughout the brain. Males have higher GMV and GMM on average in each
MNI region throughout this age range. Only CT shows a change in the
direction of sex differences with age. Males have higher CT in bilateral insula
until about age 12 and in frontal and occipital lobes until age 15, at which
Table 2.4 Net percent change from 8 to 23 years and variance explained by MNI label.
points the effect reverses leading to a female advantage. In most cases, the
sex differences have a nonlinear relationship with age.
GMM largely resembles GMV, not GMD
We defined GMM as the product of GMD and GMV in order to study a
native-space equivalent of modulated density, a very popular measure in structural
neuroimaging studies. GMM showed age-related effects that, for the most
part, closely paralleled those of GMV (Figure 2.5). This is probably because
GMV has much higher variance than GMD (Table 2.1), and consequently
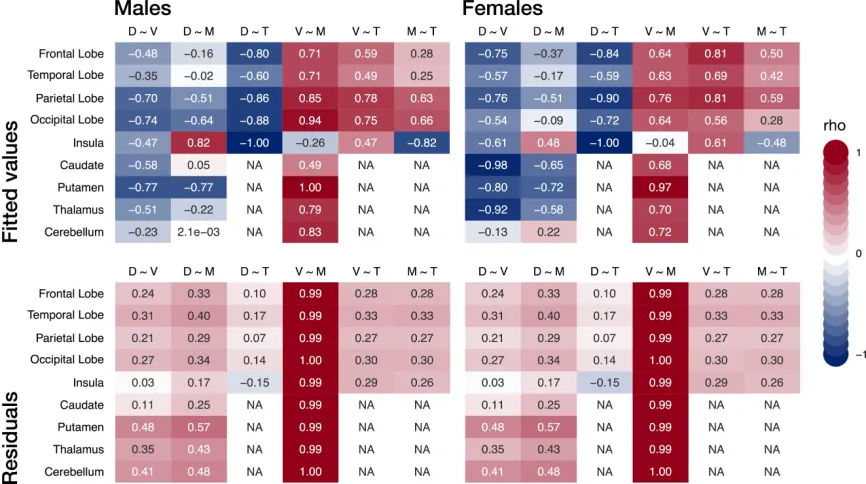
Figure 2.5 Intermodal correlations averaged by MNI label. Pairwise spearman correlations (rho) were estimated between the fitted values of model 3 (top row) of all gray matter measures to summarize the similarity of age-related effects among
modalities and between their residuals (bottom row). Brain slices with these results are available on-line at https://egenn.github.io/gmdvdev/imcor.html. D, Gray matter density;
contributes much more to the variance in GMM explained by age than GMD
does. Despite this, three MNI regions showed, on average, opposite direction
of net change in GMM than in GMV, i.e. an increase instead of a decrease.
This was observed in both males and females, in descending order of
magnitude, in the insula, the temporal lobe, and the cerebellum (Table 2.4).
Development modulates intermodal relationships among structural measures
To summarize the differences in age-related effects among the four measures
with a single quantity, we calculated pairwise correlation coefficients of fitted
values for our sample’s age range (8 - 23 y.o.; Figure 2.5, top row). Spearman
correlation was used as most fitted values are non-linear. As expected from
the results above, GMD was negatively correlated with GMV and CT
throughout the brain and cortex respectively. GMM was positively correlated
with GMV and CT in all MNI regions, on average, with the exception of the
insula. Looking at the same pairwise correlations among the residuals, i.e.
after removing the effect of age, we see that most correlations are positive,
with notable exception of the density and thickness pair in the insula (Figure
2.5, bottom row). Intermodal correlations of residuals help suggest what
relationships may look like in the absence of an age effect but are no
substitute for directly examining separate age bins, which should ideally
DISCUSSION
Despite extensive use of different MRI-derived gray matter measures in the
literature, very few attempts have been made to directly compare them or
their developmental patterns, and they are often wrongly assumed to be
equivalent. This study shows distinct age-related effects and sex differences
on whole brain and regional measures of gray matter density (GMD), volume
(GMV), mass (GMM = GMD * GMV), and cortical thickness (CT) in a
cross-sectional dataset of 1189 youths aged 8 to 23 years drawn from the
Philadelphia Neurodevelopmental Cohort. A custom T1 preprocessing pipeline
and a novel high-resolution gray matter parcellation were created in order to
produce unbiased gray matter segmentations without use of priors, and to
extract native space measures without any interpolation or smoothing. Our
findings partly challenge the widely-held, though vague, view that “gray
matter declines” from childhood to young adulthood, and provide a more
complete description of developmental gray matter differences.
Not all gray matter declines in adolescence
Mean brain GMD increases from childhood to young adulthood, while total
brain GMV and mean CT decrease. Total GMM only shows a slight decrease
from 8 to 23 years, suggesting that an increase in density may partly counter
a decrease in volume. Regionally, GMD increases virtually throughout the
subcortical regions, but there are parcels within those broad regions whose
volume increases, particularly in frontotemporal cortex. Future work will
determine whether areas that expand during adolescence despite an overall
decline in volume support the enhancement of specific neurocognitive
functions.
Age-related effects and sex differences in density may help understand cognitive
abilities
We know that higher GMV correlates with higher neurocognitive performance
in adults (Gur et al., 1999; McDaniel, 2005), which gives rise to two apparent
paradoxes: 1. Adolescence is characterized by a sharp rise in neurocognitive
performance (Gur and Gur, 2016), despite a decline in GMV. 2. There are no
significant sex differences in general intelligence (Halpern et al., 2007),
despite a male advantage in GMV. Our results suggest that age-associated
volume decrease might be compensated for by increasing gray matter density
during adolescence and lower volume in females might be compensated for by
higher density throughout the brain.
Biological basis of structural MR measures: the need for large scale, quantitative
histological – MRI studies
The above findings beg the question: What do GMD and the other gray matter
measures mean in terms of biology? Multiple studies have shown that the T1
significantly within cortical gray matter (Stüber et al., 2014). Surprisingly,
only few attempts have been made to quantify the relationships among
histological features and MRI-derived structural measures. A large number of
studies using T1-weighted imaging to quantify gray matter have focused on
neurodegeneration. Such diseases result in neuronal loss which causes direct
decreases in all gray matter measures. This may partly explain the confusion
that has led to these measures often being considered highly correlated or
equivalent, and even grouped together in meta-analyses (for example, see
(Shao et al., 2014). However, in the context of normal brain structure, or in
brain disease without extensive neuronal loss, including most psychiatric
disorders, regional and global variation in different gray matter measures
may be less correlated, even anti-correlated, as seen here between GMD and
GMV. We expect that MRI-derived gray matter measures are differentially
determined by a set of histological factors, including neuronal and glial
number and size, dendritic arborization, number of axonal projections and
extent of myelination. Their effects will vary by age, brain region, and cortical
layer.
In adolescence, MRI-estimated decline in gray matter volume is
generally attributed to a combination of synaptic pruning of exuberant
connections, a regressive event, and increasing myelination, a progressive
event, both essential aspects of normal development (Stiles and Jernigan,
may have multiple direct and indirect effects on T1-based gray matter
quantification. White matter myelination and expansion may result in a
physical outwards shift of the gray-white matter boundary causing gray
matter to compact and leading to decreases in GMV and CT and increases in
GMD. Alternatively, myelination near the gray-white border may increase
signal intensity in voxels nearest the border enough to switch their
classification from gray to white, which would lead to reduction of volume
and thickness measurements but have no effect on density, since these voxels
would be now excluded from any gray matter parcels. At the same time,
cortical gray matter also contains substantial amounts of myelinated fibers
with significant regional variability (Nieuwenhuys, 2013) and intracortical
myelin also increases during adolescence (Grydeland et al., 2013). Increasing
cortical myelination would lead to a decrease in estimated GMD, which means
that GMD increases reported in this study are possibly underestimates.
Rabinowicz et al performed stereologic morphometry in six males and five
females aged 12 to 24 years and reported significantly higher neuronal
densities and neuronal number estimates in males than females, but no sex
differences in cortical thickness, suggesting higher neuropil mass / increased
neuronal processes in the female cortex (Rabinowicz et al., 2009), which
might explain our findings of higher GMD in females.
We chose to compare four different measures of regional gray matter in
cortical surface area and gyrification index can also be derived from T1 images
in surface space analyses. The limited positive correlation we found between
GMV and CT age-related effects is probably explained by independent
changes in surface area and gyrification (Raznahan et al., 2011). While the
majority of brain regions show significant sex effects on GMV as expected, a
minority of regions showed a significant sex effect on CT. Considering that
gray matter volume roughly equals surface area times cortical thickness, we
expect surface area to exhibit more extensive sex differences than thickness.
We limited our analysis to volumetric space measures in order to use the
same parcellation for each measure and avoid the extra resampling and
registration errors introduced in the conversion between the two spaces
(Klein et al., 2010). For the same reason, care must be taken when comparing
volumetric and surface space analyses.
Given the important gaps in our understanding of the links between
biology and imaging, it is crucial to design large-scale, combined MRI and
histological quantification studies to fully characterize the neurobiological
basis of raw MRI signals and derived measures. Biophysical modeling of
MR-derived measures will enable accurate noninvasive in vivo prediction of
histological features (Stiles and Jernigan, 2010). This will be crucial in
elevating the potential of neuroimaging in the investigation of nervous
system physiology and pathology, disease diagnosis, and treatment
Limitations and implication for future work: Phenotypes of structural brain
development and links to cognition
The cross-sectional design of this study was its main limitation. Ongoing
longitudinal studies will provide true measures of developmental change and
allow the analysis of inter-individual differences in development. Future
studies would also benefit from inclusion of more MRI modalities. New
diffusion-weighted MRI techniques like neurite orientation dispersion and
density imaging (NODDI) may provide rich information on gray matter
structure and complement T1 and T2 signals (Zhang et al., 2012). Histological
morphometry has shown cortical layer- and type-specific changes in
neuronal cell bodies (Rabinowicz et al., 2009), which cannot be resolved with
today’s common MRI sequences but this may be possible in the future. We
must note that while different segmentation software employ similar
methods for GMD estimation, results are dependent on parameter selection.
Correlation with histology will also help guide these choices and optimize
pipelines to produce measures with maximal biological interpretability.
Our results demonstrate that GMD, GMV, and CT must be considered
distinct and complementary. They also further emphasize the need for
nonlinear modeling and accounting for sex differences. We found that GMD
and CT are most sensitive to age, which makes them prime candidate
biomarkers of brain development. In contrast, modulated density or GMM
consider GMD and GMV independently. We also show that intermodal
relationships change with age, which further emphasizes that neuroimaging
findings should not be generalized from one age period to another. We have
previously shown that structural covariance networks develop during
childhood to mirror adult functional intrinsic connectivity networks (Zielinski
et al., 2010a). Ongoing work aims to identify how different structural
measures can be best applied to study cognition and disease.
As we advance from group-level to individual-level studies, from
unimodal to multimodal analyses, and from descriptive to predictive models
with the aim of integrating neuroimaging into clinical practice, it is essential
to make best use of all available data. The first step is to understand available
measures and the relationships among them. Development is a critical
dimension on which these relationships may vary and adds to the challenge
and the importance of this task.
The work in this chapter was published in the Journal of Neuroscience (Gennatas
et al., 2017) and was featured on the cover of the May 17, 2017 issue (http://
3. GRAY MATTER INCREASINGLY PREDICTS COGNITIVE
PERFORMANCE DURING ADOLESCENCE
INTRODUCTION
The prospect of predicting people’s cognitive ability has always fascinated
man. A large part of Neuroscience, and particularly Cognitive Neuroscience, is
broadly concerned with understanding how the brain gives rise to the mind. A
complete characterization of the vast networks of interactions from genes and
molecules to cells, circuits, systems, to the whole brain and, finally, behavior
may be very far off. However, it is possible to use brain data to predict clinical
and cognitive outcomes, despite an incomplete understanding of the
underlying biology. Such work can feed back into both basic neuroscientific
research and clinical applications.
Early work in the field looked into correlations of intelligence with
measures of head size and, later, MRI-derived estimates of whole brain
volume. A meta-analysis of 37 datasets estimated population correlation
between brain size and intelligence at 0.33 (McDaniel, 2005). Later studies
focused on regional correlations, attempting to localize brain regions most
contributing to intelligence, but were limited to mass-univariate analyses
(Narr et al., 2007), which ignore relationships among brain regions and
interactions. Multivariate predictive models trained on structural brain data
have mostly focused on age prediction (Franke et al., 2012), in some cases
In this study, we train models to compare the ability of four structural
brain measures derived from T1-weighted MRI to predict performance in a
verbal reasoning task collected on the Philadelphia Neurodevelopmental
Cohort using the Computerized Neurocognitive Battery (CNB) (Gur et al.,
2010). The CNB has been widely administered in multiple settings and
populations and translated to over fifteen languages. Instead of deriving a
study-specific general factor, we chose a verbal reasoning (completing
analogies) as the outcome of interest, which is known to correlate strongly
with overall performance (Moore et al., 2015) and is one of the most
commonly tested domains in standardized and other aptitude tests. We
hypothesized that prediction accuracy of cognitive performance from gray
matter measures increases with age, but made no prediction as to which
measure would be the best predictor. We report that gray matter alone can
predict up to 20% of variance in verbal reasoning performance of young
adults estimated on out-of-sample data using 10-fold cross-validation.
MATERIALS AND METHODS
Subjects and neuroimaging
Subject selection and quality assessment of T1-weighted imaging was
performed as described in Chapter 2, Materials and Methods. Of the initial 1189
subjects, 899 (478 females) with a valid CNB collected within twelve months
T1-derived measures of gray matter described in Chapter 2: gray matter density
(GMD), gray matter volume (GMV), gray matter mass (GMM = GMD x GMV),
and cortical thickness (CT), extracted from the same high-resolution
parcellation (PNC-GMD1625, Figure 2.1). In order to study the effect of age on
the prediction of cognitive performance and check for an interaction between
brain data and age on prediction accuracy, the sample was stratified on age by
splitting into terciles: Children (N = 299, 153 females; 8 – 12.7 years),
Adolescents (N = 373, 192 females, 12.7 – 17.3 years), and Young Adults (N =
227, 133 females, 17.3 – 22 years).
Generalized Additive Models: Whole brain data & age
Models were trained to predict verbal reasoning scores from gray matter
measures at two different scales: whole brain data (single value per gray
matter measure) and regional brain data derived from the PNC-GMD1625
parcellation (GMD, GMV, GMM: N = 1625; CT: N = 1339 gray matter parcels).
Whole brain mean GMD, total GMV, total GMM, and mean CT were used to
predict verbal reasoning in each age tercile using Generalized Additive Models
(GAMs) within the rtemispackage (see Chapter 4). The learnCVfunction of
rtemis was used to perform 10-fold cross-validation for model testing and
average test set mean squared error (MSE) was calculated for each gray
A common concern in developmental neuroimaging studies is
controlling or correcting predictors and/or outcomes for age. Since most, if
not all, measures of brain and performance and indeed many unrelated
measures and artifacts correlate with age, it is easy to derive spurious
correlations driven by age. However correcting for age can lead to signal loss
and/or introduction of artifact. We chose not to age-regress either the
neuroimaging data or the cognitive scores and instead used age stratification
as described above. On top of that, cross-validated prediction of verbal
reasoning scores from age alone was performed for each modality for each
age group using Generalized Additive Models to measure directly the
predictive power of age on performance.
Gradient Boosting: High dimensional regional brain data
Predictive models from high dimensional data were trained for each modality
for each age group using gradient boosting of linear models as implemented
in the XGBoost package (Chen and Guestrin, 2016). All training was performed
again using the learnCVfunction within rtemis (Figure 3.1) to perform nested
resampling for model tuning and testing. 10-fold cross-validation was used
for testing (outer resampling). For each fold, 10 stratified bootstraps of the
training set (inner resampling) were used to tune the L2 regularization
weight (range: 0 - .3), and the number of boosting iterations using an early
Models were trained with this procedure to predict verbal reasoning scores
from GMD, GMV, GMM, and CT regional values, in turn, for each age tercile.
Boosting of linear models was used for these high-dimensional datasets as
execution times are orders of magnitude shorter than boosting trees.
Parcelwise (mass-univariate) correlations were estimated between each gray
matter measure and verbal reasoning scores to qualitatively compare
univariate and multivariate effects at each age group.
RESULTS
Regional gray matter correlates weakly with verbal reasoning
Mean parcelwise correlations of GMV with performance are stable from
childhood to adolescence at 0.10 and increase slightly into young adulthood to
0.15. On the other hand, an average correlation of 0.12 between GMD and
performance in children diminishes to -0.04 in adolescence and -0.07 in
Example learnCV call for model tuning and testing:
LAN.GMD.MF3 <- learnCV(x = GMD.MF3, y = LAN.MF3, 'xgblin',
params = list(lambda = seq(0, .3, .1),
resampler = 'strat.boot'),
outdir = '/Projects/CNBpredict/LAN.GMD.MF3/')
young adulthood. Density plots of correlation values between regional gray
matter and verbal reasoning are shown in Figure 3.2.
Whole brain volume is a good predictor of verbal reasoning
At the whole brain level, Generalized Additive Models reveal that GMV is the
best predictor of performance, particularly in the oldest group, where it
explains 20% of the variance, estimated after 10-fold cross-validation. Mean
whole brain GMD and CT fail to predict performance. GMM (= GMD x GMV)
was included for comparison and is shown to track GMV for the most part and
will not be discussed further.
Figure 3.2 Density plots of parcelwise Spearman correlations between regional gray matter measures and verbal reasoning (GMD, GMV, GMM: N = 1625; CT: N = 1339 parcels). GMD, gray matter density; GMV, gray matter volume; GMM, gray matter mass;
Multivariate models of regional GMD increasingly predict performance
Using the full high-dimensional dataset of each modality, we trained
multivariate models using an efficient procedure of linear model boosting to
predict verbal reasoning. Patterns of GMD are the best predictors of
performance, showing an increase in prediction accuracy from childhood to
young adulthood, when it reaches 20% of explained variance, on average,
after 10-fold cross-validation. GMV and CT trail behind at around 10% of
variance explained in the young adult group.
Age predicts performance only in children
To ensure that the above results are not driven by shared correlations of
predictors and outcome with age, we trained Generalized Additive Models to
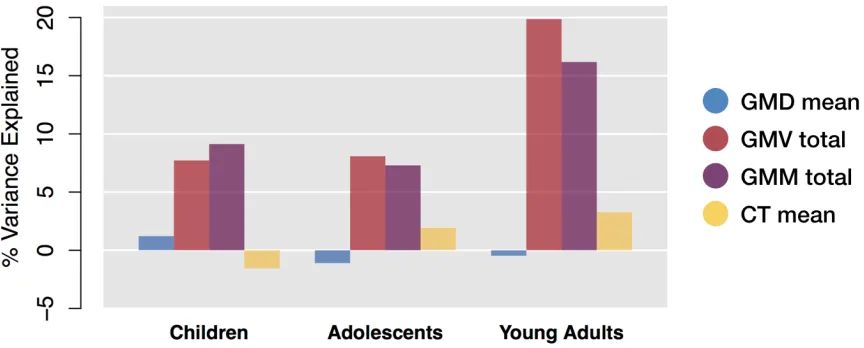
predict performance from age alone for each age group. Interestingly, age
explained 13% of variance in verbal reasoning scores in the children’s group
and not at all in the other two (R-squared = -0.92% and -1.71% for
adolescents and young adults respectively). This suggests that mean regional
GMD correlation within the children group may be driven by age (mean r =
0.12, Figure 3.2), and demonstrates that the predictive power of whole brain
GMV or regional GMD in the young adult group are not driven by age at all
(Figures 3.3, 3.4).
DISCUSSION
Following the findings in Chapter 2 where we showed that different gray
matter measures exhibit distinct age-related and sex effects during
development from childhood to young adulthood, we suggested that they
should be treated as independent and complementary. We then set out to
examine how they compare in their ability to predict a measure of cognitive
performance. We chose to study verbal reasoning, a measure that correlates
very highly with overall intelligence, and which was collected on the
Philadelphia Neurodevelopmental Cohort as part of the Computerized
Neurocognitive Battery. We have previously shown that structural covariance
of modulated gray matter density (volume) increasingly mirrors resting state
functional connectivity from childhood to young adulthood (Zielinski et al.,
2010b). We hypothesized that structural-functional relationships grow
stronger with age as developmental structural changes slow down and
functional activation patterns stabilize.
We showed that prediction accuracy of verbal reasoning scores
increases with age as predicted. Interestingly, whole brain GMV alone was a
good predictor of verbal reasoning, explaining 20% of variance, but
multivariate patterns of GMV, using measures from 1625 gray matter regions
as predictors, failed to reach the same level of accuracy, explaining only 10%
of variance. In contrast, mean brain GMD did not predict performance at all,
but multivariate analysis of GMD explained 20% of variance in performance.
This example emphasizes the power of multivariate models in neuroimaging
even in the absence of strong mass-univariate results.
The main limitation of this work was the sample size after dividing
into three age bins, which limited performance of the multivariate models.
Because of the small sample size, the two sexes were considered together.
age range each, separately for males and females. Interestingly, our results
suggest that a sweet spot exists in the resolution of brain parcellation, which
would likely be different for each measure and should ideally be tuned in the
future. Ongoing work is looking to address this in two ways: through direct
comparison of multiple parcellations of variable resolution, and by sparse
decompositions of high resolution data with variable number of dimensions