FLOW OVER NACA-4415 AEROFOIL AT EXTREME
REYNOLDS NUMBERS
Kamma Pradeep
1, Enugurthi Manasa
2, Adimulam Neha
31, 2, 3
Student, Mechanical Engineering, CVR College of Engineering (India)
ABSTRACT
Computational Flow analysis is done on NACA Aerofoil 4415 at low and high Reynolds number. Flow is
considered when Aerofoil is at zero degrees angle of attack & Reynolds numbers 5000, 6000, 100000 &
120000. Lift and drag forces, velocity vectors, counters of pressure and velocity are considered to analyze and
compare the flow when Reynolds number increases. At Reynolds number 6000 the aerofoil shows maximum
coefficient of lift and drag. At extremely high Reynolds numbers the aerofoil doesn’t show any significant effect
even with increase in Reynolds number.
Keywords: Aerofoil, Contours of velocity and pressure, Fluent, Leading Edge, Trailing Edge
I. INTRODUCTION
Aerofoil’s and aerodynamic shaped objects are extensively used in all types of air vehicles for example
space shuttle, aircrafts, helicopters and even in various types of missiles. Besides, when it comes to fluid
machineries such as pump, turbine, windmill, the shape of impeller, propeller is very important. Historically,
interest in low Reynolds number aerodynamics has been restricted to model radio controlled aircraft
applications and did not garner a great deal of scientific interest. This situation is changing with the interest in
small unmanned aerial vehicles, predominantly for military purposes. As such, our understanding of low
Reynolds number flow over airfoils is limited to a few sources that are growing as time evolves [1-4]. Observation
made in the Selig work was that they could not reliably measure airfoil characteristics if the Reynolds number
fell below 40,000 due to flow unsteadiness. Vortex shedding and instability at low-Reynolds numbers using
smoke-streak and hot-wires measurements of the flow over a NACA 0012 airfoil [5].Attack angle on the
non-stationary aerodynamic characteristics and flutter resistance of a grid of bent vibrating compressor blades shows
significant effect [6]. Spoiler position on aerodynamics characteristic of an aero foil shows significant effect [7]. A
computational study of unsteady boundary-layer separation over an Eppler 387 airfoil at low- Reynolds numbers
done appears to support this view [8].
The rapid evolution of CFD has been driven for faster and accurate method for solving problems related to
aerodynamics. The flow of air over the aerofoil’s is the most important thing that has to be considered during
designing an aircraft, missile, sport vehicles or any other aerodynamic objects. Analyzing the flow of a
compressible fluid is always complex and consists of different terms and characteristics. By using ANSYS, flow
analysis becomes more effective as it investigates everything more thoroughly than experimental method.CFD
II.COMPUTATIONAL METHODOLOGIES
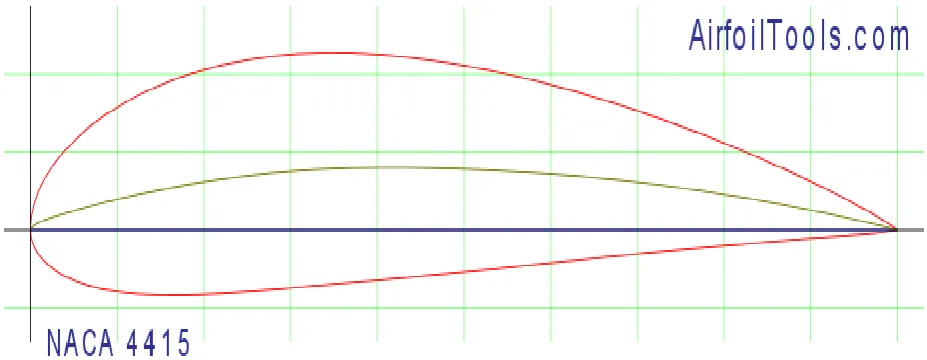
Computational analysis is carried out to solve a flow field in two-dimensional NACA 4415 Aerofoil to analyze
flow characteristics, and the effect of increase Reynolds number.Aerofoil is generated by using an online
aerofoil generator from which the co-ordinates were imported to create the geometry of that aerofoil. After
obtaining the co-ordinates, they were imported to Ansys 14.0 Workbench for creating the desired geometry. The
2D view of the aerofoil was shown in Fig.2.1. Standard k−ε model is used to predict the flow field. A UN steady
state based implicit solver is used to achieve convergence. Second-order upwind scheme was used for the
discretization of all the equations to achieve higher accuracy in results. Velocity-pressure coupling is established
by pressure-velocity correlation using a PISO algorithm. Under-relaxation factors are used for all equation to
satisfy Scarborough condition. Residuals are continuously monitored for continuity, x-velocity, y-velocity, z
-velocity, k, and ε. Convergence of the solution is assumed when the values of all residuals goes below 10-6
Enhanced wall treatment is used to solve for the near wall treatment, as y+ is more than 30 in the whole
domain.
Fig 2.1: 2D view of NACA 4415 aerofoil
III. RESULTS AND DISCUSSION
Velocity vectors, contours of pressure and velocity and coefficient of drag have taken to analyze the flow over
NACA 4415 aerofoil at Reynolds no.5000, 6000, 100000, and 120000. Snaps of velocity vectors and contours
of pressure and velocity taken for each and every model to give detailed view of the flow.
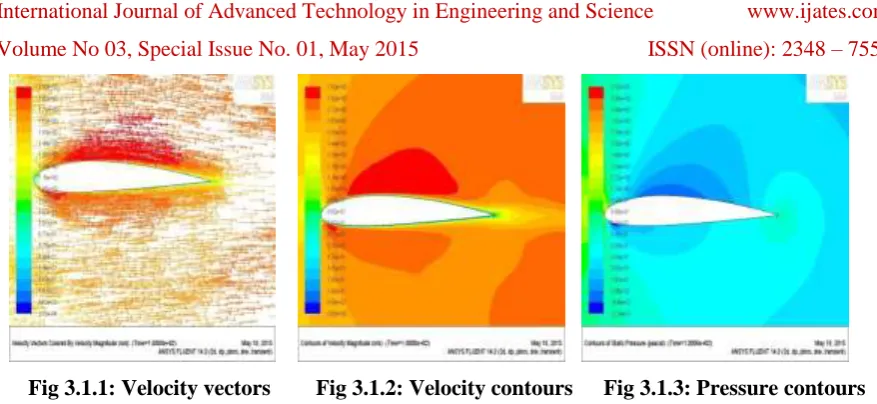
3.1 Flow at Reynolds Number 5000
Figures 3.1.1, 3.1.2, 3.1.3 show the velocity vectors, contours of velocity and pressure at Reynolds no. 5000. At
this low Reynolds number flow is steady laminar and no vortex formation behind the trailing edge. Contours of
pressure and velocity show the formation low and high pressure on top and bottom part of the aerofoil. This has
Fig 3.1.1: Velocity vectors
Fig 3.1.2: Velocity contours Fig 3.1.3: Pressure contours
3.2 Flow at Reynolds Number 6000
Figures 3.2.1, 3.2.2, 3.2.3 show the velocity vectors, contours of velocity and pressure at Reynolds no. 6000. At
this low Reynolds number flow is steady laminar and no vortex formation behind the trailing edge. Contours of
pressure and velocity show the formation low and high pressure on top and bottom part of the aerofoil. This has
to create lift force
Fig 3.2.1: Velocity vectors Fig 3.2.1: Velocity contours Fig 3.2.3: Pressure contours
As the increasing Reynolds number in low Reynolds region there is no significant effect on the flow.
3.3 Flow at Reynolds Number 100000
Figures 3.3.1, 3.3.2, 3.3.3 show the velocity vectors, contours of velocity and pressure at Reynolds no. 100000.
At this low Reynolds number flow is steady laminar and no vortex formation behind the trailing edge. Contours
of pressure and velocity show the formation low and high pressure on top and bottom part of the aerofoil. This
has to create lift force. Compared to the low Reynolds number contour shows the pressure and velocity regions
formation changes around the aerofoil
Fig 3.3.1: Velocity vectors Fig 3.3.2: Velocity contours
3.4 Flow at Reynolds Number 120000
Figures 3.4.1, 3.4.2, 3.4.3 show the velocity vectors, contours of velocity and pressure at Reynolds no. 120000.
At this low Reynolds number flow is steady laminar and no vortex formation behind the trailing edge. Contours
of pressure and velocity show the formation low and high pressure on top and bottom part of the aerofoil. This
has to create lift force.
3.4.1: Velocity vector Fig 3.4.2: Velocity contour Fig 3.4.3: Pressure contours
As the increase in Reynolds number in High Reynolds number region contours of velocity and pressure shows
drastic change in region formation at upper part of the flow and is carry forward to behind the plate there is
significant effect on the flow. High velocity region covers throughout the upper part of the aerofoil which
compared to the flow at Reynolds number of 100000.
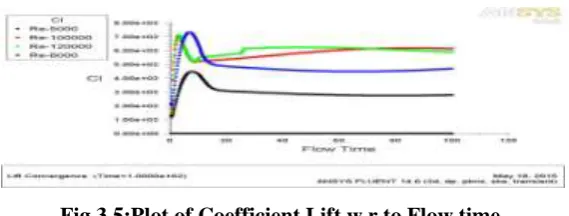
3.4 Effect of Coefficient of Lift
Fig 3.5:Plot of Coefficient Lift w.r.to Flow time.
At Reynolds number 6000 aerofoil has maximum coefficient of lift and at Reynolds number 5000 it has
minimum Coefficient of lift. As Reynolds number increases from 100000 to 120000 no significant effect in
coefficient of lift at starting time and later it shows effect.
3.5 Effect of Coefficient of Drag
As we increase Reynolds number in high zone there is no significant effect on coefficient of drag. At Reynolds
number 6000 it has maximum coefficient of drag compared to all other Reynolds number.
IV. CONCLUSION
Flow analysis is done NACA 4415 aerofoil at Reynolds number 5000, 6000,100000 and 120000.In the low
Reynolds number region with the increase in Reynolds numberthere is no significant effect on regions
surrounded by the aerofoil. Coefficient of drag is increased as Reynolds number increases. In the high Reynolds
number as the Reynolds number increases drastic changes in the pressure regions on aerofoil surfaces and
behind the aerofoil region.
REFERENCES
[1] Selig, M.S., Donovan, J.F., and Fraser, D.B., Airfoils at Low Speeds, Soartech 8, Soartech Publications,
Virginia Beach, U.S.A, 1989.
[2] Selig, M.S., Guglielmo, J.J., Broeren, A.P. and Giguere, P., Summary of Low Speeds Airfoil Data, Volume
1, Soartech Publications, Virginia Beach,U.S.A., 1995.
[3] Selig, M.S., Lyon, C.A., Giguere, P., Ninham, C.P. and Guglielmo, J.J.,Summary of Low Speeds Airfoil
Data, Volume 2, Soartech Publications, Virginia Beach, U.S.A., 1996.
[4] Lyon, C.A., Broeren, A.P, Giguere, P., Gopalarathnam, A. and Selig, M.S., Summary of Low Speeds
Airfoil Data, Volume 3, Soartech Publications, Virginia Beach, U.S.A., 1997.
[5] R.F. Huang, and C.L. Lin, Vortex Shedding and Shear-Layer Instabilities of Wing at Low-Reynolds
Numbers, AIAA Journal, 33(8), pp. 1398-1403, 1995.
[6] A.G Chervonenko, 1991, Effect of attack Angle on the Nonstationary Aerodynamic Characteristics and
Flutter Resistance of a Grid of Bent Vibrating Compressor Blades, Ukrainian Academy of Sciences,
Plenum Publishing Corporation, Ukraine, Volume 39, No. 10, pp. 78-81.
[7] Mohammad Mashud, MausumiFerdous, ShahriarHossainOmee, 2012, Effect of Spoiler Position on
Aerodynamic Characteristics of an Airfoil, International Journal of Mechanical and Mechatronics
Engineering, Bangladesh, Volume 12, No. 6
[8] J.C.M. Lin and L.L. Pauley, Low-Reynold-Number Separation on an Airfoil, AIAA Journal, 34(8), pp.