New development of the projected shell model and description of low-lying
collective states in transitional nuclei
Fang-Qi Chen1,aand Yang Sun1,2,b
1Department of Physics and Astronomy, Shanghai Jiao Tong University, Shanghai 200240, People’s Republic of China
2Institute of Modern Physics, Chinese Academy of Sciences, Lanzhou 730000, People’s Republic of China
Abstract.Description of the interplay between different nuclear shapes is an interesting but challenging prob-lem. The original projected shell model (PSM) is applicable to nuclei with fixed shapes. We extend the PSM by superimposing (angular-momentum- and particle-number-) projected product wave functions in the spirit of the generate coordinate method. With this development, the Gd isotopes across theN=90 region are studied, and the results indicate spectroscopic features of shape phase transition with varying neutron number. In order to illustrate the shape distribution in microscopic wave functions, we introduce a deformation representation and show that the collectively excitedKπ=0+states in the Gd isotopes have characters of shape vibration.
1 Introduction
Nuclei are among the few quantum systems where one can discuss them in terms of shape [1]. Different shapes of nu-clei correspond to fundamentally different nuclear wave functions that characterize the microscopic motions of nu-cleons. A large number of nuclei in the nuclear chart can be understood with well-defined shapes, either spherical or deformed. However, there are known cases where more interesting situations can occur, as for instance, coexis-tence of different shapes within one nucleus [2]. Examples are coexistence of normally-deformed and superdeformed prolate shapes [3, 4] or coexistence of two or more shapes around the spherical equilibrium [5, 6]. Shape changes can also occur as nuclei rotate and several rotation-driving phenomena have been known [7–9].
Description of the above-mentioned observations is a challenging task for nuclear theory. The shapes and shape phase transitions have been mostly discussed either in the geometric framework such as the Bohr model [10], or in the algebraic models such as the interacting boson model [11]. In the geometric aspect, analytical solutions can be obtained at the critical point of the phase transition from the spherical to axially deformed shape by using the Bohr Hamiltonian [10]. In the algebraic models, diff er-ent shapes are described by different dynamic symmetrical limits, and the critical points can be found on some spe-cific routes from one symmetrical limit to another [12]. In both of the geometrical and algebraic methods, the shape phase transition is controlled by some parameters, which is varied artificially across the phase transitional region.
It is desired that the variation of shapes can be studied from the microscopic point of view. The shape transition
ae-mail: [email protected] be-mail: [email protected]
in Nd isotopes has been discussed [13] within the relativis-tic mean-field framework, generalized with the generator coordinate method. In Ref. [13], the phase-transition be-havior emerges naturally with increasing neutron number, which can be described simultaneously with other quan-tities such as excitation spectra and transition probabili-ties. The advantage of using microscopic methods is that they can provide wave functions from which one can learn about the insight of the system. However, the microscopic wave functions are given in terms of nucleon degrees of freedom, while "shape phases" are usually defined in terms of collective variables. In principle, there is no way to de-fine a "deformation operator" and use its eigenfunctions to expand microscopic wave functions. This means that it is not possible to directly obtain the wave functions in terms of deformation (as those obtained in geometric cal-culations) by using a simple unitary transformation.
In the present work we report on a new development of the projected shell model [14] by superimposing different intrinsic states corresponding to different deformations. We diagonalize the shell model Hamiltonian by solving the Hill-Wheeler equation [15] in the basis spanned by the angular-momentum- and particle-number-projected states. We propose a transformation for the obtained wave func-tions to a "deformation representation". The transfor-mation is defined with the generator coordinate method (GCM) by using the quadrupole deformation as the gen-erator coordinate. We give a proof that such a GCM wave function written in a nonorthogonal basis can be trans-formed into a deformation representation.
In Sect. 2 we present a general transformation that brings the shell-model wave functions into the deforma-tion representadeforma-tion. A brief introducdeforma-tion for the extension of PSM is given in Sect. 3. The calculated examples and
DOI: 10.1051/
C
Owned by the authors, published by EDP Sciences, 2013 /201363010 0 4
epjconf
their discussions are presented in Sect. 4, and finally in Sect. 5, we draw a conclusion.
2 The deformation representation
We first introduce a transformation of the microscopic wave function
|Ψi=
Z
f(2)|ψ(2)id2 (1)
to thedeformation representation. Equation (1) is a gen-eral wave function expressed as a superposition of wave functions corresponding to different deformations. Gen-erally, |ψ(2)i with deformation 2 is not orthogonal to
ψ(0
2)
E
with another0
2, and therefore, f(2) in (1) is not
a proper quantity to represent the probability of deforma-tion. Assuming that we could define a set of states|2i
with definite deformations2, which form a complete set,
i.e. Z
d2|2ih2|=1, (2)
then the amplitude for the system to have deformation2
can be written as
g(2)=h2|Ψi. (3)
g(2) can be understood as the wave function in the
so-calleddeformation representation. Inserting Eq. (1) into Eq. (3) leads to
g(2)= Z
d20f(20)2|ψ(20)
. (4)
D
2|ψ(20) E
in (4) must satisfy
Z
d00
2
ψ(2)|002 200|ψ(20)
=ψ(2)|ψ(20)
= Π(2, 20),
(5)
where Π(2, 20) is the norm in the Hill-Wheeler
equa-tion [15]. Now the problem is to find an expression for
D
2|ψ(20) E
. In the process of solving the Hill-Wheeler equation,Π(2, 20) should be diagonalized:
Z
d0
2Π(2, 20)uk(20)=nkuk(2). (6)
If we define
Π1/2(
2, 20)=
X
k
uk(2)√nku∗k(02), (7)
we are able to show that Π1/2(
2, 02) satisfies Eq. (5).
Therefore we can use the quantity|g(2)|2to represent the
probability of the system having deformation2.
3 Extension of the projected shell model
The Projected Shell Model (PSM) [14] has been success-ful in the microscopic description of the yrast proper-ties of rotational nuclei and high-spin bands with multi-quasiparticle (qp) structures. For those studies one usually starts with a fixed deformation of the mean-field (with ei-ther axial or triaxial symmetry), and the dynamics is ob-tained through mixing various qp configurations preserv-ing the symmetries. The studied structures are associated with the rotational motion. For a description of vibrations, however, the original PSM [14] has not been successful. In order to apply PSM to the low-lying collective vibra-tions, the model has to be extended to allow the mixing of product states with different deformations.
As in the original PSM one superimposes qp-states with good symmetries, we take projected states associated with different axial deformation,2, and write Eq. (1) as
ΨI,NE=
Z
d2fI,N(2) ˆPIPˆN|Φ0(2)i, (8)
where ˆPIand ˆPN are the projection operators on good an-gular momentum and particle number, restoring the rota-tional symmetry violated in the deformed mean-field and the gauge symmetry violated in the BCS approximation. |Φ0(2)i in (8) is a Nilsson+BCS state, i.e. the qp
vac-uum with deformation 2. For each2, a set of Nilsson
single-particle states can be generated, with the Nilsson parameterκ,µtaken from Ref. [16].
We use discrete values for2, with the bin value∆2=
0.050. The number of the deformation mesh points ranges from 7 to 14, depending on the convergence of the results. With the discrete generator coordinates, the Hill-Wheeler equation becomes
X
j
{DΦ(2i)|HPˆ|Φ(2j)
E
−Ei
D
Φ(2i)|Pˆ|Φ(2j)
E
}f(2j)=0.
(9) The Hamiltonian in Eq. (9) is the same as those used for usual PSM calculations [14]
H=H0−χ
2
X
µ
Q+
µQµ−GMP+P−GQ
X
µ
P+
µPµ. (10)
In the usual PSM calculations, the strength of the quadrupole-quadrupole interaction χ is determined self-consistently with the quadrupole deformation2[14]. As
we now have different deformations, we use in the present work a fixedχcorresponding to2=0.305. The monopole
pairing strengths are taken to be GM = (G1 ∓G2(N − Z)/A)/A, with minus sign for neutrons and plus sign for protons. Here we use G1 = 21.24 MeV and G2 =
13.86 MeV, as given by Ref. [14]. The strength of the quadrupole pairing is taken to beGQ=0.2GM. For all of the presented results we use the same set of parameters.
4 Results and discussions
presented in Fig. 1 as functions of the quadrupole defor-mation parameter2. Here the energy refers to the
expec-tation value of the Hamiltonian operator in the projected Nilsson+BCS state with a specific deformation. In Fig. 1 one can see that for150,152Gd, the minimum of the energy
curves corresponds to vary small values of2, suggesting
that these nuclei are near spherical. For the isotopes with
A ≥ 156, the minima of the curves locate at larger de-formation values (2 > 0.3), indicating that they are
de-formed. It is evident that a widely-distributed, flat-bottom curve is found for154Gd, which is understood as having
a transitional behavior [17]. Thus our calculated energy curves suggest that154Gd lies at the critical point of the
shape phase transition, in agreement with the observation that the shape phase transition happens around the neutron numberN=90.
0.0 0.1 0.2 0.3 0.4
-1 0 1 2 3
E
(
M
e
V
)
2
150 Gd 152
Gd 154
Gd 156
Gd 158
Gd 160
Gd
Figure 1.(Color online) Calculated energy curves for150−160Gd
as functions of quadrupole deformation2.
150 152 154 156 158 160
0 200 400 600 800 1000 1200 1400 1600 1800 2000 2200 2400
E
(
ke
V
)
A
2 + 1
exp
2 + 1
cal
0 + 2
exp
0 + 2
cal
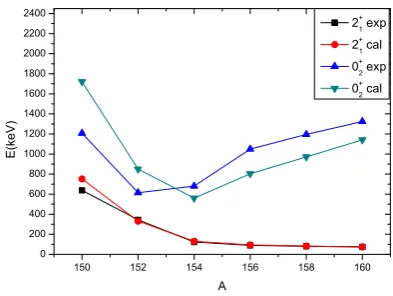
Figure 2.(Color online) Comparison of calculated first 2+state
and second 0+ state for150−160Gd with the experimental data,
taken from Refs. [18–23].
150 152 154 156 158 160
0 20 40 60 80 100 120 140 160 180 200 220 240
B
(
E
2
,
2
+ 1
t
o
0
+ 1
)
(
W
.
u
.
)
A
exp
cal
Figure 3.(Color online) Comparison of calculatedB(E2) values from the first 2+state to the ground state for150−160Gd with the
experimental data, taken from www.nndc.bnl.gov.
For a proper description of transition nuclei, we should not only consider the deformation at the energy minimum, but also other deformations near it. To do so we have to solve the Hill-Wheeler equation (9). The eigenvalues ob-tained for the first 2+ states and the second 0+states are
given in Fig. 2. It can be seen that the lowering of the first 2+ states with increasing neutron number is well
repro-duced by the calculation. Note that the calculations for dif-ferent isotopes are performed with the same set of parame-ters, and therefore, the results in Fig. 2 have demonstrated that our calculation can describe the onset of deformation in a natural manner. It can also be found in Fig. 2 that the calculated excitation energies of the second 0+ states are
also in reasonable agreement with the experimental data. Besides the excitation energies, the calculatedB(E2) val-ues for transitions from the first 2+ state to the ground
state shown in Fig. 3 are also well in coincidence with data. These B(E2) values are calculated with the eff ec-tive chargeseπ =1.5eandeν =0.5e, the standard values used in previous PSM calculations. The smallB(E2) val-ues for150,152Gd are signatures of a near-spherical shape of
these nuclei. On the other hand, the largeB(E2) values of
158,160Gd suggest a typical rotational behavior, which
indi-cates that these isotopes have large quadrupole deforma-tion. The increase of B(E2) values with neutron number indicates the onset of deformation.
There is another experimental indicator for the onset of deformation: the energy ratioR42 =E(4+1)/E(2+1). For
vibrational nuclei (spherical) one hasR42 ∼2.0. For well
deformed nuclei with a rotational spectrumE(I)∝I(I+1), one has R42 ∼ 3.33. At the critical point of shape phase
transition, which is described by theX(5) dynamical sym-metry, one hasR42 ∼3.0 [10]. It is seen in Fig. 4 thatR42
is indeed close to 2.0 for150Gd and to 3.33 for156−160Gd.
For154Gd,R
42 is approximately 3.0, which suggests that
150 152 154 156 158 160 2.0
2.2 2.4 2.6 2.8 3.0 3.2 3.4 3.6
R
4
2
A exp
cal
Figure 4. (Color online) Comparison of calculated energy ratio
E(4+
1)/E(2+1) for150−160Gd with the experimental ones.
As indicated in Eq. (8), the GCM wave functions su-perimpose the symmetry-conserved states with different deformations. This is important particularly for nuclei ly-ing in the transitional region where no definite shape can be associated with them. The effect of performing the GCM type of calculation for those "soft" nuclei can be clearly seen in Figs. 5 and 6. In these two figures, results from two calculations are presented. Black squares corre-spond to the full GCM calculation using Eq. (8) as the trail wave function and red dots to the usual PSM calculation with assumption of a fixed deformation for each nucleus. It can be easily concluded from the figures that for well-deformed nuclei such as156,158,160Gd, there are no much
differences between the results of the two calculations, meaning that the original PSM [14] is a good approxi-mation to the general GCM treatment for well-deformed nuclei. However, qualitative differences in the two calcu-lations are seen for the light isotopes. The much higher 2+excitation energy and much smallerB(E2) transitions
for150,152,154Gd (see the experimental data in Figs. 2 and
3) can only be described by the full GCM treatment. It is not possible that a fixed-deformation approach can de-scribe the transitional properties of the first 2+energy level
and its transition to the ground state.
The results presented above show that the GCM cal-culations using deformation2as the generator coordinate
can provide a reasonable description for the phase transi-tion region observed in these Gd isotopes. It is now of great interest to further explore whether the obtained wave functions can tell us something more about the intrinsic structure of the isotopic chain. We show the wave function distribution in the deformation representation (Eq. (??)) for two representative isotopes 154Gd and160Gd.
Calcu-lated g(2) values for 154,160Gd are shown in Fig. 7. It
is seen that the curve for the first 0+ state is
Gaussian-like, while the functionsg(2) for the second and the third
0+ state oscillate. The second 0+ state has one and the
third 0+ state has two nodes. These forms remind us
150 152 154 156 158 160
0 100 200 300 400 500 600 700 800
E
(
2
+ 1
)
(
W
.
u
.
)
A GCM
Fixed deformation
Gd
Figure 5.(Color online) Comparison of two calculations for the first 2+energy for150−160Gd: black squares corresponding to the
full GCM calculation and red dots to the calculation with a fixed deformation.
150 152 154 156 158 160
0 20 40 60 80 100 120 140 160 180
B
(
E
2
)
(
W
.
u
.
)
A
GCM
Fixed deformation
Gd
Figure 6. (Color online) Comparison of two calculations for
B(E2) transitions from the first 2+state to the ground state for
150−160Gd: black squares corresponding to the full GCM
calcula-tion and red dots to the calculacalcula-tion with a fixed deformacalcula-tion.
to results of a one-dimensional harmonic oscillator, with some anharmonicities as discussed below. The first three 0+states shown here correspond to the ground state,
phonon state, and two-phonon state, respectively, in a one-dimensional harmonic oscillator potential characterized by the coordinate2.
Normalized probability distribution functiong2( 2) for
the ground state 0+
1 and the excited 0+2 state are shown in
Fig. 8. For the 0+
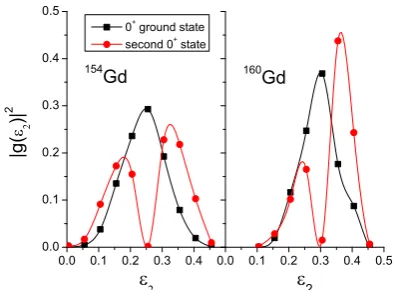
1 state, it exhibits, as expected, a beautiful
Gaussian shape centered at the minimum of the energy sur-face, where the ground-state deformation may be defined. The deformation can be directly read from the figure as
2 =0.25 for154Gd and2 =0.30 for160Gd, respectively.
It is seen that the distribution is wider for154Gd, reflecting
0.0 0.1 0.2 0.3 0.4 -0.6
-0.4 -0.2 0.0 0.2 0.4 0.6 0.8 1.0
0.0 0.1 0.2 0.3 0.4 0.5
2
g
(
)
2
ground state
second 0 + 2
state
third 0 + 3
state 154
Gd
160
Gd
Figure 7. (Color online) Calculated distribution function of de-formation for the first three 0+states in154Gd and160Gd. This
figure is taken from Fig. 3 of Ref. [24].
the 0+
2 state are much extended, with a distribution
min-imum, instead of a maxmin-imum, at the ground-state defor-mation. The dip in the 0+
2 state corresponds to a node in
g(2) in Fig. 7. There is not one, but two separate peaks in
theg2(
2) curve corresponding to the enhanced
probabil-ity at the turning points of the oscillation. Obviously, the distribution in deformation for the 0+
2 states is much more
fragmented, reflecting a vibrational nature of these states. The distribution function g2(
2) describes the
proba-bility that the nucleus has the deformation 2. The
pic-ture shown in Fig. 8 clearly distinguishes the two 0+states.
While for the 0+
1 ground state, the system stays mainly at
system’s deformation with the largest probability, such a probability for the 0+
2 state is very small. For the 0+2 state,
that the two peaks having different heights lie separately at both sides of the equilibrium indicates an anharmonic oscillation. Our calculation suggests a stronger anhar-monicity for the excited 0+
2 state in the strongly-deformed 160Gd. The anharmonicity increases with neutron number
0.0 0.1 0.2 0.3 0.4 0.0
0.1 0.2 0.3 0.4 0.5
0.0 0.1 0.2 0.3 0.4 0.5
|
g
(
)
|
2
0 +
ground state
second 0 +
state
154
Gd
2 160
Gd
Figure 8. (Color online) Calculated probability function of de-formation for the ground state 0+
1and the excited 0+2state in154Gd
and160Gd. Symbols correspond to the discrete deformations used
for the integration in Eq. (8). This figure is taken from Fig. 4 of Ref. [24].
because of the increasing excitation energy, where the po-tential deviates more from an ideal quadratic shape of the harmonic oscillator. Interestingly, the system prefers to have a larger probability in the site of larger deformation, as the peak height at2≈0.38 is obviously higher.
More-over, the distance from a peak to the equilibrium measures the average deviation from the equilibrium. The fact that the distance is larger for154Gd indicates again the softness
of this isotope.
It should be pointed out that the present work does not intend to suggest the nature of the excited 0+state, which
has been a debating question [25, 26]. A final answer to this question requires a microscopic model that can incor-porate all the competing aspects. In the first place, such a model must be able to provide quantitative explanations for the observations [27, 28] before conclusions can be drawn.
5 Summary
The present work describes a step of going beyond the original projected shell model to build many-body wave functions as a superposition of symmetry-conserved states with different quadrupole deformations2. We have
dis-cussed how to incorporate the idea of the generate coor-dinate method that allows interpretation of the wave func-tions in the deformation representation. We have shown, by taking the N = 86−96 isotopes of 150−160Gd as
ex-amples, that with the same set of parameters, the ob-served transitional behavior is reasonably reproduced by our microscopic calculation. It has been found that these states exhibit clear features of quantum oscillations, with large fluctuations in deformation found for soft nuclei and strong anharmonicities for rigidly-deformed nuclei. With a single set of parameters, the characteristic features of qualitatively different systems can be distinguished by the resulting distribution functions, thus providing some mi-croscopic insight for the traditional collective states in nu-clei.
6 Acknowledgment
Valuable discussions with P. Ring and G. Bertsch are ac-knowledged. This work was supported by the National Natural Science Foundation of China (Nos. 11135005 and 11075103) and by the 973 Program of China (No. 2013CB834401).
References
[1] A. Bohr, B. R. Mottelson, Nuclear Structure, Vol. 2 (Benjamin, New York, 1975)
[2] K. Heyde, J. L. Wood, Rev. Mod. Phys. 83, 1467 (2011)
[3] P. J. Nolan, P. J. Twin, Ann. Rev. Nucl. Part. Sci.,38, 533 (1988)
[5] A. N. Andreyevet al., Nature405, 430 (2000) [6] Y. Sun, M. Wiescher, A. Aprahamian, and J. Fisker,
Nucl. Phys. A758, 765 (2005)
[7] P. H. Reganet al., Phys. Rev. Lett.90, 152502 (2003) [8] Y. Sun, P. M. Walker, F.-R. Xu, Y.-X. Liu, Phys. Lett.
B659, 165 (2008)
[9] A. D. Ayangeakaaet al., Phys. Rev. Lett.110, 102501 (2013)
[10] F. Iachello, Phys. Rev. Lett.87, 052502 (2001) [11] F. Iachello, A. Arima,The Interacting Boson Model
(Cambridge University Press, Cambridge, England, 1987)
[12] P. Cejnar, J. Jolie, Phys. Rev. E61, 6237 (2000) [13] T. Niksic, D. Vretenar, G. A. Lalazissis, P. Ring,
Phys. Rev. Lett.99, 092502 (2007)
[14] K. Hara and Y. Sun, Int. J. Mod. Phys. E 4, 637 (1995)
[15] D. J. Hill and J. A. Wheeler, Phys. Rev.89 (1953) 1102.
[16] S. G. Nilsson, Mat. Fys. Medd. Dan. Vidensk. Selsk 29, no. 16 (1955)
[17] P. Cejnar, J. Jolie, R. F. Casten, Rev. Mod. Phys.82, 2155 (2010)
[18] E. Dermateosian, J. K. Tuli, Nuclear Data Sheets75, 827 (1995)
[19] Agda Artna-Cohen, Nucl. Dat. Sheets79(1996) 1 [20] C. W. Reich, Nucl. Dat. Sheets110(2009) 2257 [21] C. W. Reich, Nucl. Dat. Sheets99(203) 753 [22] R. G. Helmer, Nucl. Dat. Sheets101(2004) 325 [23] C. W. Reich, Nucl. Dat. Sheets105(2005) 557 [24] F.-Q. Chen, Y. Sun, P. Ring, Phys. Rev. C, in press [25] P. E. Garrett, J. Phys. G27, R1 (2007)
[26] J. L. Wood, J. Phys. Conf. Ser.403, 012011 (2012) [27] W. D. Kulp, et al., Phys. Rev. Lett. 91, 102501
(2003); Phys. Rev. C71, 041303(R) (2005); Phys. Rev. C77, 061301(R) (2008)