1444 |
P a g e
EFFECTIVENESS OF VIDEO LESSONS USING MOBILE
LEARNING FOR TECHNICAL TEACHERS
J.Hemabala
1, Dr.E.S.M.Suresh
21
Research Scholar, Educational Media Centre, NITTTR, Taramani, Chennai – 600 113(India)
2
Professor & Head, Department of Civil Engineering, NITTTR, Taramani, Chennai – 600 113(India)
ABSTRACT
This research study is used to measure the effectiveness of mobile learning from the engineering teachers and impact on video lesson in the field of teaching and learning education system. The survey were conducted from engineering circuit branch teachers of affiliated colleges and deemed universities in Chennai, India. The survey used for video lesson to teachers and questionnaire is used to evaluate the effectiveness of mobile learning system. The80 engineering faculty were used from Electronics and Communication and Electrical and Electronics, and Bio-Medical Engineering teachers. The teachers are Master’s of Engineering and Technology, Doctor of Philosophy with their qualification, the video lesson used for this study is Electrocardiography, and the duration of the video lesson is 10 minutes. The smart phones, mobile phones and wireless devices tablet pc, personal digital assistants are used for this study. The video lesson can be transferred via Bluetooth technology in leisure hours.
I. INTRODUCTION
Wireless Communication and Technology plays a major role in the field of manufacturing which can be integrated
into mobile phones or wireless devices to provide text based, audio based, multimedia, web-based and video based
material using any type of wireless network GSM, GPRS, Wi-Fi, Bluetooth, Wireless Application Protocol and
Infrared. The devices are easilyavailable and accessible, network detectable anywhere at any time. Mobile learning
is easy to access and highly useful for learners as it can be used at any time any place and reviewed till the learner is
clear with the subject. Teacher‟s advice mobile learning is convenient and helps students to go through the subject.
Learning performance of students can be improved by providing right content at the right time and at the right place
to the right devices and through the right network. Through mobile learning, watching the video significantly
increases student knowledge of the subject area. Mobile learning environment relies heavily on video based
material, which is displayed on a mobile device with a small screen, where the effectiveness of the learning
experience willbe inhibited. While developing video based content for learning or teaching, presentations involve
cost efficiency and quality. Any mobile learning system describes benefits to students and to improve their
performance through the video based learning. The visual representation of a lecture on video usually gets more
1445 |
P a g e
II.LITERATURE SURVEY
Paul Williams and Mary J. Granger (2008) have explained mobile learning is no longer a novelty. Thousands of
post secondary education institutions and millions of workforce and distance education students worldwide consider
m-learning as mainstream, pervasive, learning delivery mode. It is different and alternate approach to face-to-face,
distance learning (D-learning) and Electronic learning (E-learning). A gap exists in the literature regarding the
effectiveness of m-learning. It is important to evaluate this learning delivery mode against face-to-face learning.
This study examines m-learning effectiveness vis-à-vis Face-to-face and investigates the extent to which students
accept the delivery of learning conducted through this new paradigm. A quasi-experimental research design is
proposed to determine the impact to m-learning on student performance and to uncover factors that influence user
acceptance of m-learning. The study is a quasi-experimental non equivalent control group research design with
control group (face-to-face) and treatment group (m-learning) population. The control group receives a face-to-face
lecture, while the treatment group has unlimited access to an m-learning MP3 file recording of the face-to-face
lecture. After the face-to-face lecture, the control group takes a pretest (quiz1) after a week of unlimited access to
MP3 file; the treatment group also takes a pre-test (quiz1). Both groups will then have unlimited access to the MP3
file for one week, during next week, both groups will take part a post-test (quiz2). Seven sections of an
undergraduate information systems required core course participated in this study. Course sections are paired – one
control and one treatment group per pair. The remaining sections are randomly assigned to a control or treatment
group. Survey data from the questionnaire, survey and quizzes are collected by the investigator. The investigator is
the primary coder and is responsible for assessing coding consistencies, scale reliability, anomalies and for
identifying outliers. Therefore, this study will have some practical applications and may also add to information
systems theory [1].
Dr.Fahad N. Al-FAHAD (2009) has research study was to better understand and measure the students‟ attitudes
and perceptions towards the effectiveness of mobile learning. The results of a survey of 186 undergraduate female
students of Bachelor of Arts and Medicine (BA & MD) at Kind Saud University about their attitude and perceptions
to the use of mobile technology in education. An analysis of the quantitative survey findings was presented focusing
on the ramification for mobile learning practices in university learning and teaching environments. The survey was
conducted in three groups in age range of 18-26 years. The questionnaire was developed in Arabic language. The
author has attempted to determine that the technology can be optimally used to improve student retention at
Bachelor of Art and Medicine programmed at King Saud University in Saudi Arabia. Result of this survey clearly
indicate that offering mobile learning could be a method for improving retention of Arts and Medicine students, by
enhancing their teaching and learning. The advantage of this technology is that it can be used anywhere, anytime
and adopt their mobile learning systems with the aim of improving communication and enriching students‟ learning
experiences in their open and distance learning [2].
Devinder Singh &Zaitun A.B. (2006) describes the educational opportunities of teaching in a real time wireless
1446 |
P a g e
survey from two hundred undergraduate students on the problems faced in conventional classrooms. From thesurvey results, specific mobile learning applications are being developed for students and instructors. These
applications could be used on a Pocket PC, notebook and mobile phone. The author provides a variety of
instructional application such as classroom chat room, collaborative text editor, synchronization of power point
slides, accessing to remote computing resources. The system allows the instructor to give on line assessments in
class, which are graded instantly. Learning objects are proposed to keep track of learning activity effectively.
Learning objects using ASP.NET together with XML. The questionnaires were distributed to find the weaknesses
of conventional learning and the type of mobile learning applications that they would like to use in a classroom
using a mobile device. This research provides an effective method of learning through the use of mobile learning in
a wireless classroom. Lectures could monitor students‟ progress during classroom exercises. Students would be able
to interact better with their lecturer during class [3].
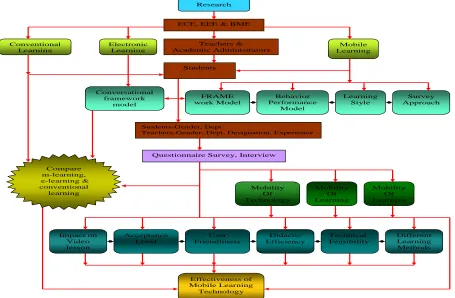
III. METHODOLOGY
The main research study survey was conducted with 80engineering teachers of ECE, EEE and BME in affiliated and
deemed universities. The educational video lessons for Electrocardigraphy (ECG) were used in the survey and it
took 10 minutes. ECG is be used to measure the electrical activity produced by the person‟s heart.
Mobility Of Technology
Mobility Of Learning
Technical Feasibility
Mobility Of Learners
Didactic Efficiency Acceptance
Level
User Friendliness Impact on
Video lesson
Research
Conventional Learning
Electronic Learning
Mobile Learning ECE, EEE & BME
Teachers & Academic Administrators
FRAME work Model
Behavior Performance
Model
Learning Style
Survey Approach Conversational
framework model
Students-Gender, Dept
Teachers-Gender, Dept, Designation, Experience
Questionnaire Survey, Interview
Effectiveness of Mobile Learning Technology Students
Compare m-learning, e-learning & conventional
learning
Different Learning Methods
1447 |
P a g e
This video lesson explains about the practical demonstration of the measurement of ECG with block diagram,practical demonstration and animation diagrams for heart functioning. The video lesson can be transferred to the
teachers via Bluetooth technology and can be followed during their leisure hours. A questionnaire was developed
and designed with 40 parameters to measure the effectiveness of mobile learning. A 5-point Likert scale with
strongly agree, agree, undecided, disagree and strongly disagree was used from the main items. The study was
conducted from engineering teachers from both genders. The questionnaire includes a covering letter and personal
information sheet, distributed to participants during their free hours.
The main objectives are
1.Effectiveness of video lessons using mobile learning
2.Is mobile learning is effective than other learning methods
3.Is the acceptance of mobile learning in the education system
The first objective is that the teachers effectiveness of mobile learning was measured using 40 parameters, from this
six parameters were used for different learning methods in education system and seven parameters were identified
impact on video lesson in the field of education, and seven parameters identify the acceptance level of mobile
learning and remaining parameters are indicate the mobile learning as user-friendly, didactic efficiency and technical
feasibility of the mobile learning system.
IV RESULT AND DISCUSSION
The main motto of the analysis is to categorize, classify and summarize the collected data, which can be realized and
interpreted to accomplish research objectives. The profiles of the teachers are presented in the annexure. The
analysis of effectiveness of mobile learning technology survey parameters can be divided into the interaction
experience in the mobile environment, the usage of video lesson in higher education and combination of learning
methods in higher education, based on this important parameters can be classified into six categories
[A.H,Muhamad Amin, A.K.Mahmud, A.I.Zainal Abidin and M.A.Rahman, 2006]. They are Impact on Video lesson,
Acceptance Level, User-Friendliness, Didactic Efficiency, Technical Feasibility and Different Learning Methods.
Reliability of effectiveness of mobile learning derived andidentifying, to form Communalities by extraction method
under Principal Component Analysis (PCA) that all parameters were analyzed with students; The data reduction can
be done with the extraction method under principal component analysis and the results were collected from each
parameter and analyzed. Another statistical analysis instrument is reliability coefficient. Cronhach‟s alpha
(Cronbach.1951) to estimate the scale of consistency among items in the group (Hair, Anderson, Tatham& Black,
1998). The Cronbach‟s alpha is generally acceded upon the level of 0.70, albeit it is acceptable at 0.60 in exploratory
research (Hair et al., 1998). In the cluster validation via Exploratory factor analysis (EFA) was performed, Principal
Component Analysis (PCA) with Varimax Rotation (Kaiser Normalization) was employed. To ensure that factor
loadings were accounting for at least 10% of the variance in the overall model, the criteria of Eigen values greater
than > 1 and factor loadings of [.3] and greater were employed. The Hypotheses can be derived Non-Parametric test
1448 |
P a g e
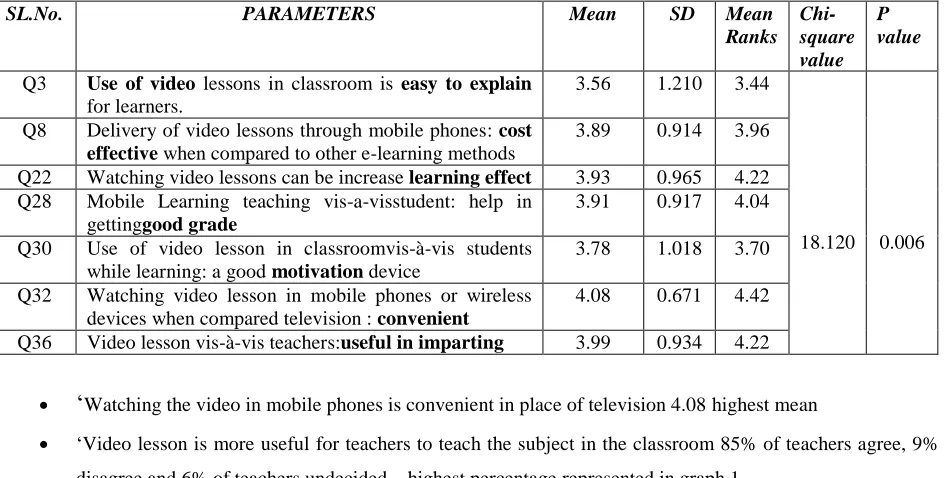
4.1 Impact analysis of video lessons
Table 1 Impact of video lessons
SL.No. PARAMETERS Mean SD Mean
Ranks Chi-square value
P value
Q3 Use of video lessons in classroom is easy to explain for learners.
3.56 1.210 3.44
18.120 0.006 Q8 Delivery of video lessons through mobile phones: cost
effective when compared to other e-learning methods
3.89 0.914 3.96
Q22 Watching video lessons can be increase learning effect 3.93 0.965 4.22 Q28 Mobile Learning teaching vis-a-visstudent: help in
gettinggood grade
3.91 0.917 4.04
Q30 Use of video lesson in classroomvis-à-vis students while learning: a good motivation device
3.78 1.018 3.70
Q32 Watching video lesson in mobile phones or wireless devices when compared television : convenient
4.08 0.671 4.42
Q36 Video lesson vis-à-vis teachers:useful in imparting 3.99 0.934 4.22
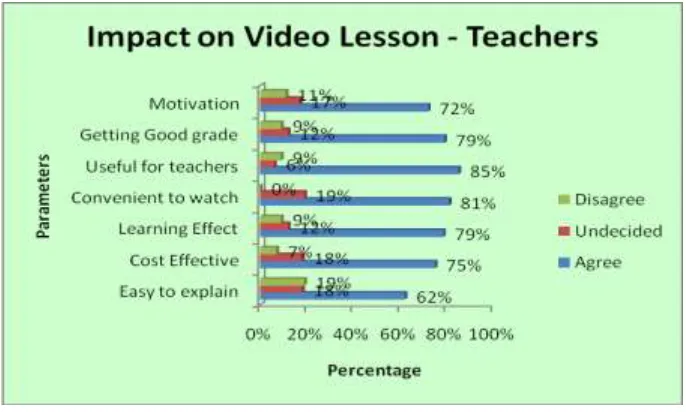
„
Watching the video in mobile phones is convenient in place of television 4.08 highest mean „Video lesson is more useful for teachers to teach the subject in the classroom 85% of teachers agree, 9%
disagree and 6% of teachers undecided – highest percentage represented in graph 1
Use of video lesson in classroom is easy to explain for students mean is 3.56 least mean and 62% of
teachers agree, 18% undecided and 19% of teachers disagreeit has agree least percentage of teachers.
Null – Hypothesis is rejected – Hence it is concluded that there is a significant difference between mean
ranks of parameters P value is less than 0.01 at 1% significance
Group of Parameters/Indicators
Impact analysis of
video lesson using MLT
Measurement on
Acceptance Level of MLT
Analysis of User -friendliness
(MLT)
Analysis of Didactic Efficiency
(MLT)
Analysis of Technical Feasibility (MLT)
Analysis of Different Learning
and Teaching
methods
Effectiveness of Mobile Learning Technology (MLT)
1449 |
P a g e
Graph 1 Percentage of each parameters under impact analysis on video lesson
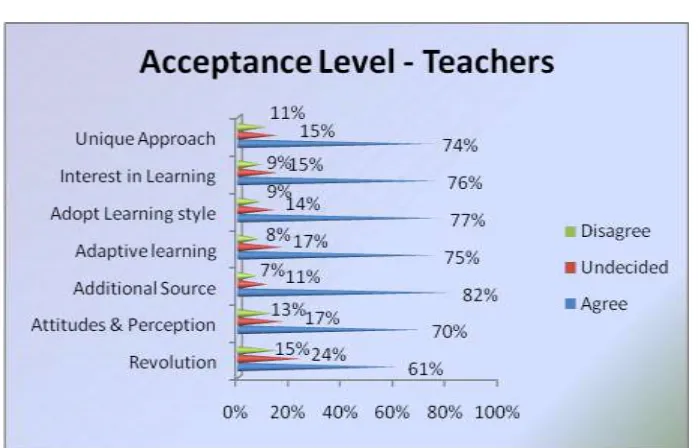
4.2 Measurement on Acceptance level
Table 2 Acceptance level
SL.No. PARAMETERS Mean SD Mean
Ranks Chi-Square Value
P value
Q12 Mobile Learning Technology is a revolution in e-learning to effectively build and deliver the content
3.58 1.077 3.41
17.139 0.009 Q14 Mobile Learning Technology in education system
is more effective to measure the students‟ attitudes and perception
3.75 1.049 3.91
Q15 Mobile Learning Technology is the additional
orsupplemental source of learning. 3.99 0.907 4.10 Q23 Mobile Learning technology to provide adaptive
learning environment 3.88 0.946 4.01
Q26 Mobile Learning technology can help the student
to adopt their learning style 3.99 1.013 4.49 Q27 Mobile phones or wireless devices help in
increasing the students interest in learning 3.89 0.968 4.16 Q29 Mobile Learning Technology has become a
unique approach in providing content delivery. 3.84 1.084 3.94
„Mobile learning technology is the alternate or supplemental source of learning and mobile learning can
help the student to adopt their learning style‟ – highest mean is 3.99 and 82% of teachers agree, 11%
undecided and 7% disagree – highest percentage parameter represented in graph 2.
„Mobile learning is a revolution in e-learning to effectively build and deliver the content mean is 3.58 and
1450 |
P a g e
Null – Hypothesis is rejected – Hence it is concluded that there is a significant difference between meanranks of parameters P value is less than 0.01 at 1% significance
Graph 2 Percentage of parameters under measurement on Acceptance Level
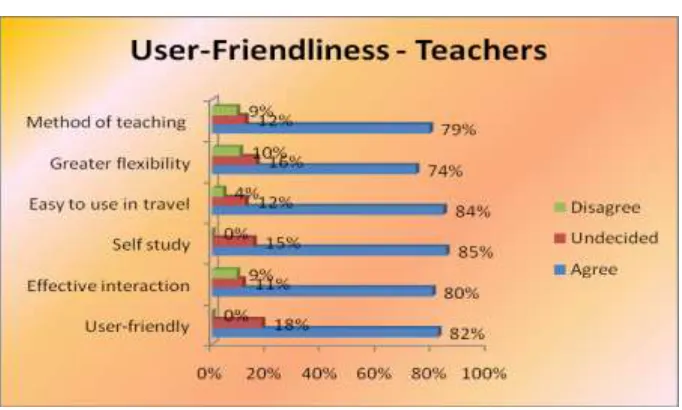
4.3 Analysis of User Friendliness
Table 3 User Friendliness
SL.No. PARAMETERS Mean SD Mean
Ranks Chi-square value
P value
Q5 Mobile Learning Technology is User-friendly 4.20 0.719 3.89
27.365 0.000 Q9 Effective interaction with students in the mobile
Learning Technology 3.95 1.005
3.37
Q11 Mobile Learning Technology can be used for self
study or individualized learning 4.21 0.688
3.85
Q25 Mobile Learning Technology is easy to usewhile
travelling by bus/car/van/train 4.19 0.797
3.80
Q34 Mobile Learning Technology is the greater flexibility
in where and when learning needs. 3.81 0.969
3.06
Q38 Mobile learning technology as one method of
teaching and learning. 3.83 0.897
3.03
„Mobile learning can be used for self study or individualized learning‟ - Highest mean value is 4.21 and
also agree for 85% of teachers, 15% undecided – highest percentage parameter represented in graph 3.
„Mobile learning technology is the greater flexibility in where and when learning needs‟least mean value is
1451 |
P a g e
Null – Hypothesis is rejected – Hence it is concluded that there is a significant difference between meanranks of parameters P value is less than 0.01 at 1% significance
Graph 3 Percentage of parameters under User-Friendliness
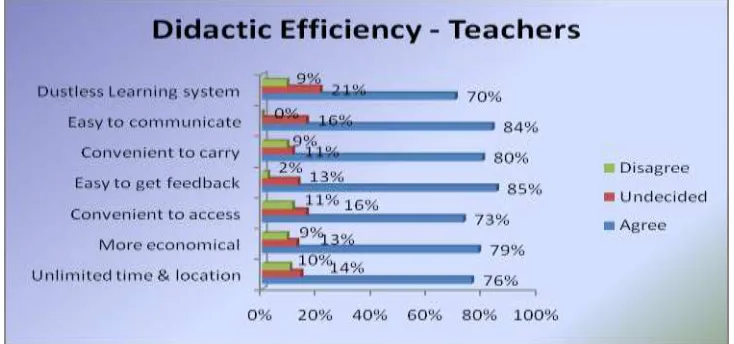
4.4 Analysis of Didactic Efficiency
Table 4 Didactic Efficiency
SL.No. PARAMETERS Mean SD Mean
Ranks Chi-Square
P value
Q13 Mobile Learning Technology represents user‟s continuous access to network resources without limitation of timeand location.
3.91 1.081
4.02
17.872 0.007 Q20 Mobile learning technology is more economical
in terms of design and delivery of content. 3.93 0.965
4.06
Q21 Mobile Learning Technology is convenient to access information anywhere, at any time, any network, any data on any wireless device.
3.84 1.061
3.73
Q24 Mobile phones or wireless devices are simple and
easy to get feedback from learners and teachers 4.14 0.725
4.48
Q33 Users convenient to carry their data with them to
almost all the places. 3.85 0.901
3.73
Q35 Mobile phones or a wireless device is easy to
communicate with students and other teachers. 4.16 0.683
4.40
Q40 Mobile Learning Technology is used to support the end of the dustless learning system
3.76 0.945 3.59
„Mobile phones or a wireless device is easy to communicate with students and other teachers‟ - highest
value of mean is 4.16
„Mobile learning is used to support the end of the dustless learning system„Least mean value is 3.76 „Mobile phones or wireless devices are simple and easyto get feedback from learners and teachers‟, Highest
1452 |
P a g e
„Mobile Learning Technology is used to support the end of the dustless learning system‟ – Lowestpercentage - 70% of teachers agree, 9% disagree and 21% undecided.
Null – Hypothesis is rejected – Hence it is concluded that there is a significant difference between mean
ranks of parameters P value is less than 0.01 at 1% significance
Graph 4 Percentage of parameters under Didactic Efficiency
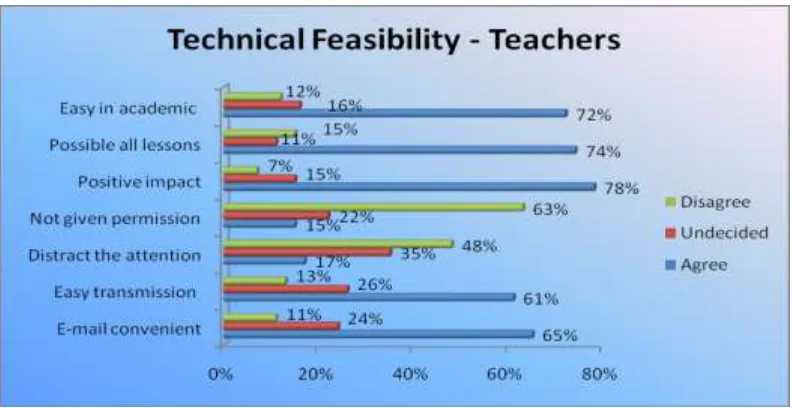
4.5 Analysis of Technical Feasibility
Table 5 Technical Feasibility
SL.No. PARAMETERS Mean SD Mean
Ranks Chi-Square value
P value
Q6 Sending assignments through e-mail isconvenient
when compared to conventional system. 3.65 0.995 3.87
17.886 0.007 Q7 Transmitting videos in mobile phones is easy
than television, web etc 3.68 1.041
3.90
Q16 Usage of mobile phones in classroom will distract
the students‟ attention 3.46 1.147
3.49
Q17 Administrators / Management will notgive
permission to use mobile phones in classroom 3.56 1.123
3.74
Q18 Positive impact on the technology enabled
learning system. 4.00 0.955
4.56
Q37 Mobile Learning is possible for all the lessons 3.80 1.195 4.26 Q39 Use of mobile phones or wireless devices is easy
in academic environment 3.79 1.087
4.19
„Positive impact on the technology enabled learning system‟ highest mean is 4.00 and 78% of
teachers agree, 15% undecided and 7% disagree – highest parameter represented in graph 5
„Usage of mobile phones in classroom will distract the students attention‟ is the least mean value
is 3.46 and 48% of teachers disagree, 35% undecided and only 17% of teachers agree.
Null – Hypothesis is rejected – Hence it is concluded that there is a significant difference between
1453 |
P a g e
Graph 5 Percentage of parameters under Analysis of Technical Feasibility
4.6 Analysis of Different Learning Methods
Table 6 Analysis of Different Learning Methods
SL.No. PARAMETERS Mean SD Mean
Ranks Chi-square value
P value
Q1 No Technology can replace the teacher 4.18 0.742 4.29
88.794 0.000 Q2 Teacher would prefer to use blackboard is
effective than other methods of learning
3.11 1.232 2.31
Q4 Learning through web is interesting than other learning methods
3.54 1.006 3.06
Q10 Learning with teacher centered and e-learning
3.80 1.024 3.43
Q19 Learning through teacher centered with technology enabled learning i.e. e-learning and m-learning is suitable for students
3.75 1.119 3.61
Q31 Community radio can also be used for learning the subject
4.21 0.774 4.29
Learning through teacher centered with technology enabled learning i.e. e-learning and m-learning is
suitable for students the highest value of mean is 4.21 and 84% of teachers are agree, 14% undecided and
remaining 2% disagree- highest percentage of parameter represented in graph 6
Least mean value 3.11 of parameter is „teacher would prefer to use blackboard is effective than other methods of learning‟ and 40% of teachers agree and 33% disagree and 24% undecided
Null – Hypothesis is rejected – Hence it is concluded that there is a significant difference between mean
1454 |
P a g e
Graph 6 Percentage of parameters under Analysis of Different learning methods
Graph 7 Responses of impact on video lessons Graph 8 Responses on Acceptance level
The overall response on the impact analysis of video lessons using mobile learning technology, 24% of overall teachers strongly agree and 52% of teachers agree and 15% of teachers undecided, 5% and 4% of teachers disagree and strongly disagree.
1455 |
P a g e
Graph 9 Responses on User Friendliness Graph 10 Responses on the Didactic Efficiency
Graph 11 Responses on Technical Feasibility Graph 12 Responses on Different Learning Methods
The overall responses on the user-friendliness ofmobile learning technology, 29% of overall teachers strongly agree and 51% of teachers agree and 14% of teachers undecided and 3% and 3% of teachers disagree and strongly disagree.
The overall responses on the analysis of Didactic Efficiency on mobile learning technology, 27% of overall teachers strongly agree and 51% of teachers agree and 15% of teachers undecided and 4% and 3% of teachers disagree and strongly disagree.
The overall responses of the analysis of Technical Feasibility on mobile learning technology, overall 10% of teachers strongly agree and 35% of teachers agree and 21% of teachers undecided and 15% and 9% of students disagree and strongly disagree.
1456 |
P a g e
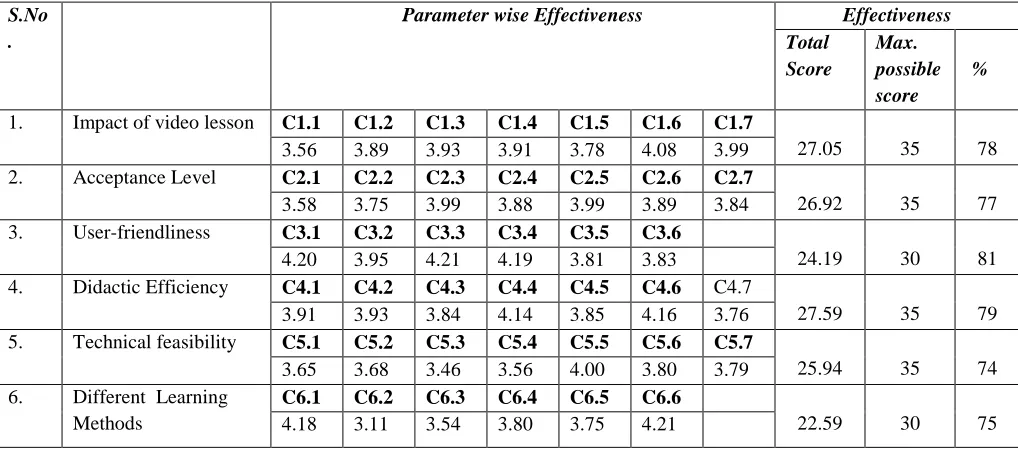
The mean of the scores assigned by all the teachers for each parameter gives parameter wise effectiveness score. Thetotal score for effectiveness of each category was computed by adding the scores of all the parameters in the
particular category. The percentage of effectiveness of each category was calculated by using the following formula:
Total Score assigned
Percentage of Effectiveness = --- X 100 Maximum possible score
Where,
1) The maximum possible score = (Number of parameters under each category) X (Maximum mean score that can be obtained for a parameter)
2) Maximum mean score that can be obtained for a parameter is 5.
Table 7 Data on the Effectiveness of Mobile Learning Technology as assessed by Teachers.
S.No .
Parameter wise Effectiveness Effectiveness
Total Score
Max. possible score
%
1. Impact of video lesson C1.1 C1.2 C1.3 C1.4 C1.5 C1.6 C1.7
27.05 35 78
3.56 3.89 3.93 3.91 3.78 4.08 3.99 2. Acceptance Level C2.1 C2.2 C2.3 C2.4 C2.5 C2.6 C2.7
26.92 35 77
3.58 3.75 3.99 3.88 3.99 3.89 3.84 3. User-friendliness C3.1 C3.2 C3.3 C3.4 C3.5 C3.6
24.19 30 81
4.20 3.95 4.21 4.19 3.81 3.83
4. Didactic Efficiency C4.1 C4.2 C4.3 C4.4 C4.5 C4.6 C4.7
27.59 35 79
3.91 3.93 3.84 4.14 3.85 4.16 3.76 5. Technical feasibility C5.1 C5.2 C5.3 C5.4 C5.5 C5.6 C5.7
25.94 35 74
3.65 3.68 3.46 3.56 4.00 3.80 3.79 6. Different Learning
Methods
C6.1 C6.2 C6.3 C6.4 C6.5 C6.6
22.59 30 75
4.18 3.11 3.54 3.80 3.75 4.21
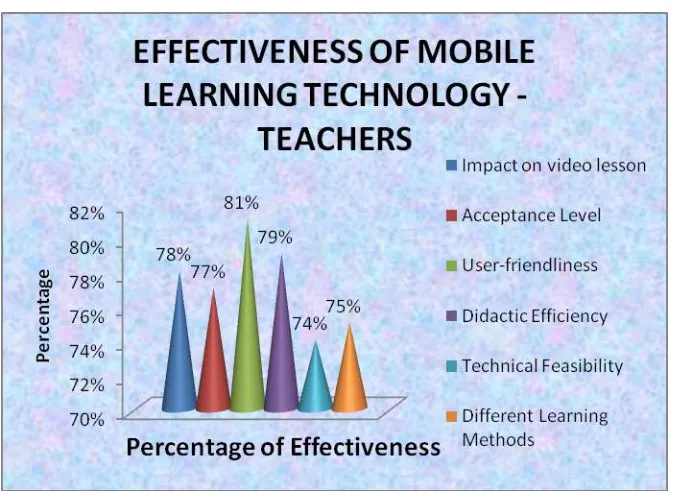
The graph 13 indicates the percentage of effectiveness of the six categories of mobile learning technology as
assessed by the teachers ranges from 74% to 81% and based on the assessments of teachers, it can be concluded that
User-Friendliness (81%) is the most effective learning category, followed by Didactic Efficiency (79%), Impact
on video lesson (78%) and - Acceptance Level (77%), Different Learning Methods (75%) and Technical Feasibility
( 74%).of mobile learning technology.
4.7 Reliability Analysis
The results are presented in table 8 Although it was anticipated a priori that the 40 parameters would load onto the 6
variables identified, The parameters that loaded onto and determined and represented by: 1) Impact on Video Lesson
1457 |
P a g e
Methods. The results of this study can be explained in Table 8gives the results of extracted communalities of all thevariables. It shows the proportion of the variance of a variable explained by the common factors.
Graph 13 Effectiveness of Mobile Learning Technology as assessed by teachers.
Table 8 Communalities (Extraction Method: Principal Component Analysis ), Rotated Component
Matrix and Cronbach’s Alpha of Mobile Learning
Communalities Principal Component
Analysis
Rotated Component Matrix and Cronbach’s Alpha of Mobile Learning Technology
Initial Extraction Component
1 2 3
Impact on video lesson 0.781
Q30 1.000 0.886 Motivation 0.941
Q28 1.000 0.794 Good grade 0.891
Q36 1.000 0.763 Useful for teachers 0.870 Q32 1.000 0.662 Convenient to watch 0.809
Q22 1.000 0.429 Learning Effect 0.595
Q3 1.000 0.693 Easy to explain 0.827
Q8 1.000 0.636 Cost effective 0.775
Cronbach‟s Alpha 0.884 0.486 Acceptance Level 0.780
Q29 1.000 0.627 Unique Approach 0.792
Q14 0.613 Attitude & Perception 0.767 Q23 1.000 0.547 Adaptive learning 0.738
Q12 1.000 0.667 Revolution 0.704
Q26 1.000 0.535 Adopt their Learning style 0.682
Q15 1.000 0.749 Alternate source of learning 0.860
Q2 1.000 0.693 Interest in learning 0.828
1458 |
P a g e
User-friendliness 0.776Q11 1.000 0.726 Self study 0.785
Q9 1.000 0.498 Effective interaction 0.705 Q34 1.000 0.412 Greater flexibility 0.632
Q25 1.000 0.679 Easy to use in travel 0.630 0.531
Q38 1.000 0.864 Teaching & Learning 0.928
Q5 1.000 0.842 User-friendly 0.819
Cronbach‟s Alpha 0.710 0.780 Didactic Efficiency 0.732
Q28 1.000 0.715 Unlimited time & location 0.845 Q21 1.000 0.690 Convenient to access 0.830
Q13 1.000 0.581 More economical 0.755
Q17 1.000 0.580 Easy to get feedback 0.755 Q40 1.000 0.463 Dustless classroom 0.610
Q39 1.000 0.688 Convenient to carry 0.812
Q35 1.000 0.754 Easy to communicate 0.862
Cronbach‟s Alpha 0.821 0.622 Technical Feasibility 0.720
Q7 1.000 0.854 Easy Transmission 0.850 Q16 1.000 0.733 Distract students attention 0.848 Q39 1.000 0.505 Easy in academic 0.700
Q17 1.000 0.690 Not give permission 0.564 0.568
Q37 1.000 0.789 Possible for all the lessons 0.874
Q18 1.000 0.799 Positive impact 0.716
Q6 1.000 0.784 E-mail is convenient 0.851
Cronbach‟s Alpha 0.770 0.571 0.406 Different Learning Methods 0.800
Q16 1.000 0.877 Blackboard 0.908
Q26 1.000 0.794 Community Radio 0.843
Q6 1.000 0.692 Replace teacher 0.820
Q15 1.000 0.683 Web is interest 0.704
Q14 1.000 0.480 Teacher & e-learning 0.644
Q25 1.000 0.774 Teacher centered with e- & m-learning
0.880
Cronbach‟s Alpha 0.868 0.473
From table 8 under impact on video lesson,
“ Watching the video lesson can be increased the learning effect” has the least percentage (43.0%)
of variance
“Usage of video lesson in classroom motivates the students to learn” has the highest variation
(88.6%)
Factor analysis loaded seven questionnaire statements into two components. The internal
consistency, represented by coefficient alpha, of all items is as much as 0.781.
The first component alpha value is 0.884 has high internal consistency of component. The alpha
value of the second factor is 0.486 it has poor consistency with other parameters.
From table 8 under acceptance level,
“Mobile learning can help the student to adopt their learning style” has the least percentage
1459 |
P a g e
“Mobile learning is the additional or supplemental source of learning” has the highest variation(74.9%)
Cronbach‟s alpha from reliability analysis of the data. Factor analysis loaded seven questionnaire
statements into two components. The internal consistency, represented by coefficient alpha, of all
items is as much as 0.780.
The first component represents the most contributory element to mobile learning. Alpha value of
this factor is 0.809 representing a high internal consistency of this component. The alpha value of
the second factor is 0.682 consistency of the component.
From Table 8 under user-friendliness,
“mobile learning is the greater flexibility where and when explanation needs” has the least
percentage (41.2%) of variance
“Mobile learning as one method of teaching & learning“ has the highest variation (86.4%) Cronbach‟s alpha from reliability analysis of the data, factor analysis loaded six questionnaire
statements into two components. The internal consistency, represented by coefficient alpha, of all
items is as much as 0.776.
The alpha value of the first factor is 0.710 is also high consistency of the component.
The second component represents the most contributory element to mobile learning. Alpha value
of this factor is 0.780 representing a high consistency of this component.
From Table 8 under didactic efficiency,
“mobile learning is used to support the end of the dustless classroom learning system” has the
least percentage (46.3%) of variance
„Mobile phones or wireless devices are simple and easy to communicate with teachers and students‟ has the highest variation (75.4%)
Cronbach‟s alpha from reliability analysis of the data, factor analysis loaded seven
questionnaire statements into two components. The internal consistency, represented by
coefficient alpha, of all items is as much as 0.732.
The first component represents the most contributory element to mobile learning. Alpha value
of this factor is 0.821 representing a high internal consistency of this component. T
The alpha value of the second factor is 0.622 is consistency of the component.
From Table 8 under technical feasibility,
“Use of mobile phone is easy in academic environment” has the least percentage (50.5%) of
variance
1460 |
P a g e
Cronbach‟s alpha from reliability analysis of the data, factor analysis loaded seven questionnairestatements into three components. The internal consistency, represented by coefficient alpha, of
all items is as much as 0.720.
The first factor has high consistency alpha value is 0.770,
The second component alpha factor is 0.571 and third component alpha value is 0.406 is quite low
owing the component only items are extracted.
From Table 8 under different learning methods,
“Learning with teacher and e-learning” has the least percentage (48%) of variance
„Teacher would prefer to use blackboard is effective than other methods of learning” has the
highest variation (87.7%)
Cronbach‟s alpha from reliability analysis of the data,factor analysis loaded six questionnaire
statements into two components. The internal consistency, represented by coefficient alpha, of all
items is as much as 0.800.
The first component represents the most contributory element to mobile learning. Alpha value of
this factor is 0.868 representing a high internal consistency of this component.
The alpha value of the second factor is 0.473 which is low owing to the very limited number of
items (2 items).
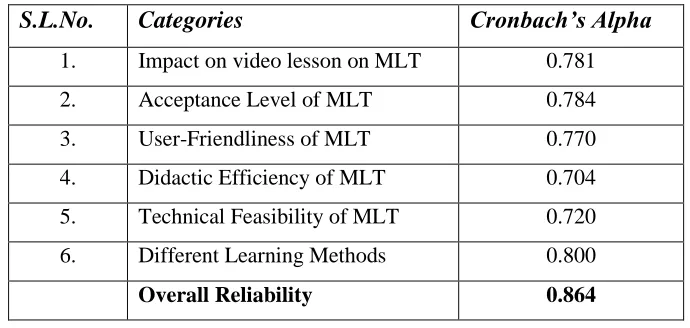
The overall reliability of parameter factor of Cronbach‟s Alpha value is 0.864 it has high internal consistency.
Table 9 Cronbach’s Alpha of Mobile Learning
S.L.No.
Categories
Cronbach’s Alpha
1.
Impact on video lesson on MLT
0.781
2.
Acceptance Level of MLT
0.784
3.
User-Friendliness of MLT
0.770
4.
Didactic Efficiency of MLT
0.704
5.
Technical Feasibility of MLT
0.720
6.
Different Learning Methods
0.800
Overall Reliability
0.864
Correlation Analysis
Correlation analysis of teachers‟ assessments on effectiveness of six categories of Mobile Learning
1461 |
P a g e
Table 10 Correlation Analysis on the Effectiveness of Mobile Learning Technology as
assessed by the Teachers
Type of Category Category 1
Impact on video lesson
Category 2 Acceptance
Level
Category 3 User Friendliness
Category 4 Didactic Efficiency
Category 5 Technical Feasibility
Category 6 Different Teaching Methods Category 1
Impact on video lesson
1.000 0.287** 0.404** 0.402** 0.326** 0.186
Category 2 Acceptance
Level
0 1.000 0.273* 0.402** 0.139 0.035
Category 3 User Friendliness
0 0 1.000 0.246* 0.131 0.075
Category 4 Didactic Efficiency
0 0 0 1.000 0.122 0.266
Category 5 Technical Feasibility
0 0 0 0 1.000 0.306**
Category 6 Different Learning Methods
0 0 0 0 0 1.000
Note: ** Correlation is significant at the 0.01 level (2-tailed) * Correlation is significant at the 0.05 level (2-tailed)
The strength of a relationship between two groups is indicated by the absolute value of the correlation coefficient.
The correlation coefficient between Category 1 and Category 3 has a high absolute value of 0.404. Therefore, the
relationship between Category 1 (Impact on Video Lesson) and Category 3 (User- friendliness) is stronger
than the relationship between other groups. The correlation between Category 3 and Category 4 has a low
absolute value of 0.246. Therefore, the relationship between Category 3 (User-friendliness) and Category 4
(Didactic Efficiency) is weaker than the relationship between other groups of mobile learning technology. The
category 5 has uncorrelated with category 2 to category 4 and the category 6 has uncorrelated with category 1
to category 4,
V. CONCLUSION
This paper presented after conducting main research study and survey from 80 engineering teachers of ECE, EEE
and BME on the effectiveness of mobile learning. From the above results it is concluded that the most effective
parameter is mobile learning which is alternate or supplemental source of learning for students, adopt their students
learning style mobile learning is convenient for self-study or individualized learning. Mobile phones or wireless
devices are easy to use while travelling by bus/car/van/train and easy to communicate with other teachers and
1462 |
P a g e
understand the concept of the subject. For future research, to develop the mobile learning management system andevaluate the system with students using the video lesson implemented into the wireless devices.
REFERENCES
[1] Devinder Singh & Zaitun A.B.,”Mobile Learning In Wireless Classrooms”, Malaysian Online Journal of
Instructional Technology (MOJIT), August 2006, ISSN: 1823-1144Vol.3, No.2, Pages 26-42.
[2] Paul Williams and Mary J. Granger, “Effectiveness and Acceptance of Mobile Learning”, Proceedings of the
AIS SIG-ED IAIM 2008 conference.
[3] Dr.Fahad N. Al-FAHAD, ”Students‟ Attitudes and Perceptions towards the Effectiveness of Mobile learning in
King Saud University”, The Turkish Online Journal of Educational Technology – TOJET April 2009 ISSN:
1303-6521 volume 8 Issue 2 Article 10.
[4] Mohamed Osman M.El-Hussein and Johannes C.Cronje, “Defining Mobile Learning in the Higher education
Landscape”, Journal of Educational Technology and Society, 13(3),12-21.
[5] Cronbach, I.J (1951), Coefficienct alpha and the internal structure of test. Psychometrical, 16,297-334
[6] Hair., I.F. Anderson, R.E. Tatham, R.L. & Black, W.C., (1998). Multivariate Data Analysis. 5th ed. Upper
Saddle River, New Jersey: Prentice-Hall
[7] Luvai F. Motiwalla, “Mobile learning: A framework and Evaluation”, Computer & Education 49 (2007) 581-596
available online at www.sciencedirect.com
[8] John Traxler, „Defining Mobile Learning‟, International Conference Mobile Learning (IADIS) 2005
[9] Edward J. Cherian and Paul Williams, “Mobile Learning: The Beginning of the End of Classroom Learning”,
Proceedings of the World Congress on Engineering and Computer Science 2008, WCECS 2008, October
22-24, 2008, San Francisco, USA
[10] Maniar,N. E.Bennett, S. Hand and G.Allan (2008) “ The effect of mobile phone screen size on video based
learning” Journal of software, Vol 3(4) April 2008 p51-61
Table 9 Teachers Descriptive frequency Statistics
ANNEXURE - IParameters SA
%
A %
Un %
D %
SD %
Mean SD
Q1 No Technology can replace the teacher
30 (38%)
34 (42%)
16
(20%) 0 0 4.18 0.742
Q2
Teacher would prefer to use blackboard is effective than other methods of learning
11 (14%)
23 (29%)
19 (24%)
18 (22%)
9
(11%) 3.11 1.232
Q3
Usage of video lesson in classroom is easy to explain for students
18 (22%)
32 (40%)
14 (18%)
9 (11%)
7
1463 |
P a g e
Q4Learning through web is interesting than other learning methods
14 (17%) 28 (35%) 28 (35%) 7 (9%) 3
(4%) 3.54 1.006 Q5 Mobile Learning Technology is
User-friendly 30 (37%) 36 (45%) 14 (18%)
0 0 4.20 0.719
Q6
Sending assignments through e-mail isconvenient when compared to conventional system. 13 (16%) 39 (49%) 19 (24%) 5 (6%) 4
(5%) 3.65 0.995
Q7
Transmitting videos in mobile phones is easy than television
18 (22%) 31 (39%) 21 (26%) 7 (9%) 3
(4%) 3.68 1.041
Q8
Delivery of video lessons through mobile phones is cost effective when compared to other e-learning methods like web or television
19 (24%) 41 (51%) 14 (18%) 4 (5%) 2
(3%) 3.89 0.914
Q9
Effective interaction with students in the mobile Learning Technology
23 (29%) 41 (51%) 9 (11%) 3 (4%) 4
(5%) 3.95 1.005
Q10
Learning with teacher and e-learning 21 (26%) 33 (41%) 18 (23%) 5 (6%) 3
(4%) 3.80 1.024
Q11
Mobile Learning Technology can be used for self study or individualized learning 29 (36%) 39 (49%) 12
(15%) 0 0 4.21 0.688
Q12
Mobile Learning Technology is a revolution in e-learning to effectively build and deliver the content
14 (17%) 35 (44%) 19 (24%) 7 (9%) 5
(6%) 3.58 1.077
Q13
Mobile Learning Technology represents user‟s continuous access to network resources without limitation of timeand location. 25 (31%) 36 (45%) 11 (14%) 3 (4%) 5
(6%) 3.91 1.081
Q14
Mobile Learning Technology in education system is more effective to measure the students‟ attitudes and perception 18 (22%) 38 (48%) 14 (17%) 6 (8%) 4 (5%)
3.75 1.049
Q15
Mobile Learning Technology is the additional orsupplemental source of learning. 22 (28%) 43 (54%) 9 11%) 4 (5%) 2
(2%) 3.99 0.907
Q16 Usage of mobile phones in classroom will distract the students‟ attention
5 (6%) 9 (11%) 28 (35%) 20 (25%) 18
(23%) 3.46 1.147
Q17
Administrators/ Management will not give permission to use mobile phones in classroom 7 (9%) 5 (6%) 18 (23%) 36 (45%) 14
(17%) 3.56 1.123
Q18
Positive impact on the technology enabled learning system.
26 (33%) 36 (45%) 12 (15%) 4 (5%) 2
(2%) 4.00 0.955
Q19
Community radio can also be used for learning the subject
21 (26%) 35 (44%) 11 (14%) 9 (11%) 4
(5%) 3.75 1.119
Q20
Mobile learning technology is more economical in terms of design and delivery of content.
21 (26%) 42 (52%) 10 (13%) 4 (5%) 3 (4%)
3.93 0.965
Q21
Mobile Learning Technology is convenient to access information anywhere, at any time , any network, any data on any wireless device
22 (28%) 36 (45%) 13 (16%) 5 (6%) 4
(5%) 3.84 1.061
1464 |
P a g e
Q22 increased the learning effect (26%) (52%) (13%) (5%) (4%) 3.93 0.965Q23
Mobile Learning Technology to provide adaptive learning environment
19 (24%) 41 (51%) 14 (17%) 3 (4%) 3
(4%) 3.88 0.946
Q24
Mobile phones or wireless devices are simple and easy to get feedback from learners and teachers
25 (31%) 43 (54%) 10 (13%) 2
(2%) 0 4.14 0.725
Q25
Mobile Learning Technology is easy to use at the time of travelling by bus/car/van/train 31 (39%) 36 (45%) 10 (12%) 3
(4%) 0 4.19 0.797
Q26
Mobile Learning technology can help the student to adopt their learning style
27 (34%) 35 (44%) 11 (14%) 4 (5%) 3
(4%) 3.99 1.013
Q27
Mobile phones or wireless devices help in increasing the students interest in learning 20 (25%) 41 (51%) 12 (15%) 4 (5%) 3
(4%) 3.89 0.968
Q28
Mobile Learning Technology will help the student for getting good grade
19 (24%) 44 (55%) 10 (13%) 5 (6%) 2
(3%) 3.91 0.917
Q29
Mobile Learning Technology has become a unique approach in providing content delivery
22 (28%) 37 (46%) 12 (15%) 4 (5% 5
(6%) 3.84 1.084
Q30
Usage of video in classroom motivates the students to learn.
17 (21%) 41 (51%) 13 (16%) 5 (6%) 4
(5%) 3.78 1.018
Q31
Combination of teacher centered with technology enabled learning i.e. e-learning and m-e-learning is more suitable for students
32 (40%) 35 (44%) 11 (14%) 2
(2%) 0 4.21 0.774
Q32
Watching video lessons in mobile phones is convenient when compared to television 21 (26%) 44 (55%) 15
(19%) 0 0 4.08 0.671
Q33 User‟s convenient to carry their data with them to almost all the places
14 (18%) 50 (62%) 9 (11%) 4 (5%) 3
(4%) 3.85 0.901
Q34
Mobile Learning technology is the greater flexibility where and when explanation needs 17 (21%) 42 (53%) 13 (16%) 5 (6%) 3
(4%) 3.81 0.969
Q35
Mobile phones or a wireless device is easy to communicate with students and other teachers. 26 (32%) 41 (51%) 13 (16%)
0 0
4.16 0.683
Q36
Video lesson is useful for the teachers to teach the subject
21 (26%) 47 (59%) 5 (6%) 4 (5%) 3
(4%) 3.99 0.934
Q37
Mobile Learning is possible for all the lessons 24 (30%) 35 (44%) 9 (11%) 5 (6%) 7
(9%) 3.80 1.195
Q38
Mobile learning technology as one method of teaching and learning.
13 (16%) 50 (63%) 10 (12%) 4 (5%) 3
(4%) 3.83 0.897
Q39
Use of mobile phones or wireless devices is easy in academic environment 20 (25%) 38 (48%) 12 (15%) 5 (6%) 5
(6%) 3.79 1.087
Q40
Mobile Learning Technology is used to support the end of the dustless classroom learning system
15 (19%) 41 (51%) 17 (21%) 4 (5%) 3
1465 |
P a g e
Table 10 Profile of the Teachers
ANNEXURE - II
Profile
Frequency
Percentage (%)
Gender Male
35 44%
Female 45 56%
Total 80 100%
Academic Qualification
Master Degree 50 63%
Doctoral Degree 30 37%
Total 80 100%
Age Group
18-24 years 3 4%
25-27 years 18 23%
28-32 years 30 37%
33-45 years 24 30%
Above 45 years 5 6%
Teaching Experience
0-5 years 21 26%
6-10 years 39 49%
11-15 years 15 19%
16-20 years 5 6%
Designation
Professor 35 44%
Associate Professor 27 34%
Assistant Professor 18 22%
Total 80 100%
Department
Electronics and Communication Engineering
38 47%
Electrical and Electronics Engineering
27 34%
Bio Medical Engineering 15 19%
Total 80 100%
Type of
Management Affiliated Colleges
50 63%
Deemed University 30 37%