INTERNATIONAL RESEARCH JOURNAL OF PHARMACY
www.irjponline.com
ISSN 2230
–
8407
Research Article
STABILITY-INDICATING RP-HPLC METHOD DEVELOPMENT FOR THE ESTIMATION OF
GINGEROL
Rudra Pratap Singh
1, H.V. Gangadharappa
1*, Ramakant M. Narke
2, Pooja V. Jadhav
31
Department of Pharmaceutics, JSS College of Pharmacy, Jagadguru Sri Shivarathreeswara
University, Mysuru, India
2Department of Pharmaceutics, Sinhgad College of Pharmacy, Savitribai Phule University, Vadgaon (BK) Pune, India
3Department of Pharmaceutics, Rasiklal M Dhariwal Institute of Pharmaceutical Education & Research, Pune, India
*Corresponding Author Email: [email protected]
Article Received on: 25/07/17 Approved for publication: 22/08/17
DOI: 10.7897/2230-8407.088145
ABSTRACT
Gingerol is an analgesic, hypoglycemic, hepatoprotective, immune-stimulant, anti-inflammatory agents. In traditional medicine, gingerol has been proven plenty of pharmacological properties such as bactericidal, microbicidal, potent antioxidant, antifertility, tuberculostatic and anticancer. The key objective of this work was to develop, validate and estimate gingerol by RP-HPLC method. According to the ICH guidelines, a stability-indicating RP-HPLC method was developed and validated. In this method, reverse phase enable Cosmosil C18 column (250 × 4.6 mm, 5μm) was used
in isocratic mode. The mobile phase consisted of acetonitrile: methanol: water (52: 8: 40 v/v) delivered at a flow rate of 1.0 mL min- 1. The elute
injection volume was 20 µL that was analyzed by a UV detector at 280 nm. Linearity range of the concentration of gingerol was 20 μg mL-1-140 μg
mL-1 and the correlation coefficient R2 value was found to be 0.997 ± 0.11. Recovery was found to be in the range of 98.16 -100.07 %. The limit of
detection (LOD) of gingerol was found to be 2.23 μg mL-1 and limit of quantitation (LOQ) was 5.02 μg mL-1. Gingerol was subjected to stress
conditions including acidic, alkaline, neutral, oxidation, and dry heat degradation. Gingerol was more sensitive to alkaline, dry heat and oxidative degradation and it is stable at acidic conditions. The method was validated according to ICH guidelines.
Keywords: Stability-indicating, Reverse phase, HPLC method, Validation, Gingerol.
INTRODUCTION
Gingerol [5-hydroxy-1-(4-hydroxy-3-methoxyphenyl)-3-decanone] is a yellowish to buff, spicy and pungent crystalline powder. It is an important phyto-constituent of ginger plant
(Zingiber officinale, Family: Zingiberaceae). It has molecular
formula C17H26O4 and molecular weight 294.38 g/mol1-3. The
chemical structure of gingerol is shown in Figure 1. Gingerol is insoluble in water, soluble in ethanol, methanol and other organic solvents4-5. Gingerol is used as an an analgesic,
hypoglycemic, hepatoprotective, immune-stimulant, anti-inflammatory agents. It also has antibacterial, antimicrobial, antiparasitic, antioxidant, antifertility, tuberculostatic and anticancer properties3-5.
The exact mechanism of action of gingerol in diseases management is unknown till now but it plays a major role to prevent diseases. Some examples of mechanism of actions of gingerol are describing that confirms it’s a potent and useful agent. Gingerol prevents the damage of macromolecules, caused by the free radicals/oxidative stress and shows antioxidant activity. It also inhibits COX and inhibition of nuclear factor κB and confirms the anti-inflammatory processes. Gingerol also acts as antitumor via modulation of genetic pathways such as activation tumour suppressor gene, modulation of apoptosis and inhibition of VEGF. It also shows antimicrobial and other biological activities3,5-6.
MATERIALS AND METHODS Chemicals
Gingerol was procured from Sigma Aldrich chemicals Pvt. Ltd, Bangalore, India. HPLC grade acetonitrile and other solvents (Mfg by: Merck Ltd., Mumbai) were used.
Instrument
The current research work was performed on a Shimadzu (Shimadzu Corporation, Kyoto, Japan) chromatographic system equipped with reverse phase C18 column (250 mm x internal
diameter 4.6 mm x particle size 5μm). Sample injection was done via a 20 μL loop. UV- Visible detector (Shimadzu SPD-20A) was used for detection purpose and output signal was monitored and integrated by LC-solution software.
Preparation of Mobile Phase and Stock Solution
Altered ratios of mobile phase compositions were tried to optimize the RP-HPLC parameters but to get a acceptable separation and good peak symmetry for gingerol, a mobile phase composition of acetonitrile, methanol and water were used in the ratio of 52: 8: 40 (v/v). Before to use the mobile phase, it was filtered under vacuum through 0.22 μm nylon membrane filter and degassed by using sonicator.
solution of 1000 μg mL- 1 respectively. The stock solution were
degassed by using sonicator and filtered through a 0.22 µm nylon membrane filter. From this stock solution different aliquots were prepared.
Preparation of Standard Calibration curves of Gingerol A reverse phase 4.6 × 250 mm Cosmosil C18 HPLC column with
5 µm (particles) packing was used as a chromatographic column for the estimation of gingerol. The column oven temperature and the HPLC system were maintained at 25 ± 2ºC. The mobile phase Acetonitrile: methanol: water (52: 8: 40 v/v) was delivered at a flow rate of 1.0 mL min- 1. The injection volume
was 20 µL. Elute was analyzed by a UV detector.
The standard calibration curve was prepared from the stock solutions (1000 μg mL- 1). The different aliquots were pipetted
into a series of 10 mL volumetric flasks and the volume was made up to the mark with methanol to obtain a set of solutions of gingerol having concentration range 20-140 µg mL-1 each. 20
μL solutions were injected into HPLC system and chromatograms were recoded. The peak areas versus concentrations were plotted for calibration curve.
Validation of the Proposed Method
The proposed methods such as linearity, precision, repeatability and reproducibility, accuracy, limit of detection (LOD) and limit of quantification (LOQ) was validated according to the International Conference on Harmonization (ICH) guidelines7-15.
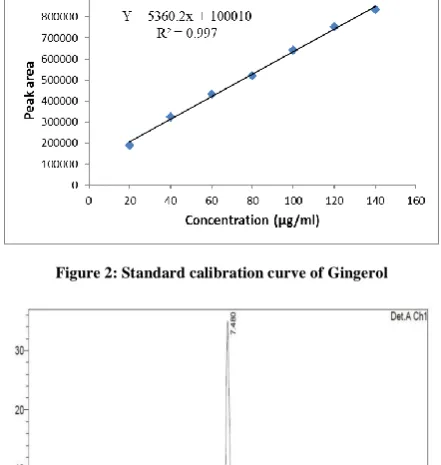
Linearity
To determine the linearity of gingerol, a stock solution of gingerol (1000 μg mL- 1) was prepared in mobile phase and the
linear response was observed over a range of 20-140 μg mL-1 by
HPLC and the calibration curve was plotted between peak areas versus concentrations (Figure 2).
Precision
Method precision of experiment was performed by preparing the standard solution of gingerol (80 μg mL- 1) from the stock
solution of gingerol (1000 μg mL- 1) for six times without
changing the parameters of the proposed method. The results were reported in terms of percent relative standard deviation. The intra-day and inter-day precision of the proposed method was determined and analyzed at three different concentrations (20 μg, 80 μg, and 140 μg) on 3 times on the same day and on 3 different days over a period of 1 wee
Accuracy
The accuracy of the proposed method was determined by calculating the recovery of gingerol by the standard addition method. Known amounts of standard solutions of gingerol was added at 80 %, 100 % and 120 % w/w level to pre analyzed sample solutions of gingerol.
Detection limit and quantification limit
The limit of detection (LOD) and the limit of quantification (LOQ) of the gingerol were derived as per ICH guidelines using following equation:
LOD = 3.3 x σ/S and LOQ = 10 x σ/S
Where σ = Standard deviation of the y-intercept and S = Mean slope of the calibration curve.
Force Degradation Studies
Forced degradation or stress test of gingerol was performed under acidic, alkaline, oxidative and dry heat conditions. Weighted amount of gingerol (10 mg) was transferred in 10 ml volumetric flask and dissolved in methanol to get 1000 µg mL-1
concentration which was used for forced degradation7-15.
Acidic degradation
For acid induced degradation, the stock solution (10 mL) of gingerol (1000 µg mL-1) was treated with 1 mL of 0.1M HCl
and this reaction mixture was refluxed at 70oC for about 1 h.
After 1 h, the solution was neutralized using 1 mL of 0.1M NaOH solution and then injected into HPLC system.
Alkaline degradation
Forced degradation in alkaline condition was performed by treating of stock solution (10 mL) of gingerol (1000 µg mL-1)
with 1 mL of 0.1M NaOH and this reaction mixture was refluxed at 70oC for about 1 h. After 1 h, the solution was
neutralized using 1 mL of 0.1M HCl solution and then injected into HPLC system.
Oxidative degradation
For oxidative degradation, the Stock solution (10 mL) of gingerol (1000 µg mL-1) was transferred to separate round
bottom flask, to this 10 ml of 3% hydrogen peroxide was added and this reaction mixture was kept for 1 h at 70oC. Sample was
diluted and mixed well and injected into HPLC system.
Dry heat degradation
In dry heat degradation condition,accurately weighed 10 mg of gingerol spread in a petri dish and kept in oven at 105oC for
about 8 h and then gingerol was diluted with mobile and filter through 0.45μm filter and injected into HPLC system.
RESULTS
Method development Chromatographic condition
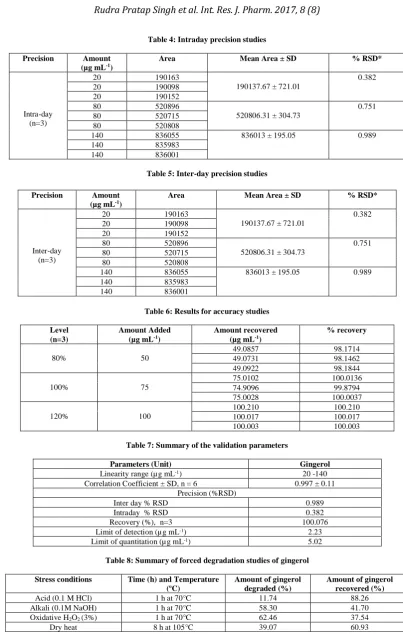
Numerous numbers of chromatographic conditions were examined to optimize the estimation of gingerol. Optimization of RP-HPLC chromatographic conditions are shown in Table 1.
Selection of mobile phase
Several mobile phase compositions were tried to validate RP-HPLC method and to estimate gingerol. A satisfactory separation, good peak symmetry, better reproducibility and repeatability of gingerol were obtained with a mobile phase comprising of Acetonitrile: methanol: water (52: 8: 40 v/v) at a flow rate of 1.0 mL min -1. Quantification was achieved with
UV Visible detector at 280 nm.
Proposed method validation Linearity
0.997 ± 0.11. The regression characteristics and validation parameters are reported in Table 2.
Precision and Accuracy
The repeatability, intra-day and inter-day precision of gingerol are summarized in Table 3, Table 4 and Table 5, respectively. The accuracy of gingerol was determined by recovery study and the mean recoveries were found 100.39 ± 0.94 % respectively for gingerol by the standard addition method shown in Table 6.
Limit of detection and limit of quantitation
The limit of detection and limit of quantitation of gingerol was found to be 2.23 μg mL- 1 and 5.02 μg mL- 1 respectively. The
summary of proposed validation parameters of gingerol was shown in Table 7.
Forced degradation study Acidic degradation
For this study, 0.1 M HCl and 0.1M NaOH was used. The stock solution of gingerol was treated with 1 mL of 0.1M HCl and this reaction mixture was refluxed at 70oC for about 1 h. After 1 h,
the solution was neutralized using 1 mL of 0.1M NaOH solution and then injected into HPLC system. The chromatogram of acidic degradation study of gingerol results are shown in Figure 5.
Alkaline degradation
Forced degradation in alkaline condition was performed by treating of stock solution of gingerol with 1 mL of 0.1M NaOH and this reaction mixture was refluxed at 70oC for about 1 h.
After 1 h, the solution was neutralized using 1 mL of 0.1M HCl solution and then injected into HPLC system. The chromatogram results are shown in Figure 6.
Oxidative degradation
For oxidative degradation, the Stock solution of gingerol was transferred to separate round bottom flask, to this 10 ml of 3% hydrogen peroxide was added and this reaction mixture was kept for 1 h at 70oC. Sample was diluted and mixed well and injected
into HPLC system. The chromatogram results are shown in Figure 7.
Dry heat degradation
In dry heat degradation condition,accurately weighed 10 mg of gingerol spread in a petri dish and kept in oven at 105oC for
about 8 h and then gingerol was diluted with mobile and filter through 0.45μm filter and injected into HPLC system. The chromatogram results are shown in Figure 8.
The results of forced degradation study of gingerol under different degradation conditions are summarized in Table 8.
Figure 1: Chemical structure of Gingerol
Figure 2: Standard calibration curve of Gingerol
Figure 5: Chromatogram of Acid degradation of Gingerol Figure 6: Chromatogram of Alkaline degradation of Gingerol
Figure 7: Chromatogram of Oxidative Degradation of Gingerol Figure 8: Chromatogram of Dry heat Degradation of Gingerol
Table 1:Optimization of RP-HPLC method
Method parameter Optimized value
Column C18 (250 mm x 4.6 mm x 5μm)
Wavelength of detection 280 nm
Mobile phase Acetonitrile: methanol: Water (52: 8: 40 v/v) Pump mode Isocratic
Flow rate 1.0 mL min-1
Run time 10 minutes Volume of injection 20 µL
Temperature 25 ± 2ºC
Table 2: Linear regression data for calibration curves
Parameters Gingerol
Linearity range µg/ml 20-140 r2 ± SD* 0.997 ± 0.11
Slope ± SD* 5360.2 + 2169.02 Intercept ± SD* 100010 + 0862.15 Y= mx + c Y = 5360.2x + 100010
Table 3: Repeatability studies
Precision Amount
(µg mL-1)
Area Mean Area ± SD* % RSD*
Repeatability (n=6)
80 520896
520327.33 + 137.02 1.32 80 519033
Table 4: Intraday precision studies
Precision Amount
(µg mL-1)
Area Mean Area ± SD % RSD*
Intra-day (n=3)
20 190163
190137.67 ± 721.01
0.382 20 190098
20 190152 80 520896
520806.31 ± 304.73
0.751 80 520715
80 520808
140 836055 836013 ± 195.05 0.989 140 835983
140 836001
Table 5: Inter-day precision studies
Table 6: Results for accuracy studies
Level (n=3)
Amount Added (µg mL-1)
Amount recovered (µg mL-1)
% recovery
80% 50
49.0857 98.1714 49.0731 98.1462 49.0922 98.1844
100% 75
75.0102 100.0136 74.9096 99.8794 75.0028 100.0037
120% 100
100.210 100.210 100.017 100.017 100.003 100.003
Table 7: Summary of the validation parameters
Parameters (Unit) Gingerol
Linearity range (µg mL-1) 20 -140
Correlation Coefficient ± SD, n = 6 0.997 ± 0.11 Precision (%RSD)
Inter day % RSD 0.989 Intraday % RSD 0.382 Recovery (%), n=3 100.076 Limit of detection (µg mL-1) 2.23
Limit of quantitation (µg mL-1) 5.02
Table 8: Summary of forced degradation studies of gingerol
Stress conditions Time (h) and Temperature
(oC)
Amount of gingerol degraded (%)
Amount of gingerol recovered (%)
Acid (0.1 M HCl) 1 h at 70°C 11.74 88.26 Alkali (0.1M NaOH) 1 h at 70°C 58.30 41.70 Oxidative H2O2 (3%) 1 h at 70°C 62.46 37.54
Dry heat 8 h at 105°C 39.07 60.93
DISCUSSION
The present research work describes a simple and sensitive RP-HPLC method for the estimation of gingerol. Various ratio of Acetonitrile: methanol: water mobile phase were tried and found that (52: 8: 40 v/v) proportion of the mobile phase favored the separation and elution of gingerol. In RP-HPLC method, the linearity range was in between 20-140 μg mL-1 for gingerol with
co-efficient of correlation (R2) = 0.997 ± 0.11. The results of
accuracy and precision were in good agreement with the threshold limits of validation parameters as per ICH guidelines. The intra-day and inter-day variability and accuracy results of gingerol were found in acceptable limit. The LOD and LOQ values of gingerol were found 2.23 μg mL- 1 and 5.02 μg mL- 1
respectively.
In this research, gingerol was applied for the stability studies and it subjected to different stress conditions and evaluated by
Precision Amount
(µg mL-1)
Area Mean Area ± SD % RSD*
Inter-day (n=3)
20 190163
190137.67 ± 721.01
0.382 20 190098
20 190152 80 520896
520806.31 ± 304.73
0.751 80 520715
80 520808
140 836055 836013 ± 195.05 0.989 140 835983
HPLC, where gingerol was more sensitive to alkaline (2.87 min), dry heat (4.50 min) and oxidative degradation (2.29 min). It was found to be stable under the acidic condition (7.39 min).
CONCLUSION
The developed and validated RP-HPLC method for gingerol estimation was found suitable and accurate. The Simplicity of the method, economical nature and low limit of detection and quantification makes the method superior to the other reported HPLC methods.
LIST OF ABBREVIATIONS % - Percent
max- Wavelength of maximum absorbance
°C- Degree celcious µg - Micro gram h - Hour
LOD - limit of detection LOQ - limit of quantification Mg - Milligram
Min - Minute mL - Milliliter µL - Microliter
r2- Regression coefficient
RP-HPLC- Reverse phase-high performance liquid Chromatography
SD - Standard deviation tR - Retention time
UV - Ultra Violet
REFERENCES
1. Kubra IR, Rao LJ. An overview on inventions related to ginger processing and products for food and pharmaceutical applications. Recent Patents on Food, Nutrition and Agriculture 2012; 4: 31-49.
2. Nile SH, Park SW. Chromatographic analysis, antioxidant, anti-inflammatory and xanthine oxidase inhibitory activities of ginger extracts and its reference compounds. Industrial Crops and Products 2015; 70: 238-244.
3. Singh RP, Jain R, Mishra R, Tiwari P. Antidepressant activity of hydro alcoholic extract of Zingiber officinale. Internation Research Journal of Pharmacy 2012; 3(2): 149-151.
4. Kim EC, Min JK, Kim TY, Lee SJ, Yang HO, Han S, Kim YM, Kwon YG, [6]-Gingerol, a pungent ingredient of ginger, inhibits angiogenesis in vitro and in vivo. Biochemical and Biophysical Research Communications 2005; 335: 300-308.
5. Rahmani AR, Al shabrmi FM, Aly SM. Active ingredients of ginger as potential candidates in the prevention and treatment of diseases via modulation of biological activities. International Journal Physiology, Pathophysiology and Pharmacology 2014; 6(2): 125–136.
6. Young HY, Luo YL, Cheng HY, Hsieh WC, Liao JC, et al.
Analgesic and anti-inflammatory activities of [6]-gingerol. Journal of Ethnopharmacology 2005; 96: 207-210.
7. ICH IC. Q2 (R1): Validation of analytical procedures: text
and methodology. InInternational Conference on
Harmonization, Geneva 2005.
8. Dey S, Patro SS, Babu NS, Murthy PN, Panda SK. Development and validation of a stability-indicating RP–HPLC method for estimation of Atazanavir sulfate in bulk. Journal of Pharmaceutical Analysis 2017; 7: 134-140.
9. Bhirud CH, Hiremath SN. Stability indicating RP-HPLC method for the determination of Atazanavir sulphate in bulk and dosage form. Drug Invention Today 2013; 5: 81-86.
10. Wang WH, Wang ZM, Xu LZ, Yang SL. HPLC determination of 6-gingerol in rhizoma Zingiberis Recens.
Zhongguo Zhong Yao Za Zhi 2002; 27(5): 348-9.
11. Hiserodt RD, Franzblau SG, Rosen RT. Isolation of 6, 8 and 10-Gingerol from ginger rhizome by HPLC and preliminary evaluation of inhibition of mycobacterium avium and
mycobacterium tuberculosis. Journal of Agriculture and Food
Chemistry 1998; 46: 2504-2508.
12. Weon JB, Ma JY, Yang HJ, Ma CJ. Simultaneous Determination of ferulic acid, hesperidin, 6-gingerol and glycyrrhizin in insampaedok- san by HPLC coupled with diode array detection. Journal of Analytical Chemistry 2012; 67(12): 955–959.
13. Singh M, Ahmad S, Alam P, Salam S. Stability-indicating RP-HPLC method for the determination of 6-gingerol in poly-herbal formulations. Journal of Analytical Science and Technology 2015; 6: 23.
14. Feng X, Kong W, Wei J, Ou-Yang Z, Yang M. HPLC fingerprint analysis combined with chemo metrics for pattern recognition of ginger. Pharmaceutical Biology 2014; 52(3): 362-367.
15. Pawar N, Pai S, Nimbalkar M, Dixit G. RP-HPLC analysis of phenolic antioxidant compound 6-gingerol from different ginger cultivars. Food Chemistry 2011; 126: 1330-1336.
Cite this article as:
Rudra Pratap Singh et al. Stability-indicating RP-HPLC method development for the estimation of gingerol. Int. Res. J. Pharm. 2017;8(8):56-61 http://dx.doi.org/10.7897/2230-8407.088145
Source of support: Nil, Conflict of interest: None Declared