usage of moss in green roof implementation available, this paper establishes the thermal performance of Sunagoke (Racomitrium Canescens) moss green roof in addressing UHI effect. As the evaluation conditions, the thermal performance of Sunagoke moss green roof was investigated quantitatively through indoor and outdoor experiments. Indoor experiments were performed inside the artificial climate chamber with the ambient temperature and humidity fixed at 30 °C and 70% RH, respectively, while the irradiance strength and wind velocity were altered as the investigation parameters. Meanwhile, outdoor experiments were piloted at Yamaguchi University main office building rooftop, consisting of the uncontrollable natural environment. As the test candidates, a model house with 3mm of Sunagoke mat and control model house were utilized in the indoor and outdoor experiments. Besides, model houses with 30mm of Sunagoke mat and grass were added as comparison candidates in outdoor experiments. In outdoor experiments, all green roofs displayed better convection heat transfer coefficient than the control roof; however, the thinnest Sunagoke had the best ability to release heat compared to other competitors. The albedo was not affected by wind velocity but irradiance strength, noting 0.25, 0.22, 0.22, and 0.24 for model houses Sunagoke 3mm, Sunagoke 30mm, grass, and control, respectively. The 30mm thickness Sunagoke moss did not deliver heat as good as 3mm Sunagoke moss and 25mm grass in term of convection heat, but the suppression of interior temperature was the most superior. Despite the absence of soil, both Sunagoke moss green roofs showed decent insulation effect and provided thermal relaxation comparable to grass.
Index Term— Sunagoke moss green roof, convection heat
transfer, thermal performance, interior temperature.
I. INTRODUCTION
AMONG the most well-known environmental issues faced by
M. Amir A. K. is with the Department of Systems Design and Engineering, Yamaguchi University, Tokiwadai 2-18-1, Ube City, Yamaguchi 755-8611, Japan. (e-mail: [email protected]).
Y. Katoh is with the Department of Systems Design and Engineering, Yamaguchi University, Tokiwadai 2-18-1, Ube City, Yamaguchi 755-8611, Japan. (e-mail: [email protected]).
H. Katsurayama is with the Department of Systems Design and Engineering, Yamaguchi University, Tokiwadai 2-18-1, Ube City, Yamaguchi 755-8611, Japan. (e-mail: [email protected]).
M. Koganei is with the Department of Architectural Design and Engineering, Yamaguchi University, Tokiwadai 2-18-1, Ube City, Yamaguchi 755-8611, Japan. (e-mail: [email protected]).
developed countries. Studies on UHI were widely performed and had reported that the city air temperature was higher than rural environment by approximately 2.5 °C [3, 4], while Niewolt [5] stated that as compared to the airport, city air temperature was warmer and drier by 3.5 °C. Meanwhile, a study conducted by Bowler et al. [6] emphasized that the temperature in areas with plants, like the urban green park, was cooler by 1 °C than areas without any greenery. Also, as testified by Aniello et al. [7], the difference in temperature between city and rural areas was in the range of 5-11 °C.
Increase in electricity demand for cooling [4], health problems [8], and high possibility of smog [9] are the common problems faced by the areas encountered by UHI. This phenomenon is greatly induced by the following causes [1, 8, 10-13]:
i. Destruction of green regions by urbanization,
ii. Alteration on thermal properties in urban areas, i.e., usage of high thermal absorptivity materials,
iii. Decreased evaporative cooling and more energy converted to convection heat,
iv. Multifaceted surface of landscape and increased waterproof cover,
v. High usage of combustible fuels by vehicles and industries, and
vi. Captivation of solar radiation from low reflectivity materials.
To temper with the UHI effects, mitigation methods, such as roof spray cooling [14] and utilizing high albedo materials in urban construction [3, 15], were encouraged. However, Akbari et al. [9] recommended that improving greenery in urban regions will deliver a fast, clean, and ecological friendly measure for UHI. The well-known advantages of increasing vegetation coverage in
M. Mizunuma is with the Promotion of Industry-Academia-Government, Yamaguchi Prefectural Industrial Technology Institute, Asutopia 4-1-1, Ube City, Yamaguchi 755-0195, Japan. (e-mail: [email protected]).
Y. Awata is with the Department of Mechanical Engineering, Yamaguchi University, Tokiwadai 2-18-1, Ube City, Yamaguchi 755-8611, Japan. (e-mail: [email protected]).
International Journal of Civil & Environmental Engineering IJCEE-IJENS Vol: 17 No: 06 2
urban areas are also associated with increasing the albedo and deflection of solar radiation, implementing a shading effect, stimulating evapotranspiration and cutting down sensible heat by consuming latent heat, absorbing carbon dioxide and discharging oxygen, improving the aesthetical value, restraining urban flooding by increasing water retention, and also giving habitations for animals [1, 9, 13, 16-29].
Nevertheless, urban areas are crammed with buildings, concrete, and asphalt, thus making the attempt of growing new vegetation to be a tough task. Green roof is prone to be an idyllic practise to increase the green region in urban areas, since it is a technique where the idle part of the roof of buildings is utilized for vegetation. It is an alternative technique to increase green open spaces like the one introduced in a research performed by Suparwoko [11]. The function of green roof was examined and recognized to be beneficial in Malaysia [2], Greece [17], Spain [26], the United States [18, 31], Lebanon [30], Sweden [32], and Japan [33], irrespective of different climatic conditions. Green roof system can be categorized into two groups; intensive green roofs which use a variety of plants that usually need considerable investment for preservation, and extensive green roofs which are a contemporary adaptation of the ideas with shallower soil and low-growing ground cover [23, 28-30]. The extensive green roof type is more favorable by the experts and researchers because its construction is simple and economical.
Extreme temperature fluctuations, high solar radiations, irregular rain events and wind speeds are harsh environments that are exposed to the roofs [34]. Therefore, the selection of green roof plant is a critical standard to define the primary and maintenance expenditures, durability, energy saving, and thermal performance of the system. Among the infamous plants commonly used in extensive green roofs are grass and sedum types [21, 22, 26, 29, 32, 35-39]. Besides, flowers, herbaceous perennials, and other types of plants were also utilized by researchers [25, 30, 32, 35, 39]. On top of that, mosses were selected as a research green roof candidate starting over a decade ago, as they are believed to be able to hold water 8-10 times of their weight, in contrast to only 1.3 times for other ordinary green roof mediums [33, 40-42]. Moss belongs to a non-vascular plant type that can endure draught in a long time by going dormant [43].
Furthermore, the Sunagoke (Racomitrium Canescens) was identified as the only truly draught tolerant moss species [31]. Anderson et al. [42] supported this finding as they stated that Sunagoke is an acrocarp that cultivates in pack clusters with straight-up shoots and is likely more effective in holding interstitial water than other plants in their report. The ability of green roofs planted only with Sunagoke is that they had 12-24% greater stormwater retention than vascular or medium roofs only candidates are also stressed. Besides, Sunagoke surface showed the cooling ability of approximately six times quicker than the only medium roof. This study revealed the capability of Sunagoke in improving temperature fluctuations on the application of the system. Sunagoke is also well-known for its features, which are resistant to drying and do not necessitate soil to grow, thus allowing the weight reduction in green roof construction since no roof reinforcement is needed. Sunagoke
moss is a practically maintenance-free plant that grows on natural water, such as rain or dew and light, hence making it a decent prospect as a green roof candidate [41].
Especially in Japan, Sunagoke moss has attracted a lot of attention as an excellent green roof plant [12, 13, 33, 44]. A stimulating study made by Suzaki et al. [33] highlighted the cooling performance of Sunagoke green roof as compared to artificial turf and traditional roof. On a rainy day, the Sunagoke surface temperatures were 2 °C and 4 °C cooler than that of the artificial turf and conventional roof, correspondingly. The surface temperatures were then recorded as 17 °C and 4 °C cooler during a clear day (after a rainy day). The study clearly showed that the slabs that were covered with Sunagoke had extended periods of effective cooling.
As presented above, almost all studies examined the effects of implementing green roof by piloting field experiments [17, 30, 38, 39, 42] and by means of numerical simulations [38, 45, 46]. Nevertheless, the outdoor environmental parameters influencing the thermal performance of a green roof are truly complex as they shift through time. The parameters that co-exist, including the ambient temperature and humidity, solar radiation, secondary radiation (sum of radiations from sources other than sun), wind velocity, and thermal properties of the green roof system, are making the prior and present assessments challenging to be evaluated. Therefore, it is essential to quantitatively inspect the effect of each parameter, specifically the wind velocity that is affecting the evaluation the most. Due to the complications conversed above, this paper aims to publish the evaluations on thermal performance of Sunagoke moss green roof by executing investigations both in an enclosed laboratory and outdoor environments. The evaluation will be focusing on heat balance, albedo, convection heat transfer coefficient, and the interior temperature of an examined model house where a Sunagoke green panel was installed. Since there are insufficient studies that publicized the performance of Sunagoke moss, this paper will also supply a novel data for forthcoming research.
II. METHODOLOGY
A. Outdoor Experimental Setup
instruments were used as in the indoor experimental setup. A clear day of 30 September in 2017 was chosen as the representative experimental data.
B. Indoor Experimental Setup
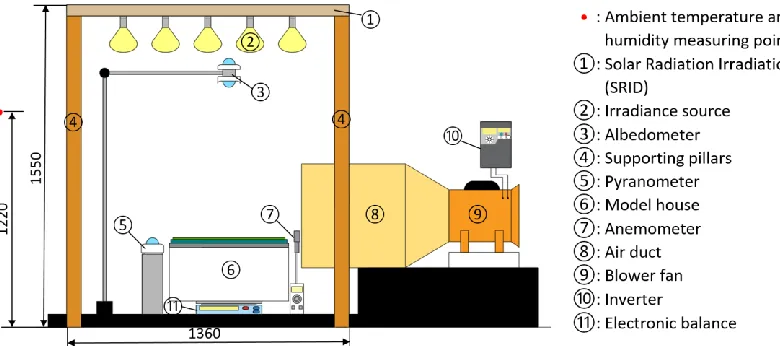
In the interest of quantitative evaluation the performance of green roofs corresponding to each parameter, indoor experiments were also executed in an enclosed environment by using the MC-402 Artificial Climate Chamber (ACC) at Yamaguchi Prefectural Industrial Technology Institute. To create an environment similar to the average summer environmental condition at Tokyo, Japan in August 2016 based on the data surveyed [47], the ambient temperature and humidity were set to 30 °C and 70 % RH, respectively.
Fig. 1 illustrates the Solar Radiation Irradiation Device (SRID) utilized to set the three different intensities (600, 800, and
1000 W/m2) of irradiance 𝑅𝐼. The irradiated spectral irradiation is
presented in Fig. 2. Here, the measured irradiance was treated to consist of not only the radiation from SRID, but also some portions of secondary radiation from surrounding floors and walls inside ACC. At this instant, the secondary radiation portions are undistinguishable in the experimental setup. The irradiance strengths were selected to reproduce the typical solar radiation range during a clear summer day in Japan.
Five levels of average wind velocity, 𝑈𝑎𝑣𝑒 (0, 1, 1.5, 2, and 3 m/s) were controlled by a FR-FS2-0.4K fan inverter to evaluate the effect of convection heat transfer on green roofs. Wind velocity of 0 m/s demonstrated the natural convection condition where there was no dynamic wind flow involved. The wind stream generated by SHT-250 blower fan was treated by a 500
500 mm cross-sectional area air duct and V-13-100 honey-comb funnel. The wind velocity profile was determined from the lower-half of the air duct outlet since the wind profile was found to be symmetric through the middle point during the preliminary procedure. Besides, an EM-SD vane-type anemometer probe with a pre-attached T-type thermocouple was stationed at the air duct outlet to verify the wind velocity and temperature at the air duct outlet. The anemometer came along with a logger which enabled the data to be recorded. All indoor experiments were conducted in two halves; the first 90 minutes without any wind velocity (𝑈𝑎𝑣𝑒= 0 [m/s]), and the next 60 minutes with wind velocity. Each experiment was conducted twice to increase accuracy and reliability, and the average results were determined.
C. Model Houses
To evaluate the thermal performance of multiple green roofs, four identical model houses (three with green panels) made from box-shaped Polystyrene foams were prepared. In this paper, green roof was executed by installing the pre-manufactured light weight green panel on the model house as shown in Fig. 3. Table I indicates the model houses used, associated with their respective green panels’ specifications. A model house, named C, was used as the control house; i.e., a representative of a conventional dry and untreated roof. All green panels (S3, S30
TABLEI
GREEN PANELS SPECIFICATION
Plant mat Scientific name
Thickness [mm]
Growing medium
*Area coverage
[%] Sunagoke, S3 Racomitrium
canescens
3 (with adhesives)
- 89
Sunagoke, S30 Racomitrium canescens
30 - 84
Grass, G Zoysia matrella
25 5 mm of soil layer
42
*Area coverage was determined from image analysis
Fig. 1. Schematic diagram of experiment equipment in Artificial Climate Chamber. Dimensions displayed in millimeters.
International Journal of Civil & Environmental Engineering IJCEE-IJENS Vol: 17 No: 06 4
and G) were assumed to be in a naturally dry condition because no irrigation was made since day 1 prior to the experimental. A green panel with grass mat (G) was equipped with 5 mm thickness of soil layer. On the other hand, there were no substrate layers on both Sunagoke moss green panels (S3 and S30) since Sunagoke does not require them to cultivate. Except for model house S3, Sunagoke moss was mixed with organic adhesives to fix it on top of the galvalume steel plate. Additionally, the back of the galvalume steel plate was adhered with Styrofoam, acting as a heat insulator. Meanwhile, the roof plate was painted with matte black finishing to reduce radiation reflectivity; thus, less physical properties of the roof will affect evaluation.
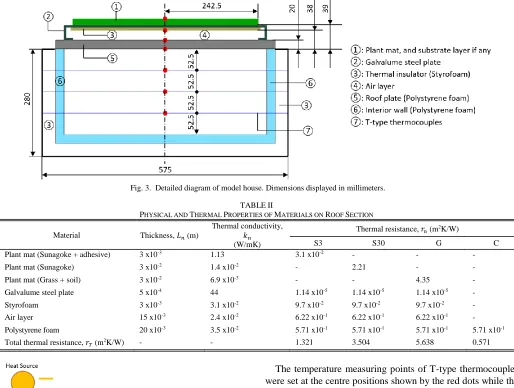
The temperature measuring points of T-type thermocouples were set at the centre positions shown by the red dots while the temperature measurements were recorded with one minute sampling period by Datum-Y XL100 data logger. In total, there were 7 thermocouples installed in model houses S3, S30 and G, and 5 thermocouples in model house C. From here, the interior temperature of each model house was defined as the average of 3-temperature measuring points inside the model house. Model houses S3, S30, G, and C were used during the outdoor experiments, while model houses S3 and C were used in the indoor experiments.
D. Evaluation Method
Theoretically, in order to derive the heat balance around green panel and roof plate of a model house, the total radiation 𝑅𝑛 [W/m2] received by a subject surface will be taken equal to the
sum of convection heat 𝑄𝑐𝑜𝑛𝑣𝑒𝑐𝑡𝑖𝑜𝑛 [W/m2], latent heat of
evapotranspiration 𝑄𝑙𝑎𝑡𝑒𝑛𝑡 [W/m2], and conduction heat 𝑄𝑐𝑜𝑛𝑑𝑢𝑐𝑡𝑖𝑜𝑛 [W/m2]. However, the experiments conducted by
assuming all model houses were in naturally dry condition and no evapotranspiration occurred, thus, the heat balance equation is represented as in Eq. (1) and Fig. 4 [25, 48]. In Tabares-Valesco et al. [48] model, there are other fractions of heat such as thermal and metabolic storage. However, both fractions only
TABLEII
PHYSICAL AND THERMAL PROPERTIES OF MATERIALS ON ROOF SECTION
Material Thickness, 𝐿𝑛 (m)
Thermal conductivity, 𝑘𝑛
(W/mK)
Thermal resistance, 𝑟𝑛 (m2K/W)
S3 S30 G C
Plant mat (Sunagoke + adhesive) 3 x10⁻³ 1.13 3.1 x10⁻² - - -
Plant mat (Sunagoke) 3 x10⁻² 1.4 x10⁻² - 2.21 - -
Plant mat (Grass + soil) 3 x10⁻² 6.9 x10⁻³ - - 4.35 -
Galvalume steel plate 5 x10⁻⁴ 44 1.14 x10⁻⁵ 1.14 x10⁻⁵ 1.14 x10⁻⁵ -
Styrofoam 3 x10⁻³ 3.1 x10⁻² 9.7 x10⁻² 9.7 x10⁻² 9.7 x10⁻² - Air layer 15 x10-3 2.4 x10⁻² 6.22 x10⁻¹ 6.22 x10⁻¹ 6.22 x10⁻¹ -
Polystyrene foam 20 x10-3 3.5 x10⁻² 5.71 x10⁻¹ 5.71 x10⁻¹ 5.71 x10⁻¹ 5.71 x10⁻¹ Total thermal resistance, 𝑟𝑇 (m2K/W) - - 1.321 3.504 5.638 0.571
Fig. 3. Detailed diagram of model house. Dimensions displayed in millimeters.
made up about 1-2% of the whole heat balance, thus neglected in Eq. (1).
𝑅𝑛= 𝑄𝑐𝑜𝑛𝑣𝑒𝑐𝑡𝑖𝑜𝑛+ 𝑄𝑐𝑜𝑛𝑑𝑢𝑐𝑡𝑖𝑜𝑛 (1)
The calculation method for the conduction heat will be explained in the following paragraphs, while the convection heat flux can be derived by the revenue minus of total radiation
𝑅𝑛 from the conduction heat. The convection heat is also considered as the heat energy transferred by both natural and forced convection reactions. At the same time, the total radiation
𝑅𝑛 can also be derived by subtracting the irradiance 𝑅𝐼 irradiated by SRID with the reflected radiation 𝑅𝑅 as shown in Eq. (2). Throughout the experiments, the irradiance and reflected radiation were measured by MS-402 pyranometer and LP-PYRA-06 albedometer, respectively. Both devices are able to measure spectral in wavelength range of 285-2800 [nm] and 305-2800 [nm], individually.
𝑅𝑛= 𝑅𝐼− 𝑅𝑅 (2)
The ratio of Grashof number and the square of Reynolds number was determined to observe the wind flow characteristic generated by the blower. The Grashof number itself is explained in Eq. (3) where it is a nondimensional parameter usually used to define the heat and mass transfer due to convection on a solid surface. Another parameter to express wind characteristics is by referring to its Reynolds number as defined in Eq. (4). By finding the ratio of Grashof number and square of Reynolds number, the natural and forced convection can be clearly classified. Value of 𝐺𝑟/𝑅𝑒2 less than 0.1 identifies the forced convection dominating the heat transfer, and contrarily, the natural convection will govern when the value is bigger than 10. When the ratio is in between 0.1 and 10, the combination of forced and natural convection need to be recognized [49, 50]. On the other hand, the convection heat transfer coefficient was calculated as in Eq. (5) to validate the convection features as
well.
𝐺𝑟 =𝑔𝛽(𝑇𝑠−𝑇∞)𝐿3
𝑣2 (3) 𝑅𝑒 =𝑈 𝐿𝑣 (4)
ℎ =𝑄𝑐𝑜𝑛𝑣𝑒𝑐𝑡𝑖𝑜𝑛
(𝑇𝑠−𝑇∞) (5)
Next, the conduction heat flux 𝑄𝑐𝑜𝑛𝑑𝑢𝑐𝑡𝑖𝑜𝑛 refers to the amount of heat entering the interior cavity of the model house vertically from the roof layer. By applying Eq. (6) and (7), the total thermal resistance 𝑟𝑇 can be obtained [51]. Subsequently, by substituting the outermost surface layer and ceiling temperature difference ∆𝑇 into Eq. (8), the conduction heat at the roof can be calculated. All thermal conductivities including plant mats were assumed constant, throughout the experiments, and applied the measurement values as stated in Table II. Note that the flow of heat was defined as the inflow of heat which is the amount of heat entering the room through the roof, while the outflow of heat is the amount of heat emanating from the room to the roof.
𝑟𝑛=𝐿𝑘𝑛
𝑛 (6) 𝑟𝑇 = 𝑟1+ 𝑟2+ ⋯ + 𝑟𝑛 (7)
𝑄𝑐𝑜𝑛𝑑𝑢𝑐𝑡𝑖𝑜𝑛= ∆𝑇𝑟
𝑇 (8)
III. RESULTS AND DISCUSSION
Although the initial ambient temperature and humidity of about 1.2 m above ground inside the artificial climate chamber were set to be fixed at 30 °C and 70% RH, the real measured values were 30 ±0.3 °C and 65 ±3.6 % RH, respectively. The actual value wavered slightly because the machine adjusted the pre-set environment condition along with the condition of the experiment that changed continuously. Meanwhile, the
International Journal of Civil & Environmental Engineering IJCEE-IJENS Vol: 17 No: 06 6
irradiances generated by the SRID were recorded with minimal fluctuation for 600, 800, and 1000 W/m2. On the other hand, the
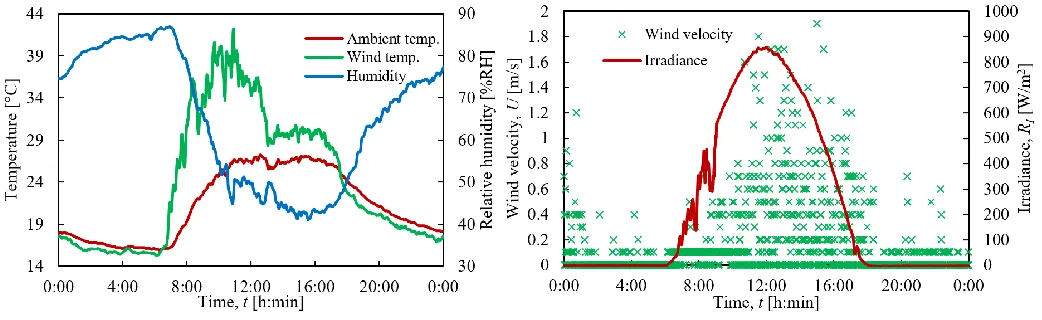
parameter conditions in an outdoor experiment on 30 September 2017 are presented in Fig. 5 (a) and (b). The existence of cloud was minimal throughout the experiment except in the morning. Usually, the wind movements are calmer during night-time but vary during day-time. Also, it was noticed that the humidity decreased with the rise of wind velocity because the movement of wind swept away the water molecules at the experiment location. Since the wind was rapidly changing during day-time, the data in the period from 9:30 to 16:00 were taken as the evaluation subject.
A. Convection Heat Transfer Characteristics
Wind existence is an important parameter in the experiment; therefore, it is crucial to learn the behaviour of the wind flow as it will give the basic understanding of how the wind responds and affects the heat transfer system of the entire model house. Fig. 6 illustrates the derived ratio of Grashof number and square of the Reynolds number from Eq. (3) and (4). Only for indoor experiments, the results shown are associated with the irradiance irradiated in the experiment.
The ratio of Grashof number and square of Reynolds number specified a natural convection if the value was larger than 10, combination of forced and natural convection in between 0.1 and 10, and forced convection if the value was less than 0.1 [49, 50]. At static wind of 0 m/s, the ratio extended to positive infinity, thus the natural convection was assumed to govern the heat transfer on all model houses. The region of 0<𝑈𝑎𝑣𝑒<2 m/s was considered as the transition region where the combined convection took place. Although the maximum wind velocity in
the outdoor experiment was 1.9 m/s, the ratios for S3, S30, G, and C were assumed to follow the same curvature beyond 2 m/s of wind velocity. Hence, wind velocity of 2 m/s (𝑅𝑒=74,500) was considered as the critical point where the forced convection started to dominate the heat transfer on all model houses. Gaffin et al. [20] achieved alike finding where wind velocity of 1.75 m/s was verified to be the indicator of forced convection in their investigation.
Results for model houses S3 and C showed great agreement between indoor and outdoor data; however, outdoor data were detected with some fluctuations due to irradiance strength variation. Generally, the ratios for model houses with the green panel (S3, S30, and G) were lower compared to the ratio for untreated model house C. This occurred because the surface and ambient temperature differences of model houses with green panels were much lower. In the indoor experiment, the same concept was also applied to the higher irradiance condition where a higher irradiance will elevate the surface temperature and the temperature differences as well. Thus, the ratio increases in higher irradiance.
Unlike the ratio of Grashof number and square of Reynolds number, the increased wind velocity had reduced the surface temperature along with the temperature differences with ambient temperature, causing the convection heat transfer coefficient to increase in laboratory experiments, as depicted in Fig. 7. Generally, there were no correlations between the irradiance and the convection coefficient since only ±1% variations were found for model house S3 and C. At the time when the wind velocity was getting faster, the surface temperature remained almost constant which caused the heat transfer coefficientto remain similar with the wind velocity of 2 m/s onwards (forced convection region).
Fig. 6. Ratio of Grashof number and square of Reynolds number. Indoor data were displayed according to the irradiance and average wind velocity, while outdoor data were sorted and displayed only according to the local wind velocity, regardless the irradiance. For indoor results, the irradiances were denoted by
In a natural convection region, the resulting average convection heat transfer coefficients were 24.5 ±0.31 W/m2K,
and 14.5 ±0.16 W/m2K for model house S3 and C, respectively.
Meanwhile, in a forced convection region, the obtained convection heat transfer coefficients were 116.1 ±0.99 W/m2K,
and 37.8 ±0.24 W/m2K, in the same model houses order.
Therefore, the application of Sunagoke moss green roof was clarified to improve the convection heat transfer ability of the model houses by a factor of 1.6 in natural convection, and 2.9 in forced convection.
As a comparison with common plants, Kumar et al. [52] reported that the maximum convection heat transfer coefficient
TABLEIII
HEAT FLUXES RELATIVE TO IRRADIANCE IN NATURAL AND FORCED CONVECTION
Model house Convection heat [%] Conduction heat [%] Sunagoke S3, indoor 98.4 ±0.05 (99.6
±0.03)
1.6 ±0.05 (0.4 ±0.02)
Sunagoke S3, outdoor
99.5 ±0.34 0.5 ±0.34
Sunagoke S30, outdoor
99.3 ±0.23 0.7 ±0.23
Grass G, outdoor 99.7 ±0.13 0.3 ±0.13
Control C, indoor 95.3 ±0.09 (98.4 ±0.04)
4.7 ±0.09 (1.6 ±0.04)
Control C, outdoor 98.6 ±1.03 1.4 ±1.03
* The value written in bracket is for forced convection.
Fig. 7. Convection heat transfer coefficient for each model house in indoor experiment with different wind velocity. Since there were no positive correlation between irradiance and convection heat transfer coefficient, only averaged data were displayed. Reference data by Kumar et al. shows some other typical plants’
convection heat transfer coefficient.
International Journal of Civil & Environmental Engineering IJCEE-IJENS Vol: 17 No: 06 8
in natural convection was 26.8 W/m2K for peperomia, 10.1
W/m2K for egg-plant, and 23.5 W/m2K for wax-bean, as
acquired in experiments conducted in a wind tunnel. The convection heat transfer coefficient increased to 59.5 W/m2K
for peperomia and egg-plant, and 42.7 W/m2K for wax-bean in
forced convection. The convection heat transfer coefficients for Sunagoke moss, especially in the forced convection, were 2 times higher than the reference, and may result from the different heating intensities to the subject plant. Therefore the data presented in this paper were considered valid.
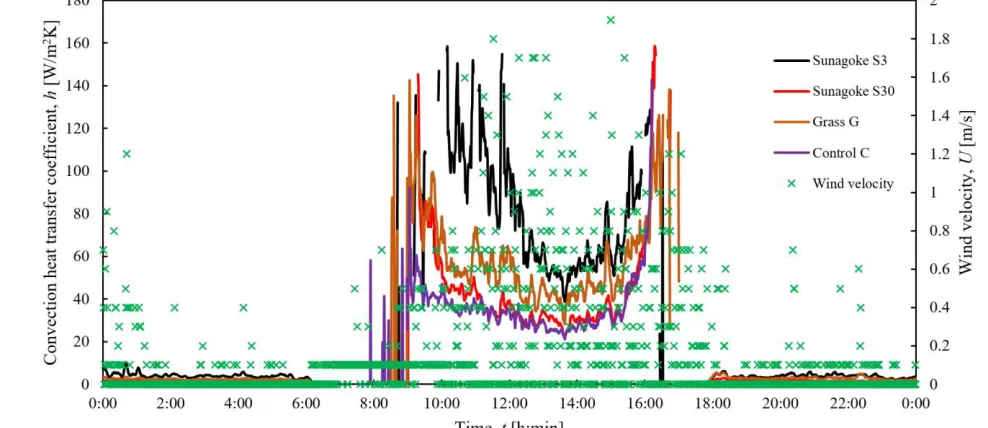
Nevertheless, the convection heat transfer coefficient taken in outdoor experiments showed huge fluctuations during the day as demonstrated in Fig. 8. Fascinatingly, the increment of wind velocity did not guarantee high convection coefficient because the temperature differences between surface and ambient air were uneven, irrespective of the wind velocity. Clearly, the solar radiation flux fluctuations also contributed to the irregularity. The three green panels displayed better convection coefficient than the control roof; however, the thinnest S3 had the best ability to release heat compared to other competitors. Also, the thicker S30 was not necessarily better than S3 since thicker plant mat has higher heat capacity which makes temperature reduction at the surface less effective.
Besides, there were extreme fluctuations detected during early morning and late evening when the temperature differences were the greatest. However, the temperature difference variations were steadier from 10:00 to 15:00, and almost 0 during the night for most of the model houses.For the representation, in average, the convection heat transfer coefficients for model houses S3, S30, G, and C were 78.7 ±26.5, 38.1 ±10.7, 52.4 ±12.2, and 33.5 ±7.5 [W/m2K],
respectively, while the average wind velocity was 0.33 ±0.41 [m/s]. Compared to the indoor experiment, the result for model house C was similar; however, the result for model house S3 was fairly high in outdoor experiments due to different environmental conditions.
B. Heat Balance on Model Houses
The incoming radiation (i.e. irradiance) were initially reflected before converted to other forms of heat (refer Fig. 4). Accordingly, determining albedo is a fundamental assessment in evaluating the thermal performance of the Sunagoke moss green roof. In general, either in indoor or outdoor experiments, albedo was not affected by wind velocity but slightly affected by the irradiance as depicted in Fig. 9. An average albedo gap of 0.03 differentiated the model houses S3 (ave. 0.09 ±0.003) and C (ave. 0.06 ±0.003). On the other hand, the albedo of outdoor experiments was comparatively higher than indoor experiments. As the outdoor environment also provided high secondary radiation such as atmospheric and surrounding radiations, model houses reflected more radiation accordingly. In contrast, the indoor environment did not consist of such radiations, thus the albedo differences between the two environments were significant.
It is also worth to mention that in the outdoor environment, the surface roughness aspect played a key role in determining the albedo in model house C. Although model house C was purposely painted with matte black finishing reducing the albedo, the flat and smooth surface of roof plate still inevitably reflected a huge portion of the irradiance. While Gaffin et al. [18] suggested that the equivalent albedo for green roofs should be in the range of 0.7-0.85, the average albedo found in outdoor experiments were 0.25 ±0.004, 0.22 ±0.004, 0.22 ±0.006, and 0.24 ±0.001 for model houses S3, S30, G, and C, respectively. However, the results obtained in this paper were very similar to
Carex argyranthra of 0.22 ±0.007 reported by Maclvor et al. [53] in a research conducted on top of the Patrick Power Library of Saint Mary’s University.
Based on the heat balance equation (refer Eq. (1)), the proportion of each heat fraction transferred on the model houses can be determined by dividing the fractions with total radiation. Total radiation is equal to irradiance minus the reflected radiation flux as explained in Eq. (2). The results for convection and conduction heat proportions were compiled in Fig. 10 and Table III. It was noted that regardless of indoor and outdoor
experiment cases, the latent heat fluxes for all dry model houses were neglected since they were assumed minute and difficult to measure. Since the dry surfaces of model houses lack evaporation, the convection heat flux dominated the whole heat balance, thus the convection heat proportion was really close to 100% throughout the wind velocity for both experiment category. Otherwise, the heat balance will be governed by latent heat by 70% in natural convection, and 91% in forced convection, if there is presence of water as reported by Amir et al. [54].
Although the increments were insignificant and not affected by irradiance strength, the convection proportion reached a maximum and unchanged beyond 2m/s of wind velocity in the indoor environment. Also, convection heat proportion of green roof surfaces was slightly higher than that of the control roof, thus clarified that the green roofs moss allowed better cooling even in dry condition.
Convection heat proportion of model houses Sunagoke S3 and control C had a great discrepancy in a steady environment of artificial climate chamber. In contrast, the convection proportions in outdoor experiments when sorted according to wind velocity did not display major variance for model houses S3, S30, G, and C. However, all green panels dissipated heat
better than control roof especially in natural convection condition. Similar with results of convection heat transfer coefficient, the 30mm thickness Sunagoke moss did not deliver heat as well as 3mm Sunagoke moss and grass. While Sunagoke S3 utilized its thinness, grass G utilized its slenderness in delivering heat to the atmosphere.
As the by-product of heat transfer on the system after reflected and delivered to the atmosphere, the conduction heat penetrated into the interior cavity of the model house. As a result of higher proportion of convection heat on green panels, a lesser proportion of conduction heat was noticed in both cases; indoor and outdoor environments. Compared to convection heat, the proportions of conduction heat were extremely small, where in some circumstances close to 0. This happened as the interior cavity of the well-insulated model house has reached saturated state and hindered the heat penetration. Nonetheless, it can be concluded that indoor experiments can display a similar outcome with an outdoor experiment in terms of heat proportions developed on the model houses.
International Journal of Civil & Environmental Engineering IJCEE-IJENS Vol: 17 No: 06 10
C. Temperature Profile
Surface temperature is significantly dependent on the environmental condition, which has to be faced by the outermost layer of each model house. All changes of such
irradiance, convection characteristic, and wind velocity will drastically influence the fluctuation of surface temperature. Fig. 11 establishes the outermost surface and interior temperature for each of the model houses under the outdoor experimental condition, along with the ambient temperature as a reference. Most temperature fluctuations were seen during high irradiance around noon but greatly calmer at night. During day-time, even though the surface temperature of Sunagoke S30 was the second highest after control roof, the interior temperature was the lowest compared to other candidates. Thicker materials; i.e., materials with higher thermal resistance are more effective in suppressing the rise of interior temperature. Besides, the soil layer in grass green panel also provided additional aid to the temperature suppression. Despite the absence of soil, both Sunagoke moss green panels (S3 and S30) showed decent insulation effect and provided similar thermal comfort with grass. The maximum and average temperatures between 9:30 to 16:00 are outlined in Table IV.
TABLEIV
MAXIMUM AND AVERAGE TEMPERATURE OF ALL MODEL HOUSE CANDIDATES IN OUTDOOR ENVIRONMENT, ON PERIOD OF 9:30 TO 16:00
Model house
Max. surface temperature
[°C]
Ave. surface temperature
[°C]
Max. interior temperature
[°C]
Ave. interior temperature
[°C] Sunagoke
S3
48.0 (-12.0) 40.7 (-9.8) 40.4 (-8.9) 38.0 (-7.3)
Sunagoke S30
58.8 (-1.3) 48.6 (-1.9) 36.9 (-12.4) 35.0 (-10.3)
Grass G 53.8 (-6.3) 44.5 (-6.0) 38.1 (-11.2) 36.2 (-9.1) Control C 60.1 50.5 49.3 45.3
* value in bracket is difference with control model house C
Fig. 11. Surface and interior temperature profile in outdoor environment.
Since the ambient temperature and irradiance strength were a constant in the indoor experiment, it is possible to analyse the surface and interior temperature according to wind velocity as demonstrated by Fig. 12. In natural convection, the surface temperature varied from 51.5 to 66.4 °C for model house S3 and 67.5 to 89.5 °C for control model house C. Based on Fig. 12 (a), even a small presence of wind initiated a substantial reduction in surface temperature by comparing temperature gradient for wind velocity of 0 and 1 m/s. Changing the convection phase from natural to forced convection reduced the surface temperature by 37.4 ± 4.0% for model house S3, and 36.4 ± 2.0% for control model house C. The fluctuations occurred due to irradiance intensities. However, the surface temperature reduction percentages declined with the addition of wind velocity.
The Sunagoke green panel was by far cooler than the control roof surface due to the shading effects. A report made by Niachou et al. [17] in year 2001, highlighted that in an outdoor environment (ambient temperature 28 °C and relative humidity 57%), the surface temperature of a green roof on a non-insulated building ranged from 28 to 40 °C, whereas the surface temperature of a non-insulated building was warmer, which ranged between 42 and 48 °C. In another remarkable article by Suzaki et al. [33], they confirmed the surface temperatures of Sunagoke were recorded the highest at 31 and 33 °C for a rainy and a clear day, compared to the surface temperatures of slab at 35 and 37 °C, correspondingly. As a record, the average wind velocity values for the two days were 2.7 and 2.6 m/s, respectively. In addition, results by Anderson et al. [42] demonstrated parallel discoveries where the maximum temperature of Sunagoke surface documented in August was 49.2 °C, in contrast to medium only roof at 51.0 °C. Hence, the effect of applying green roof especially the Sunagoke moss green roof was proven to give positive effect on the building, and the energy savings are certainly promising.
On the other hand, the interior temperature varied associated with the irradiance strength. For instance, the interior temperature
established in indoor experiments ranged from 38.6 to 45.8 °C and 46.2 to 56.1 °C for model houses S3 and C, respectively in natural convection as revealed in Fig. 12 (b). Later, the occurrence of forced convection heat transfer reduced the variation by 20.8 ±3.9% and 23.6 ±2.6% in the same order. There were no significant temperature reductions at wind velocity above 1.5 m/s. However, the coolest interior temperature of model house S3 was 32.5 °C, which was cooler by 4.3 °C than the control model house C. Any additional temperature drop below the ambient temperature was assumed to be impossible since the conduction heat fluxes were all in positive proportions and the heat flowed inwards the interior cavity irrespective of the condition of the model houses (refer Fig. 10). If the conduction heat flux displays any negative value, then the opposite phenomena may occur.
A stimulating study investigated by Halwatura [55] documented the indoor air temperature of a three-story house which used three type of roofs: tile, bare, and Buffalo grass green roofs. The highest indoor temperatures obtained were 34.5 °C, 35.9 °C and 32.7 °C for tile, bare, and green roofs, respectively. From the findings, the Buffalo grass green roof was able to suppress the indoor temperature at 1.8 and 3.2 °C topmost. Although the interior temperature differences between the control roof and the Sunagoke green roof in this paper were comparatively high, the results of the application of Sunagoke green roof were likely to be comparable with that of the reference, in view of an appropriate ventilation of a real building.
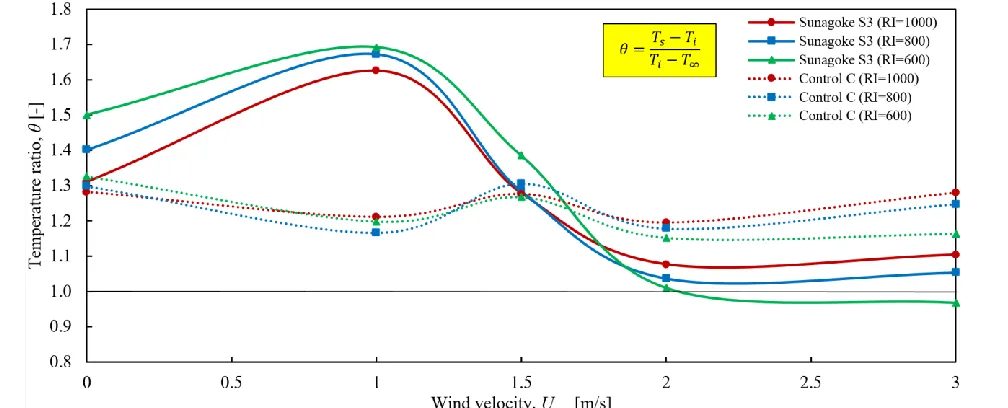
To further analyze the cooling characteristic that occurred in the model houses, a dimensionless temperature ratio was proposed to determine the normalised temperature difference. The temperature ratio was constructed by taking the differences in temperature between surface and interior temperatures, relative to differences in temperature between interior and ambient temperatures. High temperature ratio specifies more influence from the roof surface condition, affecting the rise of interior temperature. On the other hand, low ratio meant there was more
International Journal of Civil & Environmental Engineering IJCEE-IJENS Vol: 17 No: 06 12
heat transferred to the atmosphere and less heat penetration into the interior cavity.
In the indoor environment, both temperature driving forces were balanced on dry Sunagoke moss in forced convection region as the temperature ratios were close to 1, as presented in Fig. 13. Nevertheless, a dissimilar finding was seen on dry control roof where they were approximately 1.2 despite the changes of wind velocity. This signifies that the control roof tends to warm the interior cavity with the heat from the roof plate itself. Similar normalized temperature trends were seen on Sunagoke S30 in the outdoor environment as depicted in Fig. 14, which also reflected the distress to release heat as the air cavity in between Sunagoke moss leafs detained the heat. Therefore, to reduce the cooling load of a building, the heat facing roof surface needs, in the first place, to be mitigated.
Interestingly, the temperature ratios in the outdoor environment were typically steady before afternoon but starting to decrease until evening, due to the heat which mostly accumulating the interior cavity of model houses started to be released more to the atmosphere. This event may be affected by the elevation on convection heat transfer as the fact that wind velocity above 1 m/s was mostly presented after 12:00 pm.
Separately, neither Sunagoke S3 nor Control C has a good agreement with the temperature ratio results in indoor and outdoor experiments. While both temperature ratios in indoor experiments were presented above 1, the outdoor experiments displayed ratios of below 1 for both model houses cases. Different environment limitations may be the reason for this contradiction as the enclosed indoor environment easily reaches saturated state and allows an only limited degree of heat transfer from the model house, considering the heat capacity of the space inside of the Artificial Climate Chamber. Nevertheless, the outdoor environment is limitless. Still, this kind of temperature ratio may be a baseline to compare the thermal performance of other green roof plants.
IV. CONCLUSION
The findings established in both indoor and outdoor experiments clarified the effects of wind velocity and irradiance on the thermal performance of the Sunagoke moss green roof. Despite being a nearly maintenance-free green roof plant, the Sunagoke green roofs showed a decent shading in regulating the heat balance that occurred on the
roof.
Through finding the convection heat transfer characteristics, the wind velocity of beyond 2m/s can be classified as the forced convection region acting on green roofs. In outdoor experiments, the three green panels (S3, S30, and G) displayed better convection heat transfer coefficient than the control roof; however, the thinnest S3 had the best ability to release heat compared to other competitors. Meanwhile, the albedo was not affected by wind velocity but irradiance strength, noting 0.25 ±0.004, 0.22 ±0.004, 0.22 ±0.006, and 0.24 ±0.001 for model houses S3, S30, G, and C, respectively in an outdoor environment. The 30mm thickness Sunagoke moss did not deliver heat as well as 3mm Sunagoke moss and 25mm grass in terms of convection heat but the suppression of interior temperature was the most superior. Despite the absence of soil, both Sunagoke moss green panels (S3 and S30) showed decent insulation effect and provided thermal comfort comparable to grass.To some extent, results in forced convection region obtained from the indoor experiments reflected the average outdoor outcomes; for example, the ratio of Grashof number to the square of the Reynolds number, and heat proportions developed on model houses. However, there were still many outcomes from outdoor experiments which disagreed with those from indoors due to the metamorphosis of measuring environment. Nevertheless, since the environment is controllable, results from the indoor experiment can be analysed in details which might not be provided by the outdoor experiment. The outcomes discussed in this paper may contribute to the understanding of the benefit of implementing Sunagoke moss green roof to the
𝑄𝑐𝑜𝑛𝑑𝑢𝑐𝑡𝑖𝑜𝑛
𝑄𝑐𝑜𝑛𝑣𝑒𝑐𝑡𝑖𝑜𝑛 Convection heat flux [W/m2]
𝑞𝑐𝑜𝑛𝑑 Conduction heat proportion (=𝑄𝑐𝑜𝑛𝑑𝑢𝑐𝑡𝑖𝑜𝑛/
𝑅𝑛) [%]
𝑞𝑐𝑜𝑛𝑣 Convection heat proportion (=𝑄𝑐𝑜𝑛𝑣𝑒𝑐𝑡𝑖𝑜𝑛/
𝑅𝑛) [%]
𝑅𝐼 Irradiance [W/m2]
𝑅𝑅 Reflected radiation flux [W/m2] 𝑅𝑛 Total radiation flux [W/m2]
𝑅𝑒 Reynolds number [-]
𝑟𝑇 Total thermal resistance [m2K/W] 𝑟𝑛 Thermal resistance of material [m2K/W] 𝑇∞ Ambient temperature [°C]
𝑇𝑖 Model house interior cavity temperature [°C] 𝑇𝑠 Outermost surface temperature [°C]
𝑡 Measuring interval [s]
𝑈 Local wind velocity [m/s]
𝑈𝑎𝑣𝑒 Average wind velocity [m/s]
𝑣 Kinematic viscosity of fluid (=1.38 x10⁻⁵)
[m2/s]
𝛥𝑇 Temperature difference [°C]
𝛼 Albedo (=𝑅𝑅/𝑅𝐼) [-]
𝛽 Coefficient of expansion of fluid (=3.4 x10⁻³)
[1/K]
𝜃 Temperature ratio (=(𝑇𝑠− 𝑇𝑖)/(𝑇𝑖− 𝑇∞)) [-] Subscripts
𝑆3 Sunagoke moss, 3[mm] thickness
𝑆30 Sunagoke moss, 30[mm] thickness
𝐺 Grass of 25[mm] thickness, with soil layer of 5[mm] thickness
𝐶 Control roof without green panel
ACKNOWLEDGMENT
This research was supported by the Yamaguchi Prefectural Industrial Technology Institute for providing state-of-the-art infrastructures. The authors would also like to express their gratitude to Yayasan Pelajaran MARA Malaysia for providing financial support for the doctorate course and remarkable encouragement to bring this research further to the next level.
Landscape Urban Plan. 97 (2010) 147-155, DOI: 10.1016/j.landurbplan.2010.05.006.
[7] C. Aniello, K. Morgan, A. Busbey, L. Newland, Mapping micro-urban heat islands using Landsat Tm and a GIS, Comput. Geosci. 21 (1995) 965-969.
[8] J.A. Patz, D. Campbell-Lendrum, T. Holloway, J.A. Foley, Impact of regional climate change on human health, Nature 438 (2005) 310-317, DOI: 10.1038/nature04188.
[9] H. Akbari, M. Pomerantz, H. Taha, Cool surfaces and shade trees to reduce energy use and improve air quality in urban areas, Sol. Energy 70 (2001) 295-310, DOI: 10.1016/S0038-092X(00)00089-X.
[10] A.M. Arif Bijaksana, M. Sjahrul, N. Harun, R. Djamaluddin, The effects of gas emission steam power plant on the surrounding residential area, IJCEE-IJENS 12 (2012) 41-47.
[11] Suparwoko, Green open space approach to the building mass arrangement in Yogyakarta: case study of the revitalization of the Tugu Rail Station, IJCEE-IJENS 13 (2013) 1-8.
[12] J.E. Park, H. Murase, Evapotranspiration efficiency of Sunagoke moss mat for the wall greening on the building, ASABE 6 (2008) 3612-3621, DOI: 10.13031/2013.24822.
[13] N. Kawakami, H. Murase, H. Fukuda, Analysis of the transpiration properties in Sunagoke moss, Acta Hortic. 1011 (2013) 473-478, DOI: 10.17660/ActaHortic.2013.1011.60.
[14] J.A. Clements, S.A. Sherif, Thermal analysis of roof spray cooling, Int. J. Energ. Res. 22 (1998) 1337-1350, DOI: 10.1002/(SICI)1099-114X(199812)22:15<1337::AID-ER433>3.0.CO;2-G.
[15] H. Taha, Urban climates and heat islands: albedo, evapotranspiration, and anthropogenic heat, Energy Build. 25 (1997) 99-103, DOI: 10.1016/S0378-7788(96)00999-1.
[16] E.P. Del Barrio, Analysis of the green roofs cooling potential in buildings, Energy Build. 27 (1998) 179-193, DOI: 10.1016/S0378-7788(97)00029-7.
[17] A. Niachou, K. Papakonstantinou, M. Santamouris, A. Tsangrassoulis, G. Mihalakakou, Analysis of the green roof thermal properties and investigation of its energy performance, Energy Build. 331 (2001) 719-729, DOI: 10.1016/S0378-7788(01)00062-7.
[18] S.R. Gaffin, C. Rosenzweig, L. Parshall, D. Beattie, R. Berghage, G. O’Keeffe, D. Braman, Energy balance modeling applied to a comparison of green and white roof cooling efficiency, in: Proceedings of Third Annual Greening Rooftops for Sustainable Communities Conference, Awards and Trade Show, Washington, DC, 2005.
[19] N.D. VanWoert, D.B. Rowe, J.A. Andresen, C.L. Rugh, R.T. Fernandez, L. Xiao, Green roof stormwater retention, J. Environ. Qual. 34 (2004) 1036-1044,DOI: 10.2134/jeq2004.0364.
[20] S.R. Gaffin, C. Rosenzweig, L. Parshall, D. Hillel, J. Eichenbaum-Pikser, A. Greenbaum, R. Blake, R. Beattie, R. Berghage, Quantifying evaporative cooling from green roofs and comparison to other land surfaces, in: Proceedings of Forth Annual Greening Rooftops for Sustainable Communities Conference, Awards and Trade Show, Boston, 2006.
International Journal of Civil & Environmental Engineering IJCEE-IJENS Vol: 17 No: 06 14
[22] L. Bengtsson, J. Olsson, L. Grahn, Hydrological function of a thin extensive green roof in southern Sweden, Nord. Hydrol. 36 (2005) 259-268.
[23] K.L. Getter, D.B. Rowe, The role of extensive green roofs in sustainable development, Hortscience 41 (2006) 1276-1285.
[24] D.B. Rowe, M.A. Monterusso, C.L. Rugh, Assessment of heat-expanded slate and fertility requirements in green roof-substrates, Horttech. 16 (2006) 471-477.
[25] I. Misaka, H. Suzuki, A. Mizutani, N. Murano, Y. Tashiro, Evaluation of heat balance of wall greening, AIJ J. Technol. Des. 23 (2006) 233-236, DOI: 10.3130/aijt.12.233_1.
[26] J. Coma, G. Pérez, C. Solé, A. Castell, L.F. Cabeza, Thermal assessment of extensive roofs as passive tool for energy savings in buildings, Renew. Energ. 85 (2016) 1106-1115, DOI: 10.1016/j.renene.2015.07.074. [27] Y. Kikegawa, Y. Genchi, H. Kondo, K. Hanaki, Impacts of
city-block-scale countermeasures against urban heat-island phenomena upon a building’s energy-consumption for air-conditioning, Appl. Energ. 83 (2006) 649-668, DOI: 10.1016/j.apenergy.2005.06.001.
[28] E. Oberndorfer, J. Lundholm, B. Bass, R.R. Coffman, H. Doshi, N. Dunnett, S. Gaffin, M. Köhler, K.K.Y. Liu, B. Rowe, Bioscience 57 (2007) 823-833, DOI: 10.1641/B571005.
[29] J.C. Berndtsson, Green roof performance towards management of runoff water quantity and quality: A review, Ecol. Eng. 36 (2010) 351-360, DOI: 10.1016/j.ecoleng.2009.12.014.
[30] M.E. Bachawati, R. Manneh, R. Belarbi, H.E. Zakhem, Real-time temperature monitoring for traditional gravel ballasted and extensive green roofs: A Lebanese case study, Energy Build. 133 (2016) 197-205, DOI: 10.1016/j.enbuild.2016.09.056.
[31] S.M. Studlar, J. Peck, Extensive green roofs and mosses: Reflection from pilot study in Terra Alta, West Virginia, Evansia 26 (2009) 52-63, DOI: 10.1639/0747-9859-26.2.52.
[32] T. Emilsson, K. Rolf, Comparison of establishment methods for extensive green roofs in southern Sweden, Urban Forestr. Urban Green. 3 (2004) 103-111, DOI: 10.1016/j.ufug.2004.07.001.
[33] Y. Suzaki, S. Wakui, K. Iizjima, On the insulating effect and air temperature moderation by R. ericoides moss, J. Jpn. Soc. Reveget. Tech. 30 (2004) 56-61, DOI: 10.7211/jjsrt.30.56.
[34] M.R. Haferkamp, Environmental factors affecting plant productivity, in: Proceedings of Fort Keogh Research Symposium, Miles City, MT, September 1987.
[35] W. Heinze, Results of an experiment on extensive growth of vegetation on roofs, Rasen Grünflachen Begrünungen 16 (1985) 80-88.
[36] N.D. VanWoert, D.B. Rowe, J.A. Andresen, C.L. Rugh, L. Xiao, Watering regime and green roof substrate design impact Sedum plant growth, Hortscience, 40 (2005) 659-664.
[37] F. Madre, A. Vergnes, N. Machon, P. Clergeau, A comparison of 3 types of green roof as habitats for arthropods, Ecol. Eng. 57 (2013) 109-117, DOI: 10.1016/j.ecoleng.2013.04.029.
[38] D. Zirkelbach, S.-R. Mehra, K.-P. Sedlbauer, H.-M. Künzel , B. Stöckl, A hygrothermal green roof model to simulate moisture and energy performance of building components, Energy Build. 145 (2017) 79-91, DOI: 0.1016/j.enbuild.2017.04.001.
[39] M. Eksi, D.B. Rowe, I.S. Wichman, J.A. Andresen, Effect of substrate depth, vegetation type, and season on green roof thermal properties, Energy Build. 145 (2017) 174-187, DOI: 10.1016/j.enbuild.2017.04.017. [40] S.N. Ondimu, H. Murase, Thermal properties of living roof greening material by inverse modeling, Appl. Eng. Agric. 22 (2006) 435-441, DOI: 10.13031/2013.20455.
[41] S.N. Ondimu, H. Murase, Combining galerkin methods and neural network analysis to inversely determine thermal conductivity of living green roof materials, Biosyst. Eng. 96 (2007) 541-550, DOI: 10.1016/j.biosystemseng.2006.12.007.
[42] M. Anderson, J. Lambrinos, E. Schroll, The potential value of mosses for stormwater management in urban environments, Urban Ecosyst. 13 (2010) 319-332, DOI: 10.1007/s11252-010-0121-z.
[43] A. Heim, J. Lundholm, L. Philip, The impact of mosses on the growth of neighbouring vascular plants, substrate temperature and evapotranspiration on an extensive green roof, Urban Ecosyst. 17 (2014) 1119-1133, DOI: 10.1007/s11252-014-0367-y.
[44] M. Akita, M.T. Lehtonen, H. Koponen, E.M. Marttinen, J.P. Valkonen, Infection of the Sunagoke moss panels with fungal pathogens hampers
sustainable greening in urban environments, Sci. Total Environ. 409 (2011) 3166-3173, DOI: 10.1016/j.scitotenv.2011.05.009.
[45] N. Takahashi, H. Nishina, K. Takayama, S. Futagami, T. Kamura, T. Nakahara, Analysis for the effect of roof greening in warehouse by mean of simulation, Environ. Control Biol. 51 (2013) 99-103, DOI: 10.2525/ecb.51.99.
[46] S. Quezada-García, G. Espinosa-Parades, M.A. Escobedo-Izquierdo, A. Vázquez-Rodriguez, R. Vázquez-Rodriguez, J.J. Ambriz-García, Heterogeneous model for heat transfer in Green Roof Systems, Energy Build. 139 (2017) 205-213, DOI: 10.1016/j.enbuild.2017.01.015. [47] World Weather and Climate Information, Average monthly weather in
Tokyo, Japan, 2016, Retrieved from https://weather-and-
climate.com/average-monthly-Rainfall-Temperature-Sunshine,Tokyo,Japan, (accessed 12.07.17).
[48] P.C. Tabares-Velasco, J. Srebric, The role of plants in the reduction of heat flux through green roofs: laboratory experiments, ASHRAE Trans. 115 (2009) 793-802.
[49] McGraw-Hill Higher Education, Heat Transfer, 9th Edition, The McGraw-Hill Companies, Inc., New York (2002) 347-348.
[50] The Japan Society of Mechanical Engineering, JSME Data Book: Heat Transfer, 5th Edition, Maruzen Company, Limited, Tokyo (2009) 52-54. [51] A. Pianella, R.E. Clarke, N.S.G. Williams, Z. Chen, L. Aye, Steady-state and transient thermal measurements of green roof substrates, Energy Build. 131 (2016) 123-131, DOI: 10.1016/j.enbuild.2016.09.024. [52] A. Kumar, N. Barthakur, Convective heat transfer measurements of
plants in a wind tunnel, Bound.-Lay. Meteorol. 2 (1971) 218-227, DOI: 10.1007/BF00192131.
[53] J.S. Maclvor, J. Lundholm, Performance evaluation of native plants suited to extensive green roof conditions in a maritime climate, Ecol. Eng. 37 (2011) 407-417, DOI: 10.1016/j.ecoleng.2010.10.004. [54] M. Amir A. K., Y. Katoh, H. Katsurayama, M. Koganei, M. Mizunuma,
Effects of convection heat transfer on Sunagoke moss green roof: A laboratory study, Energy Build. 158 (2018) 1417-1428, DOI: 10.1016/j.enbuild.2017.11.043.
[55] R.U. Halwatura, Effect of turf roof slabs on indoor thermal performance in tropical climates: A life cycle cost approach, J. Constr. Eng. 2013 (2013) 1-10, DOI: 10.1155/2013/845158.