Volume 8, Issue 3 [March 2019] PP: 41-51
Effectiveness of Condition Monitoring on Screw Compressors
Jim Townsend, Ph.D.
Rotating Equipment Technical Authority-Marathon Oil Corporation-Houston, TX U.S.A.
ABSTRACT:
Purpose –In recent years, screw compressors have seen a large increase in popularity particularly in compressed air and refrigeration service. Screw compressors are positive displacement compressors that utilize a pair of helical lobed rotors in a casing. The screw compressor has no valves;therefore, the location of the suction and discharge ports determines the compressor cycle. This study focuses on the condition monitoring of a screw compressor in instrument air service. Condition monitoring through vibration analysis and oil analysis are heavily relied upon in industry to determine maintenance requirements. This paper examines each technology’s ability to provide advanced notification of mechanical faults in screw compressors.Design/methodology/approach – The research analyzes the ability of vibration analysis and oil analysis on a screw compressor in an oil and gas plant. The vibration data and oil data were collected from commissioning thru failure. The data is presented to demonstrate each technology’s ability to provide advance warning of the failure.
Findings –The study considers utilizing condition monitoring technology to provide early screw compressor malfunction warnings. The results of the study indicate that both vibration analysis and oil analysis provide early warning of pending mechanical failures. Oil analysis was found to be more effectiveat providing advance notice.
Originality / value –The study reveals the advanced malfunction warning capabilities of implementing condition monitoring technologies in the form of vibration analysis and oil analysis on screw compressors.
Keywords – Condition monitoring, vibration analysis, oil analysis, screw compressor, particle count,
contamination code, overall vibration
--- --- Date of Submission: 20-10-2019 Date of acceptance:03-11-2019 --- ---
I.
INTRODUCTION
An estimated 17% of the world‘s electrical power generated is consumed by compressors used ina combination of industrial, commercial, and domestic applicationsthe current world compressor production rate is in excess of 200 million units per year with themajority of these being the positive displacement type. Compressed air and refrigeration systems account for most of the manufactured units (Stosic, 2004).In a study conducted by Eti et al. (2006), it was reported that even the world‘s best performing organizations within the petrochemical industry still incur annual maintenance costs of up to 2% of the present replacement values of their plant assets. As screw compressors continue to gain acceptance, they will be utilized in more critical processes throughout production facilities. The increased reliance on screw compressors will require a high level of reliability to meet production demands.
Maintenance strategies that are commonly used in industry can be classified into the following three categories: corrective maintenance, preventive maintenance and conditionbasedmaintenance (CBM) (Bevilacqua and Braglia, 2000).Corrective maintenance takes action only when an asset breaks down. Preventive maintenance performs inspections, replacement and overhauls on a schedule based on historical failure rates.CBM schedules maintenance work based on the results from condition monitoring technologies. It is crucial to determine the optimal condition monitoring techniques to utilize in order to effectively schedule maintenance activities. CBM of compressors relies heavily on vibration analysis and oil analysis technologies to be implemented effectively. Vibration analysis is a tested and proven technology that continuously improves due to processing speed improvements, which in turn, speed up the data collection process. Oil analysis is a well-established technology that is often reserved for large turbomachinery generally requiring outsourcing to a third party laboratory for analysis.
Condition Monitoring
machine immediately. Otherwise, operators can decideto continue operating the machinery under faulty conditions until the end of the predicted remaining useful life (Ruiz-Carcel et al., 2016). Therefore, CBM allows maintenance work to be scheduled on an as needed basis, an attractive alternative to traditional strategies.
Condition monitoring assesses the compressor‘s health by analyzing parameters such asvibration, flow rate, indicated horsepower, motor amperage, temperatures, pressures, lubrication and wear debris analysis(Townsend and Badar, 2018).Despite the significance of the achievements recorded using each of these condition monitoring techniques, vibration analysis of rotatingmachines isthe most prevalent in terms of applicability and popularity. This is due to its ability to providereasonable lead time to the failure for most rotating machines (Yunusa-Kaltungo andSinha, 2014;Yunusa-Kaltungo et al., 2014). Condition monitoring has evolved over time with practitioner experience. For instance, Galar et al. (2010) realized that the existing rules for rotating machine maintenance intervalsprovided by original equipment manufacturers are often static and do not necessarilyreflect age and operational context of the machine which sometimes trigger unnecessarymaintenance interventions.
Rotating equipment is made up ofcountless parts in which relative motion is transferred from one moving part to another generatingsignificant sound and vibration. According to the principles of mechanisms, each moving part in the machine has an individual vibration signal. The signal changes along with the change in the state of machine parts, the change in the vibration signal is an indication of fault in the machines incipient stage that can be detected and repaired before failure. The main application of condition monitoring is data collection and evaluation to identify changes in performance. The main advantage of condition monitoring is to detect the condition of machine components by utilizing selected measurements to identify the changes in operating condition as depicted below (KiranKumar et al., 2018).
Condition monitoring gives warnings before final failure. Condition monitoring gives the nature of failure and information. Condition monitoring manages the machine life potential. Condition monitoring evaluates corrective action.
Condition monitoring improves maintenance efficiency and reduces risk and saving money.
CBM is advantageous to plants as machine faults can be detected before failure occurs, without doing regular scheduled maintenance. This maintenance philosophy requires regular and frequent monitoring of the machine operating condition. Practices such as vibration analysis, infrared thermography, ultrasound and various other forms of non-destructive testing can be used to detect deterioration of machine operating condition and problems in the components before they fail and require a plant shut down. Usually critical plant equipment undergo this form of philosophy because it helps in reducing downtime, detecting root cause of the failure and managing resources such as labor and spare parts effectively. A proactive maintenance philosophy is the best way to manage and maintain the components and equipment in a plant, but only if used effectively and in required places, otherwise it can get very expensive. It is important to find defects with the equipment before failure to avoid affecting the condition of equipment components and further damage to the plant (Senapaty and Rao, 2018).
Screw Compressors
The release of API Standard 619 1st Edition – Rotary Type Positive Displacement Compressors for General Refinery Services in 1975 lead to the widespread recognition of screw compressors. According to the standard,―Screw compressorsfind use in many chemical services. Mostsignificantly, they are employed where no othercompressor will work or is economic. They toleratemore abuse than any other comparable unit. On lowmolecular weight, they enjoy the same benefit asreciprocating compressors since the significance oflow density is not detrimental as in the case withcentrifugal compressors‖(API, 1975).Due to increased usage in recent years, screw compressors have effectively displaced reciprocating compressors in the medium displacements and are now the most popular compressor type in their size range. With the inception of larger displacement screws, they are intruding further on the lower end of the centrifugal sizes(Pillis, 1999).
efficiency in multipleindustries.However, the main reasons for unscheduled shutdowns of screw compressors are bearing issues and seal problems(Davidson &Bertele, 2000).
Screw compressors are positive displacement equipment that utilize a pair of intermeshing rotors as opposed to a piston to produce compression. The rotors consist of helical lobes affixed to a shaft. One rotor is referred as the male rotor and will usually consist of four lobes. The other rotor is referred as the female rotor and consists of flutes that match thecurvature of the male lobes. Female rotors typically have six valleys. For everyone revolution of the male rotor, the female rotor only turns through 240 degrees of rotation. Since the male rotor is the driven shaft, it is commonly referred to as four compression cycles per rotation (Smith, 2012).
The suction gas becomes trapped between two helically shapedcylinders created by the rotor screw threads and the casing as thethreads rotate away from the open suction port.The total displacement is thevolume at suction per thread times the number of lobes on thedriving rotor.The male rotor lobe will start to enter the trapped gas in the female rotor fluteon the bottom of the compressor at the suction end, creating theback edge of the trapped gas pocket.Further rotation will reduce thetrapped volume and compress the trapped gas.Thescrew compressor has no valves, the discharge port location determines when compression is over. The volumeof gas remaining in the trapped pocket at the dischargeport opening is defined as the discharge volume.The gas then flows out through this port at approximately constant pressure(Stosic, 2004).
The majority of screw compressors designed today use oil injection into the compression area for lubrication, sealing of leakage paths, and cooling. The quantities of injected oil are approximately 10 to 20 gal/min per 100 hp (Pillis, 1999). The large oil quantities transfers most of the heat of compression to the oil and allows discharge temperatures to be low even at high compression ratios(Pillis, 1999). Oil injection performs useful functions in the screw compressor; however, since oil is introduced in otherparts of the process, oil flooded screw compressors need oil separators.Since the majority of the heat of compression is transferred to the oil during compression, an oil cooling system is needed remove this heat(Pillis, 1999).
Consequently, without the cooling of the gas by the oil during the compression process, the same temperature rise limitations as a centrifugal compressor apply to a dry screw compressor.The same oil is used for the lubrication of bearings and for the injection inside the machine(Almasi, 2015).Oil flooded screw compressors feature a pressurized reservoir and a gas/oil separator. The separator is a specialized component that usually includes proprietary internal design features to remove the oil entrained in the process gas stream prior to final process gas discharge from the package (API, 2010).The main objective of an oilflooded rotary screw compressor is to reduce the gas discharge temperature to a value less than 160°F or to limit the observed temperature rise to 100°F. This type of operation extends the volume and pressure capabilities while extending the service life of the compressor and its lubricant (Schell and Dreksler, 1976).
In one sense, the clearances in oil injected machines are easier to manage than in oil free machines as temperatures are normally kept within significantly lower limits. However, the absence of timing gears and the direct rotor to rotor drive does add more complexity to clearance analysis. Rotor contact is necessary for one rotor to drive the other; the objective is to precisely control where it is possible for contact to occur. The best practice for direct drive clearance design safeguards only rolling contact at the pitch radius of each rotor as offered by Stosic et al. (2005). Deviations from nominal design clearances, whether due to manufacturing and assembly tolerances or due to operational distortions, can cause a shift in the relative rotation between the male and femalerotors which further distorts the interlobe clearance distribution and must be considered in clearance evaluation for direct drive, oil injected compressors (Sauls et al., 2007).
The advantages of an oil flooded screw compressor compared to other compressor types are summarized as follows (Almasi, 2015; Bloch &Geitner, 2012; Brown, 2005; Davidson &Bertele, 2000; API, 2010; Forsthoffer, 2011):
considerably reduced sensitivity to gascomposition and gas molecular weight change capability of accepting more liquid andentrainments than other compressors
a lower cost a higher efficiency less maintenance good availability
small size and a very compact package concept
capable of providing up to 40 Bar(g) discharge pressure
timing gears are not needed. The oil-flooded screw compressors are simpler and more robust. because of the oil injection, a higher compression ratio can be achieved without cooling.
configured such that they have a negligibleclearance volume, and leakage paths that decrease in size as compression proceeds.Thus, provided that the running clearances between the rotors and theirhousing are small, they can maintain high volumetric and adiabatic efficiencies over a largerange of operating pressures and flows. Specialized machine tools enable the most complexrotor shapes to be manufactured with tolerances of 5 μm or less at an economicalcost (Stosic, 2004).
The following is a listof oil flooded screw compressor features(Smith, 2012). Oil is injected into the gas stream for lubricating, cooling, and sealing.
The internal clearances between both the rotors themselves and between the rotors and case are larger because the oil forms a seal.
The operating speeds are normally lower because the compressors are more efficient due to less blow-by. The pressure ratios and discharge pressures are considerably higher than the dry screw compressors. Power consumption is typically greater than dry compressors due to the large quantity of oil moving
through the system.
Vibration Analysis
Bearing engineers normally use fatigue as the failure mode withthe assumption that the bearings are properly installed, operated and maintained as intended. Today, due to advancements in manufacturing technology and materials, bearing fatigue life is no longer the limiting factor and is responsible for less than 3% of failures in service.Unfortunately,bearings fail prematurely while in servicedue to contamination, poor lubrication, temperature extremes, poorfitment, mass unbalance and misalignment. Allthese factors cause an increase in bearing vibration. As a result, condition monitoring has been used for many years to detect degradingbearings before they catastrophically fail,resulting in associated downtime costs orsignificant damage to other parts of themachine (Lacey, 2007).
Vibration analysis is typically recognized as the best method for monitoring bearing condition. It is very effective with antifriction bearings, providing an indication of bearing deterioration in theearly stages (Pillis, 1999). Defects in the rolling element bearings create a series of impacts which repeat periodically at a rate known as bearing defect frequencies (Saruhan et al., 2014). Vibrationmonitoring is now an established part ofmost planned maintenance regimes and relies on the known predictablevibration signatures which rolling bearingsgenerate as the rolling surfaces degrade.However, in most applications, bearingvibration cannot be measured directlyas the bearing vibration signature ismodified by the machine structure.Trend analysis requires plotting the vibrationlevel as a function of time in order to predict when the machine needs to be takenout of service for repair (Lacey, 2007).
One of the milestones of modern era vibration analysis was the publication in 1939 by T.C. Rathbone titled ―Vibration Tolerance‖ in Power Plant Engineering. The paper included a severity chart to provide guidelines for judging the condition of rotating machinery based on its vibration level (Mitchell, 1999). Vibration analysis is a fundamental tool for condition monitoring that is performed using advanced electronic components such as transducers, computers and software. The two main components of vibration analysis are first separation of individual component signals and noise minimization, second is to find the defective components. In vibration monitoring, the widely used techniques are time domain analysis, frequency domain analysis and time-frequency domain analysis for determining fault and critical operation condition (KiranKumar et al., 2018).
The overall vibration level is the simplest way of measuringvibration and usually consists of measuring the root mean square (RMS) vibration of the bearing housingor other point on the compressor with thetransducer located as close as possible to the bearing.This method involves measuring thevibration frequency over a wide range, forexample 10-1,000 Hz or 10-10,000 Hz. Themeasurements are trended over time and compared with known levels of vibrationallowing alarm level development toindicate a change in the machine operating condition.Alternatively, measurements can becompared with general industry standards. Althoughthis method represents a quick and low-costmethod of vibration monitoring, it isless sensitive to incipient defects (i.e.detectsdefects in the advanced condition) andhas a limited diagnostic capability. In addition, it is easily influenced by other sourcesof vibration, such as unbalance,misalignment, looseness, electromagneticvibration etc. (Lacey, 2007).
Oil Analysis
is a veryeffective method for monitoring the state of technical systems, which ensuresearly warning signals of potential problems that could lead to failureand break down of technical systems (Sreten, 2012).
Using oil analysis for compressor oils has several benefits:reduction of unscheduleddowntime, improvement ofreliability,in organizing effectiveness of maintenance schedules, life extension, optimization of oil change intervals and reduction of costof maintenance.Data acquisition is extremely difficult on equipment condition for parts, which cannot be observed due to their position. In these cases, oilanalysis enables a continuous equipment condition monitoring and a timelyresponse in order to prevent undesirable prolonged halts.The wear mechanism of a lubrication system consists ofcontact surface wear and lubricant consumption. If there is contact surface wear, then wear particles are present. Regardless of the availabilityof numerous methods for diagnosing the physicochemical changesof lubricants, in order to create an accurate picture of the condition of lubricantsfrom the system, it is necessary to obtain a representative sample and therefore extremelyimportant to obtain the sample in a proper way (Sreten, 2012).
Every sample needs to be accompanied by substantial documentation containing allrelevant data, such as user name, lubricant name, sample label, date ofsampling, date of sample delivery, type of device, lubricant quantity in thesystem, oil change date, refill data, number of operating hours, operatingtemperature, reasons for sample and any other informationthat could be of use for better understanding of the problemin question and the final interpretation of the obtained analysis results (Sreten, 2012).Factors such as addingor changing oil, filter changes and sampling techniques can distort the results.Standardized analytical methods to determine the typical condition monitoring parameters associated with lubricant quality have been established by the American Society for Testing and Materials (ASTM). The following tests are most frequently used in conditionmonitoring (Sreten, 2012):
Spectrometric Analysis (wear metals) Analytical Ferrography
Rotrode Filter Spectroscopy Infrared Analysis
Viscosity Acid Number Base Number Karl Fischer (water)
Particle Count (contamination code)
Oil analysis is a critical component of any compressor maintenance program. It is important to monitor for water content (Karl Fischer test) and viscosity change over time, which indicate oil breakdown or dilution. Excessive amounts of water can damage compressors if permitted to remain in the system. Wear metals analysismay detect some problems, but usually indicates problems rather late in the failure cycle. Thequality of the lubricating oil is easily affected by temperature,moisture, contaminants, etc. Once the lubricating oil is pollutedby water or solid particles, its lubricating property will deteriorate, which may lead to the abnormal wear of bearings and even burntbearings. Erosion will also occur on the surface of a bearing ifthe bearing works in lubricating oil with an overly high moisturecontent for a long period of time.
In the lubrication analysis field, condition monitoring is generallyused to describe analyses of in-service lubricants performed to provide an indication of the quality of a particular fluidto operate in its designed function. These analyses normally includemeasurements of oil viscosity, wear metals, particle count, acidnumber, base number, water, soot, nitration,sulfation, glycol contamination, oxidation, additive depletion,or gasoline contamination, etc. Such information canbe associated with engine, machinery, and component failures andensures that lubricants are changed only when required, customarilywhen a critical parameter is out of specification.In compressormechanical systems, wear metals and acid number are crucial, especially in relationto bearing wear and corrosion (Van De Voort and Sedman, 2006).
The purpose of lubrication oil condition monitoring is to decide whether the oil has deteriorated to the point that it no longer fulfills its protective function and to offer early warning of the possibility of total failure. As stated by Sharman and Gandhi (2008), the key function of lubrication oil is to create a continuous film between surfaces in relative motion to decrease friction and eliminate wear, and thereby, eliminate seizure of the contacting parts. The secondary function is to cool the moving parts, protect metal surfaces fromcorrosion, flush away or eliminate ingress of contaminants and keep the mating component free of deposits.
oil analysis is machine condition assessment by wear debris measurement. This is commonly performed through spectrographic analysis, which reports metals in parts per million. The proper use of oil analysis can easily result in extended oil change intervals by a factor of three or more(Johnson and Spurlock, 2009).
Wear metal monitoring originated in the 1960s to complement lube quality and contamination monitoring. This approach began by U.S. commercial railroads in the late 1940s, but was typically restricted to this single application for over a decade because analyses were performed with bench testing by chemists, one metal at a time (Poley, 2007).According to Karanoviet al. (2018),there are four primary sources for solid particle contamination: contaminated new oil,built-in contamination, contamination ingression and internally generated contamination. Particle counting is normally thought of as a tool for determining overall cleanliness and contamination in used oil. However, particle count values can be also used to assist in the detection of wear debris in a sump.The particle count test is used as a primary test for the identification of particle contamination. Atmospheric particles accumulate in the oil through normal thermal cycles, through routine topupactivities and from containers used to transport and storethe lubricants. A correlation exists between the concentrationof atmospheric particles (much of which are harderthan the machine steel surfaces) and component wear. Theresulting wear creates additional wear and causes oil healthto decline, creating a self-perpetuating escalation (Johnson and Spurlock, 2009).
The number of solid particles over different sizes are counted, which can help in evaluating the contamination level of lubricating oil according to the ISO 4406 standard (Xu et al., 2016). The purpose of the ISO 4406 contamination code is to simplify the reporting of particle count data by converting the numbers of particles into broad classes or codes, where an increase in one code is generally a doubling of the contamination level. The code for contamination levels using automatic particle counters comprises three scale numbers that permit the differentiation of the dimension and the distribution of the particles. The first scale number indicates the number of particles equal to or larger than 4 μm per milliliter of fluid. The second scale number indicates the number of particles equal to or larger than 6 μm per milliliter of fluid. The third scale number indicates the number of particles equal to or larger than 14 μm per milliliter of fluid (ISO, 2017).
II.
METHODOLOGY
This investigation focuses on an instrument air compressor in an oil and gas plant. The unit is a 300 HP motor operating at 1,787 RPM direct coupled to an oil flooded screw compressor.There are six lobes on the driven male rotor and four lobes on the female rotor. There are back to back anti friction tapered roller thrust bearings on the non-drive end (NDE) of the rotors and single anti friction roller bearings on the drive end (DE) of the rotors. The compressor has an ISO 68 viscosity grade oil with dual oil filters which allow for replacement based on differential pressure without shutting down the unit. The objective of the case study was to determine which condition monitoring technology, vibration analysis or oil analysis, is the most effective at predicting a fault in screw compressor operating condition.
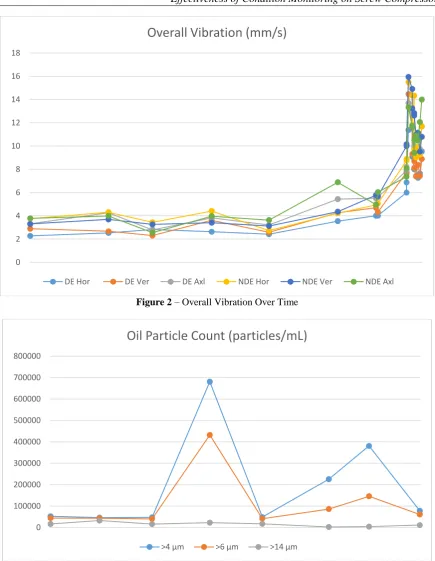
Periodic route-based vibration data is collected on a monthly basis by a ISO18436 Category II certified analyst. Data is collected on the DE and NDE of the compressor in the horizontal, vertical and axial measurement planes. Spectral and time waveform analysis are performed along with overall trending to determine the operating condition of the compressor.The overall values are collected as velocity units of measurement (mm/sec RMS) and based on an Fmax of 2,000 Hz and 12,800 lines of resolution.The API 619 overall vibration limits for oil flooded screwcompressors with rolling element bearings measured on a machine case is<8.0 mm/sec RMS. The vibration analysis results dictate any corrective maintenance activities that may be required. Typical faults identified include misalignment, bearing defects, soft foot, etc.
Periodic oil samples are collected on a monthly basis downstream of the lube oil pump and upstream of the filter. Only trained personnel familiar with the proper sampling methods collect the samples to ensure continuity between samples. The samples are transportedto a third-party laboratory with ISO 17025 accreditation to perform oil analysis. The samples are analyzed for viscosity, acid number, water content,wear metals, additive metals and particle count. The acceptable ISO4406 contamination code is 18/16/13 based on industry recognized and generally accepted good engineering practices for compressor oil. The analysis results dictate maintenance activities that may be required such as oil changes and bearing inspections.
III.
RESULTS
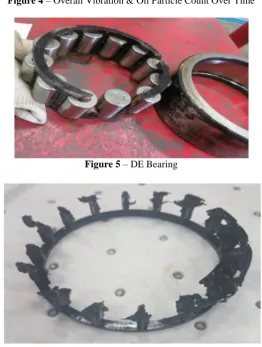
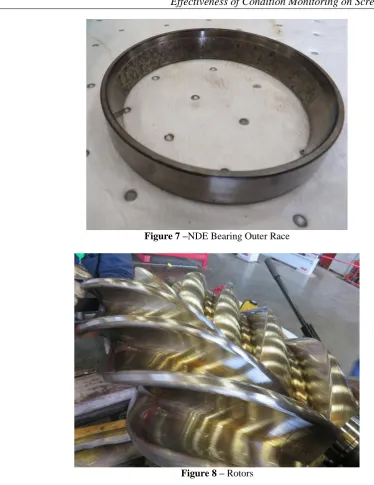
had already began to increase. The vibration levels eventually began to increase after 148 days of operation. The overall vibration levels reached 15.9 mm/sec RMS at the NDE bearings in both the horizontal and vertical measurement planes.The compressor failed after 192 days of operation. The point of failure was a NDE bearing with a broken cage, spalling on the rollers and fretting on the outer race.A root cause failure investigation later determined the root cause to be operating outside of the designed operating conditions due to improper process valve position. See figures5 thru 7 for pictures of the failedbearings.The rotors showed signs of contact which presumably occurred after the bearings failed and no longer maintained the position of the rotors. See figure 8for a picture of the rotors.
IV.
CONCLUSION
The oil analysis indicated an increasedparticle count indicating a fault after 70 days of operation. The vibration analysis measured as overall velocity detected a fault after 148 day of operation. The oil analysis condition monitoring technology was able to detect the bearing fault 53% (78 days) earlier than the overall vibration analysis. This is counterintuitive based on the widespread industry acceptance of vibration analysis as the superior condition monitoring technology. Vibration analysis is superior to oil analysis in its ability to detail the specific source of pending failure (inner race, outer race, ball spin, ball pass, cage). However, the less specific alert provided by oil analysis was received much earlier.
It can be deduced that the wear metals collected downstream of the pump and upstream of the filter must be originating from the bearings. The only wear metals found in the oil analysis was iron at 21 ppm which is indicative of a bearing fault. The specific bearing failure mode (inner race, outer race, ball spin, ball pass or cage) is irrelevant as the bearings will need to be replaced regardless of the fault. This should encourage condition monitoring practitioners to place more importance on the results of their oil analysis.In comparison with vibration condition monitoring technologies, lubrication oil condition monitoring provides approximately 2 times earlier warnings for machine malfunction and failure.
FIGURES
Figure 2 – Overall Vibration Over Time
Figure 3 – Oil Particle Count Over Time 0
2 4 6 8 10 12 14 16 18
Overall Vibration (mm/s)
DE Hor DE Ver DE Axl NDE Hor NDE Ver NDE Axl
0 100000 200000 300000 400000 500000 600000 700000 800000
Oil Particle Count (particles/mL)
Figure 4 – Overall Vibration & Oil Particle Count Over Time
Figure 5 – DE Bearing
Figure 6 – NDE Bearing Cage
0 100000 200000 300000 400000 500000 600000 700000
0 2 4 6 8 10 12 14 16 18
p
article
s/m
L
m
m
/s
ec
Ov
era
ll
Axis Title
Overall Vibration & Oil Particle Count
DE Hor DE Ver DE Axl NDE Hor NDE Ver
Figure 7 –NDE Bearing Outer Race
Figure 8 – Rotors
REFERENCES
[1]. Almasi, A. (2015) Modern oil-flooded screw compressorsfor new unconventional gas developments,Australian Journal of Mechanical Engineering, Vol. 13 No. 1, pp. 55-66
[2]. American Petroleum Institute (2010) API 619:Rotary-type Positive Displacement Compressor for Petroleum, Petrochemical and Natural Gas Industries, 5th edition, Washington DC, USA.
[3]. American Petroleum Institute (1975) API 619: Rotary-type Positive Displacement Compressor for Petroleum, Petrochemical and Natural Gas Industries, 1st edition, Washington DC, USA.
[4]. Bevilacqua, M. and Braglia, M. (2000) ‗The analytic hierarchy process applied to maintenance strategy selection‘,Reliability Engineering &System Safety,Vol. 70 No. 1,pp. 71–83
[5]. Bloch, H. and Geitner, F. (2012) Compressors: How to Achieve High Reliability & Availability, McGraw-Hill, USA. [6]. Brown, R. (2005) Compressors Selection and Sizing, 3rd edition, Gulf Publishing Company, Houston, USA, pp. 120-220
[7]. Davidson, J. and Bertele, O. (2000) Process Fan and Compressor Selection, Mechanical EngineeringPublications Limited, London, UK, pp. 112-145
[8]. Eti, M., Ogaji, S. and Probert, S. (2006), ‗Reducing the cost of preventive maintenance (PM) through adopting a proactive reliability-focused culture‘, Applied Energy, Vol. 83 No. 11,
[9]. pp. 1235-1248
[10]. Forsthoffer, W. (2011) Forsthoffer‘s Best Practice Handbook for Rotating Machinery, 1st edition, Elsevier,Oxford, UK.
[11]. Galar, D., Pilar, L. and Luis, B. (2010), ‗Application of dynamic benchmarking of rotating machinery for e-maintenance‘, International Journal of System Assurance Engineering and Management, Vol. 1 No. 3, pp. 246-262
[12]. International Organization for Standards (2017) ISO 4406,Hydraulic fluid power — Fluids — Method for coding the level of contamination by solid particles. Geneva.
[14]. International Organization for Standards(2012) ISO 18436, Condition monitoring and diagnostics of machines – Requirements for qualification and assessment of personnel. Geneva
[15]. Johnson, M. and Spurlock, M. (2009). ‗Strategic Oil Analysis: Systems, tools and tactics‘, Tribology & Lubrication Technology,April,pp 29-33
[16]. Kadarno, P., Taha, Z., Dirgantara, T. and Mitsui, K.(2008) ‗Vibration analysis of defect ball bearing using finite element model simulation‘, Proceedings of the 9th Asia Pacific Industrial Engineering & Management System Conference, Bali, Indonesia, pp. 2832-2840
[17]. Karanovic, V., Jocanovic, M., Wakiru, J. and Orosnjak, M. (2018). ‗Benefits of lubricant oil analysis for maintenance decision support: a case study‘,Institute of Physics Conference Series: Materials Science and Engineering, Vol. 393
[18]. KiranKumar, M., Lokesha, M., Kumar, S. and Kumar, A. (2018) ‗Review on Condition Monitoring of Bearings using vibration analysis techniques‘,Institute of Physics Conference Series: Materials Science and Engineering, Vol. 376
[19]. Lacey, S. (2007) ‗Using vibration analysis to detect early failure of bearings‘,Insight, Vol. 49 No. 8, pp. 444-446
[20]. Mitchell J. (1999) The History of Condition Monitoring and Condition Based Maintenance, Sound and Vibration, November [21]. Pillis. J. (1999) ‗Basics of operation and application of oil flooded rotary screw compressors‘, Proceedings of the 28th
Turbomachinery Symposium, Texas A&M University, Houston TX USA,pp. 147-156. [22]. Poley, J. (2007) ‗The history of oil analysis‘,Machinery Lubrication,November, pp. 34-37
[23]. Ruiz-Carcel C., Lao L., Cao Y. and Mbab, D.(2016) ‗Canonical variate analysis for performance degradation under faulty conditions‘, Control Engineering Practice,Vol. 54,pp. 70–80
[24]. Saruhan, H., Sardemir, S., Çiçek, A. and Uygur, I. (2014) ‗Vibration Analysis of Rolling Element Bearings Defects‘, JournalofAppliedResearchandTechnology, Vol.12, pp. 384-395
[25]. Sauls, J., Powell, G. and Weathers, B. (2007) Thermal deformation effects on screw compressor rotor design, International Conference on Compressors and their Systems, London.
[26]. Schell, L. and Dreksler, M. (1976), ‗Improvements in Rating Rotary Screw Compressors‘, International Compressor Engineering Conference,Purdue University, West Lafayette IN USA, Paper 208.
[27]. Senapaty, G. and Rao, S., (2018). ‗Vibration based condition monitoring of rotating machinery‘. MATEC Web of Conferences, Vol. 144
[28]. Sharma, B. and Gandhi, O.(2008) ‗Performance evaluation and analysis of lubricating oil using parameter profile approach‘, Industrial Lubrication and Tribology, Vol. 60, No. 3, pp. 131 - 137
[29]. Smith, D. (2012), ‗Pulsation, Vibration, and Noise Issues with Wet and Dry Screw Compressors‘, Proceedings of the Forty-First Turbomachinery Symposium, Texas A&M University, Houston TXUSA, pp.170-202
[30]. Sreten, P. (2012) ‗Importance of Lubricant Analysis‘, Military Technical Courier, Vol. LX, No. 2, pp. 156-181
[31]. Stosic, N. (2004) ‗Screw Compressors in Refrigeration and Air Conditioning‘, HVAC&R Research Journal, Vol. 10 No. 3, pp. 233-263
[32]. Stosic, N., Smith, I. and Kovacevic, A.(2005) ‗Screw Compressors, Mathematical Modelling and Performance Calculation‘, Springer, New York
[33]. Townsend, J. and Badar, M. (2018) ‗Impact of condition monitoring on reciprocating compressor efficiency‘, Journal of Quality in Maintenance Engineering, Vol. 24 No. 4, pp. 529-543
[34]. Van De Voort, F. and Sedman, J. (2006) ‗FTIR Condition Monitoring of In-Service Lubricants: Ongoing Development‘,Tribology Transactions, Vol. 49 No. 3, pp. 410-18
[35]. Veldman J, Klingenberg W. and Wortmann H. (2011) ‗Managing condition-based maintenance technology‘,Journal of Quality in Maintenance Engineering, Vol. 17,pp. 40–62
[36]. Xu, X., Yan,X., Sheng,C., Yuan, C. and Song, B. (2016). ‗Non-destructive online condition monitoring and trend prediction of lubricating oil in a steam turbine‘,Insight, Vol. 58, No. 12, pp. 649-655
[37]. Yunusa-Kaltungo, A. and Sinha, J.K. (2014), ‗Combined bispectrum and trispectrum for faultsdiagnosis in rotating machines‘, Proceedings of the Institution of Mechanical Engineers, Part O:Journal of Risk and Reliability, Vol. 228 No. 4, pp. 419-428 [38]. Yunusa-Kaltungo, A., Sinha, J.K. and Elbhbah, K. (2014), ‗An improved data fusion technique for faults diagnosis in rotating
machines‘, Measurement, Vol. 58, pp. 27-32
[39]. Zhu1, J., Yoon, J., He, D., Qu, Y. and Bechhoefer, E. (2013) ‗Lubrication Oil Condition Monitoring and Remaining Useful Life Prediction with Particle Filtering‘. International Journal of Prognostics and Health Management. Vol 4. No. 2