Abstract—Adsorption properties of silica gel have been attributed to the surface hydroxyl groups of silica gel. Some hydroxyl groups are free standing and called free silanol groups. Some are hydrogen bonded to neighbouring silanol groups. Christy has shown that a high silanol number and a balanced concentration proportionality between these two different types of hydroxyl groups is necessary for effective adsorption of water molecules.
Thermal treatment of silica gel samples alters the proportions of these groups and the above fact was investigated by using thermally treated silica gel samples. Two silica gel samples of varying surface areas and silanol numbers were dried under vacuum at 200 oC and their adsorption characteristics were followed by using NIR spectroscopy. Then the samples were subjected to heating at 350, 450, 600 degrees to cause changes in the concentrations of the surface silanol groups and their surface and adsorption characteristics were followed.
The results clearly indicate that the heating process both remove free and hydrogen bonded silanol groups and alter the ratio between the two. Furthermore, the heating causes reduction in silanol umber and upsets the balance in the proportionality of the silanol groups for effective adsorption of water molecules.
Index Terms—Silanol groups, adsorption NIR spectroscopy, second derivative profiles
I. INTRODUCTION
Silica gel is one of the important materials in chemistry. Its chemical surface characteristics have made silica gel as a starting material for the production of several different stationary phases in separation chemistry.
Chemically, amorphous silica gel is produced by the condensation polymerisation of silicic acid. During the polymerisation, the SiO groups interlink and lead to the formation of colloidal particles and become gelatinous silica gel. Some of the siloxane groups at the surface of the silica gel particles transform into hydroxyl groups. The surface hydroxyl groups are polarised and some of them form hydrogen bonds because of their proximities to each other [1-3]. These groups adsorb water molecules through hydrogen bonding. The gelatinous silica gel particles are covered by several successive layers of water molecules. The first layer is due to adsorption arising from the hydrogen bondings between silanol groups and water molecules. The other layers of water molecules build up on this first layer by intermolecular hydrogen bonding. The adsorption of water
Manuscript received February 28, 2012; revised June 12, 2012. Alfred A. Christy is with the Department of Science, Faculty of
Engineering and Science, University of Agder, 4604 Kristiansand, Norway (email: alfred.christy@uia.no).
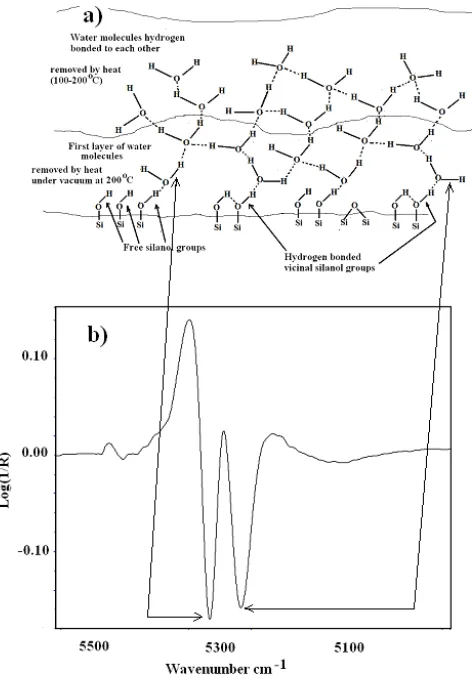
on the surface is illustrated by a model shown in Fig. 1. The nature of water molecules and the silanol groups on silica gel surface have been investigated by several authors. As mentioned earlier the silanol groups on the silica gel surface are different and they provide different environment for adsorption of water molecules.
Several different instrumentations have been used in studying the state of the water molecules on silica gel particles and related substances [4-12] and the models presented from the results of these investigations have given insight into the nature and state of the water molecules on silica gel surface. However, the interpretations and models presented in these works were not quite clear. Research into their nature and identities have been recently taken up by Christy [13, 14]. Thanks to the use of NIR spectroscopy in combination with second derivative techniques. Using these, Christy was able to show the variations in free and hydrogen bonded silanol groups with related absorptions in the NIR region of silica gel samples. The absorptions that are unique are absorptions arising from the water molecules bonded to silanol groups on the silica gel surface. These absorptions arise in the region 5200-5500 cm-1(see Fig. 1) A summary of NIR absorptions of the silica gel samples can be found elsewhere [15].
There have been a few articles published in the literature detailing the evolution of water adsorption on silica gel particles, the effect of the concentration of the free and hydrogen bonded silanol groups in hydrothermally treated silica gel samples on the adsorption of water molecules, and the state of water in naturally occurring opal minerals [13-15]. It has been shown by Christy [13] that the effect of adsorption of water on silica gel is affected by the change in the concentration of surface silanol groups and the presence of equal concentrations of free and vicinal silanol groups allows a silica gel sample to adsorb water molecules effectively. Christy [13] has proposed a model that explains the way the adsorption of water molecules take place on the surface of silica gel. Any change in the concentration of the different surface silanol groups from this equal proportion rule causes a negative adsorption effectivity of a silica gel sample. Tailoring silanol groups to attain this equal proportionality by maintaining a high silanol number in silica gel sample should increase the effectivity of water molecular adsorption.
The intention of this work is to carry out experiments on the adsorption of water on silica gel samples subjected to thermal treatment, measure their near infrared spectra and use second derivative techniques to extract the underlying features in the spectra. Furthermore, it is also the intention of this work to study the effectivity in adsorption of water by these modified silica gel samples.
Effect of Heat on the Adsorption Properties of Silica Gel
Fig. 1. A sketch showing the water molecules adsorbed onto silica gel surface (a) and the second derivative profiles of the near infrared spectrum in the
water OH combination frequency region
II. EXPERIMENTAL
A. Materials, Thermal Treatment and Adsorption
Evolution of Water on Silica Gel Surface
Two different silica gel samples (Table. 1) with different surface areas, particle sizes and pore sizes were bought from Sigma-Aldrich.
The determination of surface area of the samples used in the experiments was carried out by Brunauer, Emmett and Teller (BET) technique and the silanol numbers were determined by deuterium exchange technique. The details regarding the technique can be found elsewhere [16].
A ceramic heater (BA electric Bunsen from Electrothermal, UK) controlled by an external power supply was used in heating the samples. Samples were evacuated at 200ºC two hours before using them in the water adsorption experiments. The silica gel sample used in the above experiment was subjected to thermal treatment at 450 and 650 ºC and their water adsorption evolutions were followed by near infrared spectroscopy and gravimetry. Portions of dry samples (around 0.15g) were placed in the NIR transflectance sample cup and the adsorption of water on the surface was followed by recording the mass increase of the sample at regular time intervals by a Mettler electronic balance connected to a computer through an RS232 port for data collection. The data
collected were used to make plots showing the correlation between water adsorption and time. The balance and the NIR spectrometer used in the measurements were placed in the same room and had a relative humidity of 22% (±1).
TABLEI:SILICA GEL SAMPLES USED IN THE EXPERIMENTS Silica gel sample1 Silica gel sample 2
Surface area m2/g 402 670
Particle Size Å 35-70 63-210
Silanol number
(OH-groups/nm2) 3.1 3.0
B. Near Infrared (NIR) Measurements
The near infrared measurements were made by using a PerkinElmer Spectrum One NTS FT-NIR spectrometer (Perkin Elmer Ltd, UK) equipped with a PerkinElmer transflectance accessory and deuterated triglycine sulphate detector. Each of the thermally treated samples was cooled and placed in a sample cup (around 0.3g) with an IR transparent window. The sample cup was then placed on the transflectance accessory and allowed to equilibrate with the surrounding air. The near infrared spectra of the sample were measured at regular time intervals in the region 10,000–4000 cm−1 at a resolution of 16 cm−1. A total of 30 scans were made each time. The average spectra showing the evolution of adsorption of water on silica gel were then converted to log (1/R) and saved. The second derivative spectral profiles of the spectra were obtained by using the Perkin-Elmer spectrum software.
III. RESULTS AND DISCUSSION
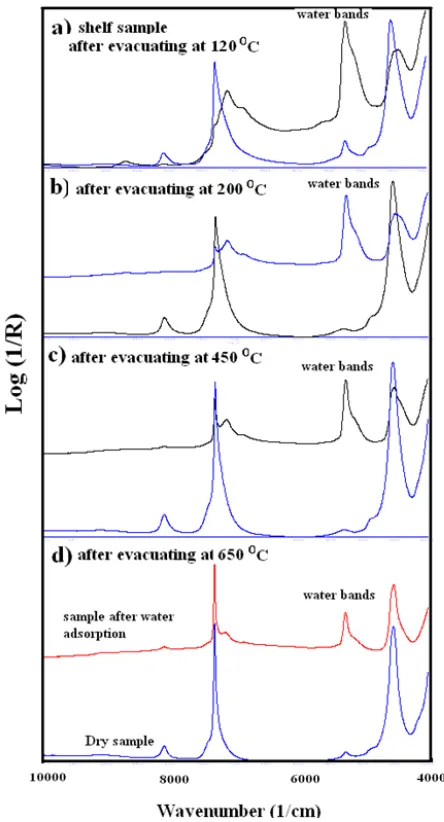
Fig. 2. Near infrared spectra of silica gel sample 2 measured on dry sample after evacuation and on the same samples after exposure to air for 60 minutes
These two bands reveal information regarding the free silanol groups and hydrogen bonded silanol groups on the silica gel surface. Therefore, attention will be given to these two bands during the discussions of NIR spectra.
The NIR spectra of one of the untreated silica gel samples (sample.2) and the NIR spectra of the samples evacuated at different temperatures as well as the spectra of the samples after exposure to air for around 60 minutes are shown in Fig. 2. All the spectra of the heated samples exhibit an asymmetric peak at 7300 cm-1. The peak is due to the absorptions arising from the overtones of the free and hydrogen bonded silanol groups. However, the peak sharpens with an increase in drying temperature from 120 to 650 oC. During the heating at 120 oC the water molecules lying over the first layer of water molecules bonded to silica gel surface disappear. These water molecules are shown in Fig.1. The layer of water molecules that are bonded to the silica gel surface is evident (in Fig. 2a) from the peak appearing at around 5250 cm-1. These water molecules disappear (The peak at 5250 cm-1 disappears) when the temperature and vacuum is high enough to break the hydrogen bondings of the water OH groups with silanol groups. The broadness of the peak at 7300 cm-1 becomes less with the removal of physically adsorbed water molecules from the surface. The spectrum in Fig. 2b shows no
absorption from the water molecules. The peak at 7300 cm-1 in Fig 2b still shows evidence of hydrogen bondings between OH groups. These OH groups can only come from the internal hydrogen bondings of the silanol groups lying close to each other on the silica gel surface.
Fig. 3. A sketch showing the dehydration and dehydroxylation of the silica gel samples
The heat treatment at higher temperatures could reveal whether there is any change taking place with these silanol groups. The spectra of the samples heated at 450 oC are shown in Fig 2c. The peak at 7300 cm-1 is narrower compared to the peak in Fig 2b. The figure also shows less water adsorption on the surface of the heated sample.
The NIR peak at 7300 cm-1 for the sample heated at 650 oC is much narrower than the peak for the sample heated at 450 oC. The adsorption of water molecules by this sample is very small compared to other heated samples. When the sample is heated to a temperature of 650 oC, the silanol groups that are engaged in hydrogen bondings condense to form siloxane bondings as shown in Fig. 3. Christy [13, 14] has shown in his previous articles on silica gel that one to one ratio between the hydrogen bonded vicinal silanol groups and free silanol groups is necessary for effective adsorption of water molecules. Heating the sample at 650 oC removes most of the vicinal OH groups and disturbs the balance between the hydrogen bonded silanol and fee silanol groups. The absence of vicinal OH groups delays the immediate adsorption of water molecules. Furthermore, the possibility for extension of hydrogen bondings does not exist.
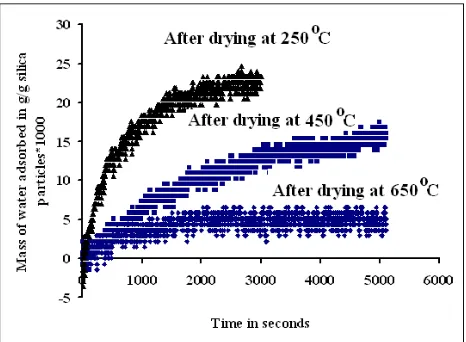
The adsorption of water molecules takes place only on the free silanol groups (Fig. 4).The amount of water adsorbed onto samples heated at different temperatures are shown in Fig. 5 for sample 2.
Fig. 4. A sketch showing the adsorption of water molecules on a sample heated at 650 oC
Fig. 5. Adsorption of water of the heated samples
The sample 1 had effective water adsorption in 70 minutes compared to the sample 2. The silanol numbers of the samples are comparable but the sample 1 has a surface area that can be considered as 60% of the area of sample 2. The only way the adsorption variation can be explained is by the ratio between the hydrogen bonded vicinal silanol groups and free silanol groups. The ratios between the peaks representing the water molecules adsorbed to vicinal silanol groups and free silanol groups are 0.81 and 1.01 for samples 1 and 2 respectively. In a previous article Christy has found that a ratio of 0.6 between the intensities of the bands representing the adsorption of water molecules by these groups gives a ratio of 1:1 between the number of vicinal silanol groups and free silanol groups and the sample lead to effective water adsorption. Furthermore, high silanol number and large surface area increase the effectiveness of water adsorption. The amounts of water adsorbed by these samples in 60 minutes are 0.044, and 0.040 gram water per gram silica gel. This illustrates the importance of the concentrations between the vicinal and free silanol groups.
Heating of the sample above 450 oC can increase the relative concentration of the free silanol groups at the expense of vicinal groups but the silanol number of the heated sample decreases and the adsorption effectivity decreases. The examples of adsorptions by the heated samples shown in Fig. 5 prove this fact.
Similarly hydrothermal treatment of the samples increase the concentration of the vicinal groups but the adsorption effectivity again decreases because of the imbalance in the ratio between free and vicinal silanol groups.
Fig. 6. Second derivative profiles of the samples in the OH combination frequency region
Fig. 7. Adsorption of water of the samples dried at 200 oC
IVCONCLUSION
The relationship between water adsorption effectiveness of the silica gel samples and the concentrations of vicinal and free silanol groups have been clearly demonstrated in this article. The adsorption of water by a silica gel sample decreases when there is an imbalance in the concentrations of vicinal and/or free silanol groups on the silica gel surface. This imbalance can be created by thermal treatment or hydrothermal treatment of the samples. In both cases the adsorption effectivity of water decreases.
REFERENCES
[1] P. Hoffman and E. Knozinger,”Novel aspects of IR Fourier spectroscopy” Surf. Sci., vol. 188, pp 181-198, 1987
[2] B.A. Morrow, I.A. Cody, and L.S.M. Lee, “Infrared studies of reaction on oxide surfaces. 7. Mechanism of the adsorption of water of dehydroxylated silica”, J.Phys. Chem., vol 80, pp 2761-2767, 1976.
[3] S. Kondo, K. Tomoi, and C. Pak, “The characterization of the Hydroxyl surface of silica gel”, Bull. Chem. Soc. Jpn., vol. 52, pp.2046-2050, 1979.
[4] K. R. Lange, “Characterization of molecular water on silica surfaces”,
J. Coll. Sci., vol. 20, pp 231-240, 1965
[5] P. A. Sermon, “Interaction of water with some silicas”, J. Chem.
Soc. Faraday, vol. I 76,pp 885-888, 1980.
[6] J. H. Anderson and K. A. Wickersheim, “Near infrared
characterization of water and hydroxyl groups on silicasurfaces”.Surf.
Sci. vol. 2, pp 251-260, 1964.
[7] M. J. D. Low and N. Ramasubramanian, “Infrared study of nature of hydroxyl groups on surface of porous glass”, J. Phys. Chem, vol. 70, no 9, pp 2740-2748, 1966.
[8] C. G. Armistead, A. J. Tyler, F. H. Hambleton, S. A. Mitchell and J. A. Hockey, “The surface hydroxylation of silica”, J. Phys. Chem. Vol. 73, no 11, pp 3947-3953, 1969.
[9] K. Klier, J. H. Shen, and A. C. Zettlemoyer, “Silica and Silicate Surfaces. I. Partially Hydrophobic Silicas”, J. Phys. Chem., vol. 77, no 11, 1973, pp 1458-1465, 1973
[10] R. P. W. Scott and S. Traiman, “Solute –solvent interactions on the surface of silica-gel. 3. Multilayer adsorption of water on the surface of silica-gel”,J. Chromatogr. Vol. 196, pp 193-205, 1980.
[11] J. Stone and G. E. Walrafen, “Overtone vibrations of OHgroups in
fused silica optical fibers”, J. Chem. Phys.. vol. 76, no 4, pp
1712-1722, 1982.
[12] S. Kondo and M. Muroya, “Surface structure of silica gel studied by dielectric dispersion”, Bull. Chem. Soc. Jpn., vol. 42, pp 1125-&, 1969.
[13] A. A. Christy, “New insights into the surface functionalities and adsorption evolution of water molecules on silica gel surface: A study by second derivative Near Infrared Spectroscopy”, Vib. Spectrosc. Vol. 54, pp 42-49, 2010.
[14] A. A. Christy, “Effect of Hydrothermal Treatment on Adsorption Properties of Silica Gel”, Ind. Eng. Chem. Res, vol. 50, no 9, pp 5543-5554, 2011.
[15] M. Bobon, A. A. Christy, D. Kluvanec, and L. Illasova, “State of water molecules and silanol groups in opal minerals:a near infrared spectroscopic study of opals from Slovakia”, Phys Chem Minerals, vol. 38, pp:809–818, 2011.
[16] A. A. Christy and P.K. Egeberg, “Quantitative determination of surface silanol groups in silicagel by deuterium exchange combined with infrared spectroscopy and chemometrics”, Analyst vol. 130, pp: 738-744, 2005.
Alfred A. Christy was born in Jaffna, Sri Lanka in 1952. He received his first degree from the then University of Ceylon, Peradeniya (1976) and his master (1987) and PhD (1990) degrees in physical chemistry from the University of Bergen, Bergen, Norway.
He assumed an infrared laboratory head position at the Department of Chemistry, University of Bergen in 1990 and from there he moved to the Department of Science at the University of Agder in 1998 to assume a professor scholarship. Now he is a Professor of Chemistry at the same place. He has authored and published more than 100 articles in peer reviewed international journals and presented more than 70 lectures at international conferences. Furthermore, he has co-authored and published a book titled “Modern Fourier Transform Infrared Spectroscopy” (Elsevier, 2001) and co-edited a book titled “Near Infrared Spectroscopy in Food Science and Technology” (Springer, 2006). He has used mostly infrared spectroscopy as the analytical technique in his postgraduate studies and in his research. He is a specialist in diffuse reflectance infrared spectroscopy. His research interests cover a wide spectrum of fields in chemistry including chromatography, reaction kinetics and material science.