Abstract—Proponents of initiatives for solid waste management require tools to assess the efficiency of their programs both environmentally and from the economic and social perspectives, and thus take the appropriate decisions to improve the performance. The objective of this study was to develop an assessment tool through a set of indicators integrated into a model that measures the effectiveness in which programs operate with solid waste management. The methodology consisted in adjusting performance indicators for waste management programs into a Driving Force-Pressure-State-Impact-Response (DPSIR) model. The most relevant indicators were chosen through a selection process that included opinions from experts, literature review based on relevance and applicability to different waste program settings. Eighteen indicators were selected and fitted into the DPSIR model. The model has indicators for causes, pressure, state, impact and response, where the status of each criterion is evaluated. This model will help decision makers optimize the performance of their waste management programs
.
Index Terms—Complex systems, indicators, program performance, waste management.
I.INTRODUCTION
The waste generation in Mexico is constantly increasing due to several factors such as growing population and industrial development, as well as changes in the consumer habits of the Mexican population with a culture that favours consumerism. This complicates an adequate management of municipal solid waste, which represents only a fraction of the total waste generated, but consume about a third of the resources invested by the public sector to abate and control pollution [1]. In Mexico as in every country, the government, the private sector and communities should establish policies, programs and joint plans involving the sound management of solid waste, to ensure sustainable development [2]. To address the problems derived from solid waste generation, the Mexican government issued the General Law for the Prevention and Comprehensive Management of Waste (LGPGIR). This Law embraces a preventive approach to achieve its objectives which are based on the application of
Manuscript received September 19, 2011, revised September 21, 2011. Adriana Puma is with the Universidad Autonoma de Baja California (UABC), Ensenada, Baja California, Mexico. (e-mail: [email protected])
Carolina Armijo is with the Universidad Autonoma de Baja California, Faculty of Engineering, Achitecture and Design. Ensenada, Baja California, Mexico. (e-mail:[email protected])
Sara Ojeda is with the Universidad Autonoma de Baja California (UABC), Institute of Engineering, Blvd.Benito Juárez and Calle de la Normal s/ n Col. Insurgentes Este.CP. 21280 Mexicali, B.C., Mexico. (e-mail: [email protected])
the principle of common but differentiated responsibility, of all social sectors that generate and manage waste.
At present the LGPGIR has two instruments to achieve proper waste management (WM): 1) WM plans, which are an ordered series of activities and operations necessary to achieve the objectives of the Law, and 2) WM programs, which are defined as instruments whose objective is to minimize the generation of waste and maximize the recovery of valuable waste [3].
In face of this challenge, diverse organizations in Mexico have implemented WM programs in settings such as schools, NGO’s, and public institutions, among others, but the net results of these programs have not been measured. Any public policy plan, program or project needs to be evaluated in order to measure its efficiency and, if necessary, modify some elements for its improvement [4]. To date, several monitoring tools that use goals and indicators have been applied to waste management [5].
Currently the use of indicators is a prerequisite for implementing the concept of sustainability since it helps in providing information that sometimes is difficult to access when working with complex system [6]. Depending on the dimension they measure, indicators are classified into systems and agencies indicators, the former measure states, flows and changes in human – environment systems, while the later focuses on the activities of an agent (organization, government, etc.) and assigns responsibilities to it. The agency is designed to function as a result of the activities of agents, which does not happen in the system [7].
A complex system comprehends all social, economic and political processes, together with its constituent parts, their interactions and interrelations with other phenomena or processes [8]. The system of urban solid waste management functions as a complex system; this is why decision makers are in need of a worldview that allows them to understand any environmental situation from a dynamic perspective. Vision is not enough if decision makers of waste management do not have the basic methodological tools enabling them to arrive at proposals and evaluations of what they are trying to solve [9].
Thus considering the many variables that comprehend a waste management system and the lack of effective evaluation tools for waste programs it is obvious to find that, in spite of the waste reduction efforts, the quantity of residues that end-up in the landfill have not decreased. This leads to questioning: Are the waste management programs in place successful? How do their promoters measure the performance of these programs? What indicators are needed to measure the performance of a WM program? Is it possible to integrate the performance indicators into a model? In an attempt to give response to the previous questions the objective of this work was to develop an instrument of
Measuring Progress of Waste Management Programs
evaluation for WM programs using a set of indicators integrated into a model.
II. METHOD
The construction of the evaluation model for Waste Management Programs (WMP) consisted of two main phases:
1) Construction and definition of indicators and,
2) Integration of the indicators into the Driving Force-Pressure-State-Impact-Response (DPSIR) model. Next, these phases are described.
2.1 Construction of indicators
The construction of indicators was carried out considering three sources of information:
a) Identification of criteria and variables described in specialized literature: More than 90 publications specialized on how to handle solid residues were studied; 21 publications were selected in which factors, criteria and variables for handling solid waste were clearly identified.
b) Variables or elements proposed by experts: For the detection of the relevant elements of a waste management system, Briones [10] proposed the use of experts' judgment, since they know details about the evolution and functioning of the system. Experts were chosen among academicians who have specialized on WM issues, authorities of the municipality that deal with WM, and members of NGO’s. The consultation with seven experts was done through a semi structured interview [11] that consisted of seven open questions aimed to detect the criteria and variables that could help to construct indicators for the evaluation of WMP. c) Opinion of WM programs’ users: A questionnaire was developed [12], [13], validated and applied to a representative sample (α=95) [13], [14] of the community of El Sauzal de Rodríguez, located North of the city of Ensenada. This community was chosen for being the target for a WM Pilot Program of the Municipality. The instrument consisted of 22 questions focused on three themes; perception, knowledge, and attitude towards waste.
d) Construction of Indicators: a list of criteria was obtained derived from the three previous phases. This list was applied to construct the WM indicators, which seek to meet the established international standards. For the construction of each indicator evaluation ranges were defined (based on relevant information related to each variable). A scale of 3 values was used, where 3 is the ideal state or maximum value and 1 the minimum or worst case.
2.2 Integration of indicators into the DPSIR model
Based on the DPSIR model (Fig. 1), a scheme was constructed in which the indicators for WM were integrated into each of the parts that compose the model.
The model has indicators for causes (driving forces), pressure, state, impact and response, where the state of each criterion is evaluated using equation (1).
State = F(x) = [(-cause) + (-pressure)] = response (1)
Fig. 1. Driving force-pressure-state-impact-response (DPSIR) model.
III. RESULTS AND DISCUSSION
As result of the analysis, 15 indicators were obtained, 13 are applicable to any WM system and two are flexible so they can be adapted to a particular WM program.
For every indicator a descriptive card was elaborated (Table I), that included name, key, target, interpretation, variable components, measurement of the variables, sources, evaluation range and formula.
TABLE I.DESCRIPTIVE CARD FOR EACH INDICATOR
Interpretation of each part
Name Indicates the service or product subject to measure Objective Defines what is to be achieved
Interpretation Is the indicator reading, points to the ideal behavior of the indicator
Variables Is the necessary information to calculate the indicator
Units Represents the way to quantify each variable Source Is the location or place where data are available
Formula Mathematical procedure to obtain the indicator value Units of result Is how to quantify the result of the formula
Range Are the maximum and minimum limits where the outcome will be located
TABLEII:INDICATORS FOR WMPROGRAMS
Criteria Key Variable
Operation cost CP Average cost per ton ($/Ton)
Social perception CS % of persons that are not satisfied with the waste management system
Handling ERS % of recoverable material collected
ER Total waste collected compared to the waste generated (%) Quality CDS Average qualification to the WM system and collection service. Final disposal DF Comply with Mexican regulation NOM083ECOL
Resources CA Coverage of the collection service
Social participation
PC % Homes that separate waste (of the total number of homes) PP % of the population eager to participate in the separation of waste CR % of comments in favor of recycling
Financial AE Financial autonomy
Recovery and treatment
ERS % of recyclable waste recovered
ER Total tones recovered compared to the total generated (%) Communication D % of persons that know the WM program
Composition CPR Composition of the Waste collected (% each category)
Each scheme integrated the relevant indicators that evaluate each part. An example of one of the seven schemes (the scheme constructed for the part of coverage of the waste collection system) is shown in Fig. 2 where the five coverage indicators are integrated.
Fig. 2. Coverage indicators fitted in the Driving Force – pressure – state – impact - response (DPSIR) model.
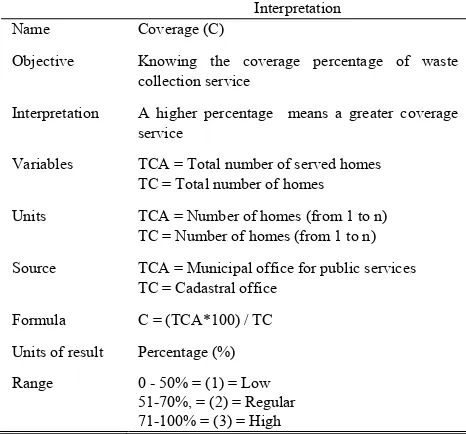
The selected indicators emerged from one or more of the sources used. For example, the criteria for coverage, generation and costs were suggested in the literature [15-18], by the experts and were also proposed by users according to the results of the questionnaires applied in this work. While the criteria of efficiency, composition and resources were recommended mainly by the experts. An example of the descriptive card of the indicator for coverage of the waste collection service is presented in Table III.
Although several authors [1], [4], [5], [7]-[10], [15]-[21], [22], [23] offer diverse evaluation tools for WM that include indicators, the criteria evaluated are not sufficient [2], and in some cases there are inconsistencies in the generation of information [2], [24], [25]. Therefore without reliable data to fill these indicators, little value can be gained, and the effectiveness of the implementation of waste management
policy and programs cannot be measured. Thus it is critical to create data bases on waste management activities and the development of a user-friendly tool [26], to start measuring waste management programs at local, provincial and national levels [2], [21] which captures the complexity of the WM system.
Several authors [4], [5], [8], [13]-[15] suggest the use of criteria for perception and social participation, even though only two of them actually use them [4], [5]. From the literature reviewed only the OCDE [4], [9] integrate the two approaches for the follow-up of waste programs, emphasizing the need to integrate social aspects into the WM systems assessment in order to have a more complete panorama of the problems generated by waste and of the variables that compose the system. This is consistent with [8] who stresses the relevance of considering, within the natural-human system studies, all the social, economic and political variables linked to the constituent parts of the system, and their interactions and interrelations a with other phenomena or processes.
TABLE III.DESCRIPTIVE CARD FOR THE COVERAGE INDICATOR
Interpretation
Name Coverage (C)
Objective Knowing the coverage percentage of waste collection service
Interpretation A higher percentage means a greater coverage service
Variables TCA = Total number of served homes TC = Total number of homes
Units TCA = Number of homes (from 1 to n) TC = Number of homes (from 1 to n)
Source TCA = Municipal office for public services TC = Cadastral office
Formula C = (TCA*100) / TC
Units of result Percentage (%)
Each proposal for WM stresses different aspects. On one hand the proposal of the OECD [10], [21] is focused on indicators for national, international and global use, which does not allow representing the real conditions at a municipality level; while [4] analyzes the elements that must be in place for municipalities’ WM good practices. This author also emphasizes the relevance to comply with coherent legal instruments and the importance to have trained personnel, financial resources and citizen participation. On the other hand the Mexican Office of Ecology in cooperation with the German Agency GTZ, propose a list of more than 100 indicators for the follow-up of WM Programs [3], nevertheless such amount of indicators is not practical in a real context. The enormous difference between one method and other, show the need to have an effective and simple tool that manages a general vision of the problem and faces the real waste problems at a local level.
In the present study the WM programs’ assessment indicators were formulated and are incumbent to the municipal governments. These indicators were based on the DPSIR model, on the literature and on the opinion of experts and users. It is important to note that this is not a simulation model; the DPSIR model and its set of indicators are useful to measure the actual performance of each of the components of an integrated waste management program. Thus it does not intend to simulate future scenarios but to bring detailed information to understand how a real WM program is actually performing. The method proposed in this work represents a grounded and a simpler way to measure the advance of a WM program by a smaller number of indicators that it uses in comparison to the other described models. The construction of indicators reported in this work considered both social and technical aspects of WM, which creates a more realistic model that is more grounded on the context where the WM program is to be implanted.
IV. CONCLUSION
Methodologies for evaluating WM programs are broadly implemented worldwide and some of these use a systems approach; nevertheless the indicators used by them do not visualize waste issues as part of social, economic and political processes. It is therefore evident the need for a user-friendly tool which captures the complexity of the WM system that considers all the relevant variables that influence waste generation and handling practices.
Although there are other tools for measuring waste management programs, the criteria used for the indicators that make up the model selected in this work are the most relevant according to WM experts. The model is made up pf integrated indicators thar offer a comprehensive overview of the WM system within a diverse range of processes with which it interacts. So it is considered that the set of indicators presented here accurately measures the state of any WM system at the local level.
REFERENCES
[1] SEMARNAT. (Mayo 2009) Indicadores Ambientales. Indicadores
Basicos del Desempeño Ambiental de Mexico.[Online],Available:
http://app1.semarnat.gob.mx/dgeia/indicadores04/04_solidos/intro_so lidos.shtml
[2] A.R. Acurio Guido, P. F. Teixeira, F. Zepeda (Enero 2011) Publicación conjunta del Banco Interamericano de Desarrollo y la Organización Panamaericana de la Salud. Diagnóstico de la situación del manejo de los residuos sólidos municipales en América Latina y Caribe, Serie
Ambiental No.18, 1998[Online], p.1-165.Available:
http://www.bvsde.ops-oms.org/acrobat/diagnost.pdf
[3] SEMARNAT. (Junio 2009). Guía para la elaboración de programas municipales para la gestión integral de residuos sólidos urbanos.
Secretaria de Ecología del Gobierno del Estado de México (SEGEM).
2006. [Online]. Available:
http://siscop.ine.gob.mx/descargas/publicaciones/guiapmpgirsu.pdf [4] A.L. Rodríguez. “Gestion local e intergubernamental de los residuos
solidos urbanos. Una evaluacion de “buenas practicas” en los municipios mexicanos,” Presentado en El Segundo encuentro de expertos sobre residuos solidos, Morelia, Michoacan.México del 27 al 30 de abril de 2009.
[5] Sartor, A. Los residuos, un componente a considerar en la sustentabilidad del sistema urbano. La complejidad de su gestión. Caso Bahía Blanca. En IV Semana Latino Americana de Calidad Urbana. Bahia Blanca Buenos Aires Argentina. 2008.
[6] C. Bockstaller, P.Girardin. How to Validate enviromental indicators. Agricultural Systems [Online]. 76. 639-653pp. 2003. Available: http://www.china-sds.org/kcxfzbg/addinfomanage/lwwk/data/kcx348. pd
[7] H. Gudmundsson. The Policy use of enviromental indicators – Learning from evaluation research. The Journal of Transdisciplinary
Enviromental Estudies. Vol 2, No.2, 2003.
[8] R. García. “Sistemas Complejos”, México: Ed. Gedisa. 2006. pp. 32,67.
[9] M. Novo. El análisis de los problemas ambientales: modelos y metodologías. El analisis interdisciplinar de la problemática
ambiental 1. Ed. Universidad-Empresa. Madrid. España.1997. pp 36 -
47.
[10] Briones, G. Medición de actitudes. In: Métodos y técnicas de
investigación para las ciencias sociales. México: Trillas. 2003, pp.
45-64.
[11] Sampieri, R. H. Recolección de datos cuantitativos. In: R. H. All.
Metodología de la investigación. México: McGrawHill. 2008, pp.
273-407.
[12] Armijo de Vega, C. Waste Management in Mexico: key variables in play The case of the Autonomous University of Baja California. Lambert Academic Publishing. Saarbrϋcken Germany.2010, p.294. [13] Cota, E. Percepción Social de la Basura en Ensenada. Tesis de maestría
en Estudios y Proyectos Sociales . Mexicali, B.C., México:
Universidad Autónoma de Baja California, UABC, 2005.
[14] Ferreras M.L, Rodíguez-Osuna J. and Nuñez A. Inferencia estadística, Niveles de precisión y diseño muestral. Revista española de
investigaciones sociológicas, ISSN 0210-5233, No.54, 1991, pp.
139-166.
[15] Wilson, D. Waste Management: An Indicator of Urban Governance.
Waste & Resources Management Consultant. 2001, p.2. Available:
www.davidcwilson.com
[16] OECD. Una guía de buenas prácticas en la cooperación para el
desarrollo. Organization for Economic Cooperation and Development.
Paris, France, 2007.
[17] AMMAC. (2008) Manual de Implementación del Sistema de Indicadores de Desempeño (SINDES), México. Pp 89
[18] SEDESOL. Sistema de evaluación y control. Secretaria de Desarrollo Social. Mexico, 2009.
[19] Rodrigues, S. (1996). Indicadores sustentables para el aprovechamiento en el manejo de residuos. Istituto Brasileiro de
Administracion muniocipal. Brasil, 1996, p.11.
[20] Cuouto, I. Evaluación de la gestión integral de residuos sólidos urbanos en la frontera norte: los casos de Juárez, Reynosa y Tijuana. Memorias
del segundo encuentro de expertos sobre residuos sólidos, Morelia,
Michoacán. México, 2009, pp.12-17.
[21] Arendse, l. and Godfrey, L. Waste Management Indicators for National State of Enviromental Reporting.The United Nations Environment
Programme (UNEP). 2010. Available:
www.unep.or.jp/ietc/kms/data/2010.pdf
[22] Buenrostro, O. La Producción de Residuos Sólidos. Ciencia y
Desarrollo en Internet. México, 2006, pp. 1-6.
[24] ISWA. "ISWA Perspective on Waste Management 2005-2010", in ISWA Annual Congres, J. Cooper, Editor. 2005, ISWA Melbourne, Australia. [Online], p. 24. Available:
http://www.iswa.org/uploads/tx_iswaknowledgebase/web_10_years_ perspective_2005_01.pdf
[25] Hintze J. (Marzo 2011).La reponzabilización desde una perspectiva extraterrestre. “Curso Virtual en Elaboracion de indicadores de productos, resultados efectos e impactos” Available: www.top.org.ar [26] Barton J., Dalley D. y Patel V. 1996. Life Cycle assessment for waste
management. Waste Management 16, 35-50.
Adriana Puma Chávez was born in Jalisco, Mexico on February 18th, 1982. Graduated on 2007, Oceanology degree, from the Faculty of Marine Sciences of the Autonomous University of Baja California, Mexico. She holds a Masters in Science degree from the Sciences Faculty, of the Autonomous University of Baja California, Mexico, 2010.
She is currently a Ph. D. Student of the Environmental and Development Ph. D. Program of the Autonomous University of Baja California, Mexico. Her publications include: “Design of an instrument for the evaluation of a household Waste program (PROMARE) in El Sauzal de Rodríguez, Ensenada”. First International Conference on Sustainable Cities. Morelia, Mich. Mexico. 2009. “Proposal for urban natural areas in Ensenada”. The innovation for a sustainable development of the Municipality of Ensenada. Ensenada, Baja California, Mexico, 2009.
Ms. Puma is a member of the Mexican Network for Environmental Management of Waste (REMEXMAR).
Carolina Armjo de Vega was born in Mexico City on October 6th, 1964. Biology degree from the Sciences
Faculty of the National Autonomous University of Mexico (UNAM). M.Sc. degree on Coastal Oceanography, Faculty of Marine Sciences, Autonomous University of Baja California, Mexico. PhD. Degree on Cleaner Production and Sustainability, Faculty of Social Sciences, Erasmus University Rotterdam, The Netherlands.
She is a researcher/professor at the Faculty of Engineering, Architecture and Design of the Autonomous University of Baja California. Her main line of research is waste management.
Sara Ojeda Benítez was born in Tijuana B.C Mexico on October 9th, 1959. Education Sciences