Novel Technique for the Handwritten Digit Image
Features Extraction for Recognition
1
Dr. U Ravi Babu and
2Dr. G Charles babu
1 Professor, Dept. of CSE, MREC(A), TS, India, [email protected] 2
Professor, Dept. of CSE, MREC(A), TS, India, [email protected]
Abstract— Thispaper proposes a novel approach for handwritten digit recognition system. The present paper extracts digit image features based on distance measure and derives an algorithm to classify the digit images. The distance measure can be performed on the thinned image. Thinning is the one of the preprocessing technique in image processing.The present paper mainly concentrated on an extraction of features from digit image for effective recognition of the numeral. The main objective of the paper is exact features are extracted for good classification results. To find the effectiveness of the proposed method, tested on MNIST database, CENPARMI, CEDAR, and newly collected data. The proposed method is implemented on more than one lakh digit images and got good comparative recognition results.The percentage of the recognition is achieved about 97.32%.
Index Term— Handwritten digit recognition, Distance measure, MNIST Database, image features.
I. INTRODUCTION
INthe field of image processing and pattern recognition [1] handwriting recognition has one of the hottest and demanding directions in the recent years.Day to day new technologies and innovative methods have been proposed continuously. With the development of the smart phone operation system, the application in handwritten recognition has aroused more and more attention from researchers.In general, handwritten character recognition is classified into two types of offline and online recognition methods [2].An optical character recognition (OCR) system with a good recognition performance needs to maintain a very high recognition rate, and at the same time, to obtain a very high reliability, or a very low error rate [3, 4]. Recent developments on classifiers and feature extraction have significantly increased the recognition accuracy of handwritten digit recognition systems.
Gorgevik et al. [5] proposed handwritten digits recognition system by using Support Vector Machines (SVM). They extracted four types of features from each digit image 1) projection histograms, 2) contour profiles, 3) ring-zones and 4) Kirsch features. They reported 97.27% recognition accuracy on National Institute of Standards and Technology (NIST) [6] handwritten digits database [7] when four types of features were used collectively. In [8] Chen et al. proposed maxmin posterior pseudo-probabilities framework for handwritten digits recognition. They extracted 256-D directional features from the input image. Finally, 256-D features were transformed into 128-D feature using Principal Component
Analysis (PCA). They reported recognition accuracy of 98.76% on NIST database [7].
A few works have also been reported in the literature on handwritten digit recognition of Indian scripts. Most of the available works on handwriting recognition of Indian scripts are based on small databases with a few basic characters and collected in laboratory environments. At present, a few large databases of handwritten digits of major Indic scripts are available from Computer Vision and Pattern Recognition Unit (CVPR), Indian Statistical Institute, Kolkata. Offline handwritten numerals database is available for Devanagari, Bangla, and Oriya scripts. Basic characters, vowel modifiers and compound characters aboutDevanagari, Bangla, and Oriya scripts are also available. Both online and offline forms of the dataset are available for research purpose. An offline version of the data is also available in the form of bi-level TIFF images, generated from the online data-using simple piecewise linear interpolation with a constant thickening factor applied. The paper considers only the Basic English numerals for recognition purpose. The dataset for the experiment was collected from different individuals of various professions in the states of Andhra Pradesh and Telangana. The proposed method overcome the disadvantages of various techniques and find the effective feature extraction process for the recognition handwritten digits of different databases in an effective manner.
The paper is organized as follows: Section 2 contains database creation and the preprocessing. Section 3 describes feature extraction methods and the proposed algorithm is presented in Section 4. The experimental details and result analysis is presented in Section 6. Section 6 contains the conclusion part.
II.PROPOSED METHOD
diagram of the proposed method is shown below figure 1.
Fig. 1.Block diagram of the Handwritten Digit Recognition system Step 1: Collection of numeral image database
Several standard datasets of digits are found in English. Some of them are CENPARMI, CEDAR, and MNIST datasets. The CENPARMI (Centre for Pattern Recognition and Machine Intelligence) digit dataset [9] is available from CENPARMI, Concordia University. In this dataset 4000 images (400 samples per class) are specified for training purpose and 2000 images are used for testing purpose. These digit datasets were collected from United States Postal Service (USPS). The Center of Excellence for Document Analysis and Recognition (CEDAR) digit dataset is available from CEDAR, The State University of New York, Buffalo. The training and test sets contain 18468 and 2711 digits, respectively. The number of samples in both training and test sets differ for each class. The Modified National Institute of Standards and Technology (MNIST) dataset [10] was extracted from the NIST datasets SD3 and SD7. The training and test sets are composed of both SD3 and SD7. Samples are normalized into 20×20 grayscale images with aspect ratio reserved, and the normalized images are located in a 28×28 frame. The number of training and test samples is 60,000 and 10,000 respectively. The sample images of the MNIST dataset is shown in figure 2.
Fig. 2. Sample digit images of MNIST database
The plain paper was used for data collection. Each person was instructed to write the digits (fully unconstrained) along the vertical direction. The dataset contains about 100 isolated samples each of 10numerals written by 1000 native writers including university graduates, high school children, and adults. Around fifty percent data is from high school children. A flatbed scanner was used for digitization, with images in gray tone at 300 dpi. These were stored has Bit Map File (BMP) format using a standard technique for converting them
into monochrome images. Data was manually extracted from scanned images and normalized into 50×50 size using a standard bicubic approach. After processing scanned images about digits and a total of 100000 (100×1000) images of numerals are obtained. Dataset developed planned to be made available publicly for research purpose. Some of the sample images after extracting from the scanned image are shown in figure 3.
Fig. 3. Sample Scanned document of digit images Step 2: Digit Image Preprocessing
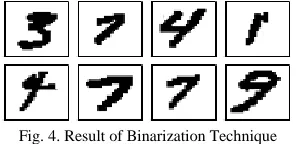
Data capture of documents by optical scanning or by digital video yields a file of picture elements, which is the raw input to document analysis process. The first step in document analysis is to perform a preprocessing on this image to prepare it for further analysis. Such processing includes thresholding to convert a gray scale (or color image) to a binary image, reduction of noise to reduce extraneous data, skew estimation of a document image if document suffers from tilt (skewed), thinning, enable subsequent detection of pertinent features of the object of interest and then segmentation of text line to individual digit character. It is assumed that characters are already isolated and preprocessing steps such as Binarization, noise removal, normalization and thinning are to be done. Initially, the document is captured using gray level mode. Character extraction from the scanned document is done manually. Then Otsu’s histogram-based global threshold approach is applied for digit image Binarization. Figure 4 shows the gray level picture of the character and resultant of global thresholding approach.
Fig. 4. Result of Binarization Technique
The next step is to normalize the given character image into a standard size. For that, a standard nearest neighbor interpolation method is used. Figure 5 shows some sample images after applying normalization technique.
Step 3: Thinning of the digit image
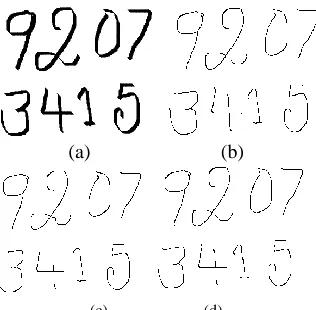
Skeletonization has been a part of image processing for a wide variety of applications. Thinning is the process of reducing the thickness of each line of pattern to just a single pixel width. Thinning is usually used as the first step in applications such as optical character recognition to improve the recognition rate. It has been applied to many fields [11], such as inspection of printed circuit boards, counting of asbestos fibers on air filters, analysis of chromosomes, classification of fingerprints, recognition of characters, application in intelligent copying and facsimile transmission systems, data reduction of map storage, etc. The major advantages of thinning in image processing and pattern recognition are: reduction of an amount of data as input binary image and preservation of fundamental skeleton, which is topologically equivalent to the original object. Many thinning algorithms have been introduced for decades. These algorithms have both advantages and disadvantages. Some algorithms can obtain good quality skeletons, but they run slowly [12]. None of the methods address rotation invariant is thinning. Many are specific to digits, characters, or letters, written in English, Chinese, Arabic, or any other scripts. However, to solve the aforementioned problems, the rotation invariant is rule-based thinning algorithm for character recognition is proposed by [13]. This is a generalized algorithm, which is used to thin the symbols irrespective of the scripts. The advantage of this method is it is invariant is to rotation. The algorithm fails on two-pixel wide lines. To overcome this drawback, an improved rotation-invariant thinning algorithm was proposed by [14]. Recently, improved two-step thinning algorithm is described by Aradhya et.alin the year 2005, which is an improved version of standard two-step thinning algorithm [15]. The proposed algorithm thins the symbols to their central lines and has the rotation invariant property. Compared to two-step and rotation rule-based methods, the improved two-step method is better with respect to time, computations, and preserving topology. Hence in this work, improved two-step thinning algorithm is used for better representation of character images and to extract features from the character images. The resultant of thinning algorithms is shown in figure 6.
(a) (b)
(c) (d)
Fig. 6.Result of different thinning algorithms
III. ANOVEL FEATURE EXTRACTION TECHNIQUE BASED ON
DISTANCE MEASURE FOR HANDWRITTEN DIGITS
Digit image preprocessing has also been done for effective representation of characters. In this paper, a novel feature extraction technique based on distance measure is presented. In this proposed method features are extracted based on distance measure technique. Feature extraction is one of the most important steps in any recognition system. The aim of feature extraction is to represent the image in terms of some quantifiable measurements that may be easily utilized in the classification stage. To a large extent, the accuracy of a recognition system depends on the discriminative capability of features and the generalization performance of a designed classifier. Document image representation methods are categorized in three major groups [16].
A.Global Transformation and Series Expansion:
Geometrical and topological features can represent various global and local properties of numerals images with high tolerance to distortions and style variations. The methods on topological and geometrical representations can be grouped into four categories i.e. Coding, Graphs & Trees, Counting &Extracting Topological Structures and Measuring & Approximating the Geometrical Properties.
B.Statistical Representation:
Representation by the use of statistical distribution of points will take care of the style variations to some extent. There are three important statistical features used for character representation: Zoning, Crossing and Distances and Projections
C.Geometrical and Topological Representation:
A continuous signal generally contains more information that needed to be represented for the purpose of classification. One way to represent a signal is by a linear combination of a series of simpler well-defined functions. The coefficients of the linear combination provide a compact encoding known as transformation or series expansion. Some common transform methods used in the character recognition field are Fourier transform, Gabor transform, Moments and Karhunen-Loeve transform.
In this paper, novel feature extractions schemes are developed i.e. Feature Extraction Method (FEM) based on distance measure are presented.
FEM mainly consists of X major steps
Step 1: Thinning is applied to the given input digit image. In this method two-step & improved two-step thinning algorithms are used for thinning purpose. The resultant thinned images for a given character are shown in Figure 7.
Step 2: The thinned digit image is scanned from top-left corner to top-right corner (row-wise). While scanning the image, the black pixel positions are identified in each row by using the following procedure.
points of the region where the black pixel is encountered.
(b) If the algorithm fails to encounter any black pixel in the row, the distance is considered as zero value. This procedure of finding black pixel in the specified region is continued till the end of the row. Figure 8 shows the working procedure of the proposed method. If the size of the image is 50× 50, then 50 feature values along each row is encountered. Step 3: Similarly distances are calculated column wise i.e.
from the topmost pixel to the bottommost pixel of every column. Figure 9 shows the working procedure of the proposed method. If the size of the image is 50× 50, then 50 feature values along each row is encountered.
Totally 100 (i.e., 50 + 50) features are extracted from each input character.
Fig. 7. Thinning Results (a) Original Image (b) 2 Step result (c) Result Using Improved 2 Step
Fig. 8. Distance Computing along Row-wise
Fig. 9.Distance Computing along Column-wise
The major goal of representation is to extract and select a set of features, which maximizes the recognition rate with the least amount of elements. Feature extraction and selection is defined as extracting the most representative information from the raw data, which minimizes the intra class pattern variability while enhancing the inter-class pattern variability.
IV. RESULTS AND DISCUSSIONS
The proposed feature extraction methods are experimentally evaluated with the dataset containing various handwritten numerals collecting from MNIST data base, CENPARMI data base, CEDAR data base and most of the images from scanned images. Collectively, the data base contains 176000 digit
images. No method has tested using such type of large database. In this paper, Nearest Neighbor Classifier (NNC) is used for classification purpose. All experiments are carried out on a PC machine with i3 processor 2.7GHz CPU and 2 GB RAM memory under MatLab 10.0 platform. 20 percentage of the each data base is used for training and remaining 80 percentage images are used for testing purpose i.e. 35200 images are used for training purpose and 140800 images are used for testing purpose.
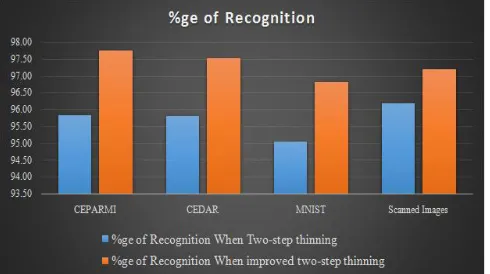
The proposed method is evaluated when two different thinning algorithms are used for thinning a digit image i.e. two-step and improved two step thinning algorithms. The percentage of recognition of the proposed method when two-step method is applied is listed out in tables 1, 2, 3 and 4. The percentage of recognition of the proposed method when improved two-step method is applied is listed out in table 5, 6, 7 and 8. The overall percentage of the proposed recognition system when two thinning technique are applied is shown in a table and the comparison graph of the two thinning algorithms is shown in figure 10. From the figure 10, it is clear that, using two-steps thinning algorithm the overall recognition rate is 94.25 achieved whereas in case of improved thinning algorithm the performance of the system is 96.28%.
TABLE I
MNIST DATA BASE RECOGNITION PERCENTAGE WHEN TWO STEP THINNING
APPLIED
Digit Total no of
Digits
correctly classified
Not Correctly Classified
% Recognition
0 6573 6323 250 96.20
1 6715 6464 251 96.26
2 6580 6308 272 95.87
3 6600 6302 298 95.48
4 6442 6172 270 95.81
5 6575 6365 210 96.81
6 6705 6287 418 93.77
7 6715 6465 250 96.28
8 6605 6262 343 94.81
9 6490 6304 186 97.13
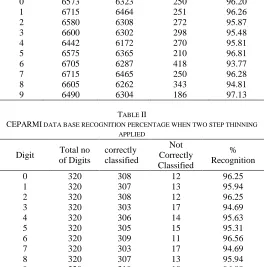
TABLE II
CEPARMI DATA BASE RECOGNITION PERCENTAGE WHEN TWO STEP THINNING
APPLIED
Digit Total no
of Digits
correctly classified
Not Correctly Classified
% Recognition
0 320 308 12 96.25
1 320 307 13 95.94
2 320 308 12 96.25
3 320 303 17 94.69
4 320 306 14 95.63
5 320 305 15 95.31
6 320 309 11 96.56
7 320 303 17 94.69
8 320 307 13 95.94
TABLE III
CEDAR DATABASE PERCENTAGE OF RECOGNITION WHEN TWO STEP THINNING
APPLIED
Digit Total no of
Digits
correctly classified
Not Correctly Classified
% Recognition
0 160 150 10 93.75
1 160 149 11 93.13
2 160 150 10 93.75
3 160 151 9 94.38
4 160 152 8 95.00
5 160 155 5 96.88
6 160 151 9 94.38
7 160 153 7 95.63
8 160 154 6 96.25
9 160 156 4 97.50
TABLE IV
SCANNEDIMAGES DATABASE PERCENTAGE OF RECOGNITION WHEN TWO
STEP THINNING APPLIED
Digit Total no
of Digits
correctly classified
Not Correctly Classified
% Recognition
0 7985 7803 182 97.72
1 8025 7733 292 96.36
2 8123 7800 323 96.02
3 7816 7579 237 96.97
4 7923 7738 185 97.67
5 8050 7711 339 95.79
6 8023 7711 312 96.11
7 8075 7703 372 95.39
8 8115 7731 384 95.27
9 7865 7441 424 94.61
TABLE V
MNIST DATA BASE RECOGNITION PERCENTAGE WHEN IMPROVED TWO STEP
THINNING APPLIED
Digit Total no of
Digits
correctly classified
Not Correctly Classified
% Recognition
0 6573 6503 70 98.94
1 6715 6490 225 96.65
2 6580 6509 71 98.92
3 6600 6423 177 97.32
4 6442 6299 143 97.78
5 6575 6406 169 97.43
6 6705 6513 192 97.14
7 6715 6560 155 97.69
8 6605 6491 114 98.27
9 6490 6324 166 97.44
TABLE VI
CEPARMI DATA BASE RECOGNITION PERCENTAGE WHEN IMPROVED TWO STEP
THINNING APPLIED
Digit Total no
of Digits
correctly classified
Not Correctly Classified
% Recognition
0 320 312 8 97.50
1 320 315 5 98.44
2 320 305 15 95.31
3 320 307 13 95.94
4 320 312 8 97.50
5 320 314 6 98.13
6 320 312 8 97.50
7 320 313 7 97.81
8 320 316 4 98.75
9 320 315 5 98.44
TABLE VII
CEDAR DATABASE PERCENTAGE OF RECOGNITION WHEN IMPROVED TWO
STEP THINNING APPLIED
Digit Total no of Digits
correctly classified
Not Correctly Classified
% Recognition
0 160 156 4 97.50
1 160 157 3 98.13
2 160 155 5 96.88
3 160 155 5 96.88
4 160 156 4 97.50
5 160 153 7 95.63
6 160 152 8 95.00
7 160 155 5 96.88
8 160 153 7 95.63
9 160 157 3 98.13
TABLEVIII
SCANNED IMAGES DATABASE PERCENTAGE OF RECOGNITION WHEN IMPROVED 2-STEP THINNING APPLIED
Digit Total no
of Digits
correctly classified
Not Correctly Classified
% Recognition
0 7985 7833 152 98.10
1 8025 7811 214 97.33
2 8123 7837 286 96.48
3 7816 7632 184 97.65
4 7923 7803 120 98.49
5 8050 7737 313 96.11
6 8023 7820 203 97.47
7 8075 7819 256 96.83
8 8115 7810 305 96.24
9 7865 7641 224 97.15
TABLE IX
%GE OF RECOGNITION OF THE PROPOSED METHOD WHEN TWO THINNING APPROACHES ARE APPLIED
Database
%ge of Recognition When Two-step
thinning
When improved two-step thinning
CEPARMI 95.84 97.76
CEDAR 95.81 97.53
MNIST 95.06 96.81
Fig. 10. Comparing Recognition Accuracy with two Different Thinning Algorithms
From the figure 10 and table 9, it is clear that improved two step thinning algorithm has performed better compared to standard two step thinning algorithm. The proposed method seeks more structural features and the size of the feature vector is also small. The overall recognition rate of the considered digit database is shown in table 10 and the overall recognition percentage is 97.44.
TABLE X
CONSIDERED DATABASE PERCENTAGE OF RECOGNITION WHEN IMPROVED TWO STEP THINNING APPLIED
Digit Total no of Digits
correctly classified
Not Correctly Classified
% Recognition
0 15038 14804 234 98.44
1 15220 14773 447 97.06
2 15183 14806 377 97.52
3 14896 14517 379 97.46
4 14845 14570 275 98.15
5 15105 14610 495 96.72
6 15208 14797 411 97.30
7 15270 14847 423 97.23
8 15200 14770 430 97.17
9 14835 14437 398 97.32
4.1Analysis of the proposed method:
To analyze the proficiency of the proposed system, the outcomes of the proposed method are analyzed in gotten Ten Cycle Cross Validation (TCCV) approach.
Ten Cycle Cross Validation (TCCV) approach: In TCCV approach results analysis strategy, the entire digit data base i.e. 150800 aredivided into 10 sets. Each set consists of 15080 digit images mix up with the images of CEPRM, MNIST, CEDAR images, and Scanned Images. Every set must contain ten classes (0-9) of digit images. In TCCV approach results are analyzed in 10 Cycles. In cycle 1, first set is treated as a sample set and remaining 9 sets are taken as a test dataset. Compute the % of image grouping for test set. In cycle 2, second set is dealt with as a sample set and staying nine sets are taken as a test set. Compute the % of grouping for test set. The same methodology is applied remaining cycles also. This approach Strengthen the proposed method. The % of digit grouping of the proposed strategy in ten cycles are listed in tables XI to XX individually.
TABLE XI
% OF RECOGNITION OF THE PROPOSED METHOD IN CYCLE-1 OF TCCV APPROACH
Digit
Cycle-1
Total Properly
classified
Not correctly classified
% of Classification
0 13534 13389 145 98.93
1 13698 13467 231 98.31
2 13665 13486 179 98.69
3 13406 13167 239 98.22
4 13361 13205 156 98.83
5 13595 13382 213 98.43
6 13687 13413 274 98.00
7 13743 13444 299 97.82
8 13680 13386 294 97.85
9 13352 13137 215 98.39
TABLE XII
% OF RECOGNITION OF THE PROPOSED METHOD IN CYCLE-2 OF TCCV APPROACH
Digit
Cycle-2
Total Properly
classified
Not correctly classified
% of Classification
0 13534 13391 143 98.94
1 13698 13485 213 98.45
2 13665 13468 197 98.56
3 13406 13187 219 98.37
4 13361 13121 240 98.20
5 13595 13419 176 98.71
6 13687 13559 128 99.06
7 13743 13544 199 98.55
8 13680 13467 213 98.44
9 13352 13177 175 98.69
TABLE XIII
% OF RECOGNITION OF THE PROPOSED METHOD IN CYCLE-3 OF TCCV APPROACH
Digit
Cycle-3
Total Properly
classified
Not correctly classified
% of Classification
0 13534 13370 164 98.79
1 13698 13501 197 98.56
2 13665 13468 197 98.56
3 13406 13237 169 98.74
4 13361 13215 146 98.91
5 13595 13412 183 98.65
6 13687 13473 214 98.44
7 13743 13584 159 98.84
8 13680 13462 218 98.41
TABLE XIV
% OF RECOGNITION OF THE PROPOSED METHOD IN CYCLE-4 OF TCCV APPROACH
Digit
Cycle-4
Total Properly
classified
Not correctly classified
% of Classification
0 13534 13421 113 99.17
1 13698 13520 178 98.70
2 13665 13501 164 98.80
3 13406 13191 215 98.40
4 13361 13085 276 97.93
5 13595 13449 146 98.93
6 13687 13472 215 98.43
7 13743 13567 176 98.72
8 13680 13416 264 98.07
9 13352 13206 146 98.91
TABLE XV
% OF RECOGNITION OF THE PROPOSED METHOD IN CYCLE-5 OF TCCV APPROACH
Digit
Cycle-5
Total Properly
classified
Not correctly classified
% of Classification
0 13534 13320 214 98.42
1 13698 13504 194 98.58
2 13665 13501 164 98.80
3 13406 13209 197 98.53
4 13361 13215 146 98.91
5 13595 13456 139 98.98
6 13687 13473 214 98.44
7 13743 13490 253 98.16
8 13680 13531 149 98.91
9 13352 13215 137 98.97
TABLE XVI
% OF RECOGNITION OF THE PROPOSED METHOD IN CYCLE-6 OF TCCV APPROACH
Digit
Cycle-6
Total Properly
classified
Not correctly classified
% of Classification
0 13534 13389 145 98.93
1 13698 13485 213 98.45
2 13665 13489 176 98.71
3 13406 13272 134 99.00
4 13361 13223 138 98.97
5 13595 13436 159 98.83
6 13687 13530 157 98.85
7 13743 13484 259 98.12
8 13680 13472 208 98.48
9 13352 13186 166 98.76
TABLE XVII
% OF RECOGNITION OF THE PROPOSED METHOD IN CYCLE-7 OF TCCV APPROACH
Digit
Cycle-7
Total Properly
classified
Not correctly classified
% of Classification
0 13534 13415 119 99.12
1 13698 13497 201 98.53
2 13665 13501 164 98.80
3 13406 13283 123 99.08
4 13361 13223 138 98.97
5 13595 13399 196 98.56
6 13687 13469 218 98.41
7 13743 13550 193 98.60
8 13680 13493 187 98.63
9 13352 13218 134 99.00
TABLE XVIII
% OF RECOGNITION OF THE PROPOSED METHOD IN CYCLE-8 OF TCCV APPROACH
Digit
Cycle-8
Total Properly
classified
Not correctly classified
% of Classification
0 13534 13420 114 99.16
1 13698 13485 213 98.45
2 13665 13497 168 98.77
3 13406 13190 216 98.39
4 13361 13224 137 98.97
5 13595 13431 164 98.79
6 13687 13552 135 99.01
7 13743 13532 211 98.46
8 13680 13537 143 98.95
9 13352 13198 154 98.85
TABLE XIX
% OF RECOGNITION OF THE PROPOSED METHOD IN CYCLE-9 OF TCCV APPROACH
Digit
Cycle-9
Total Properly
classified
Not correctly classified
% of Classification
0 13534 13321 213 98.43
1 13698 13522 176 98.72
2 13665 13473 192 98.59
3 13406 13239 167 98.75
4 13361 13222 139 98.96
5 13595 13408 187 98.62
6 13687 13538 149 98.91
7 13743 13606 137 99.00
8 13680 13541 139 98.98
TABLE XX
% OF RECOGNITION OF THE PROPOSED METHOD IN CYCLE-1 OF TCCV APPROACH
Digit
Cycle-10
Total Properly
classified
Not correctly classified
% of Classification
0 13534 13343 191 98.59
1 13698 13468 230 98.32
2 13665 13489 176 98.71
3 13406 13171 235 98.25
4 13361 13212 149 98.88
5 13595 13391 204 98.50
6 13687 13471 216 98.42
7 13743 13474 269 98.04
8 13680 13431 249 98.18
9 13352 13101 251 98.12
Comparison of the proposed method with other existing methods:
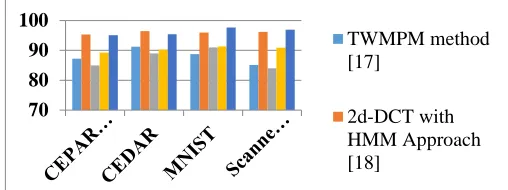
The efficiency of the proposed method is compared to other existing methods like twin minimax probability machine (TWMPM) proposed by Zhijie et.al [17], transformation based features proposed by Syed et.al [18], Back Propagation with Neural Network approach[19] and selection, reproduction, mutation and crossover methods with Genetic Algorithm (GA) proposed by Devikanniga et.al[20]. The TWMPM method generates two hyper-planes of the digit images and it also avoids making distributional assumptions about the class-conditional densities of the digit. The performance of the TWNPM method is evaluated on two data sets only i.e UTC and MNSIT and the overall percentage of the proposed method 88.07%. The method proposed by the Syed utilizes the Discrete Cosine Transform (2D-DCT) for feature extraction and Hidden Markov models (HMMs) used for classification. The syed proposed method is applied on only MNIST database and got 95.95% if feature vector size is more. More feature vector causes more computational cost. Sakshica proposed to classify the handwritten digits by using the features and their spatial relationship in the pattern with Hopfield Neural Network. A small number of images are tested by using this method and got 90.23% only. Devikanniga proposed a method to classify the handwritten digit using GA and got the overall performance is only 87%. The performance evolution of the proposed method with other existing methods is listed out in table 21 and the classification graph is represented in figure 11. From table 10 and figure 11, it is clearly evident that, the proposed method exhibits a high recognition rate than the existing methods.
TABLE XXI
OVERALL %GE OF THE DIFFERENT RECOGNITION SYSTEMS
Data Base
TWMP M method
[17]
2d-DCT with HMM Approac
h [18]
NN with Back propagati
on [19]
different NN Approach
es [20]
propose d method
CEPARMI 87.18 95.28 85 89.23 95.11
CEDAR 91.23 96.45 89 90.24 95.43
MNIST 88.73 95.92 91 91.27 97.63
Scanned
Images 85.15 96.18 84 90.87 96.95
Fig. 11. Graphical representation of the % recognition of the proposed method and other existing methods
V.CONCLUSION
In this paper a very large database of unconstrained handwritten digit images for experiment purpose was introduced. No author tested with such a large data base. It is proposed to make this database available for research purpose. 100000 handwritten characters collected from 1000 different individuals of different age groups and different areas. No author has attempted to such collection. The proposed method utilizes a small algorithms for preprocessing such as Binarization, normalization and thinning algorithms. The proposed method takes very less amount processor time for recognition of digit image. The main object of the proposed method is an efficient feature extraction method is derived for handwritten digit recognition. For thinning digit image, a well-known technique is used i.e. improved two-step thinning method. The overall percentage of the proposed method achieves 97.36%. The proposed method is evaluated by Ten Cycle Cross Validation (TCCV) approach to find the effectiveness of the proposed method No such method is available up to now utilizing the large set data base for testing.
REFERENCES
[1] J. pradeep, E. Strinivasan, and S. Himavathi, Neural network based
handwritten character recognition system with feature extraction. International conference on computer, communication and electrical technology- ICCCET 2011, 18th & 19th Mar. 2011.
[2] W. Wu and Y. Bao, Online handwritten magnolia words recognition
based on multiple classifiers, 2009.
[3] C. L. Liu, K. Nakashima, H. Sako, and H. Fujisawa, Handwritten digit recognition: investigation of normalization and feature extraction techniques, Pattern Recognition, vol. 37, iss. 2, pp. 265-279, 2004 [4] C. Y. Suen, C. Nadal, R. Legault, T. A. Mai, and L. Lam, Computer
recognition of unconstrained handwritten numerals, Proc. IEEE, vol. 80, iss. 7, pp. 1162-1180, 1992.
[5] D. Gorgevik and D. Cakmakov, ”Handwritten Digit Recognition by
Combining SVM Classifiers,” in The International Conference on Computer as a Tool (EUROCON), 2005.
[6] M. D. Garris, J. L. Blue and G. T. Candela, ”NIST form-based handprint
recognition system,” NIST, 1997.
[7] P. J. Grother, ”NIST special database 19 hand printed forms and
characters database,” National Institute of Standards and Technology, 1995.
[8] X. Chen, X. Liu and Y. Jia, ”Learning Handwritten Digit Recognition by
the Max-Min Posterior Pseudo-Probabilities Method,” in Ninth International Conference on Document Analysis and Recognition (ICDAR 2007), 2007.
[9] Xu, L., A. Krzyzak and C.Y. Suen (1992). Methods of combining
multiple classifiers and their applications to handwriting recognition. IEEE Trans. Syst. Man Cybernet. 22 (3), 418-435.
70 80 90 100
TWMPM method [17]
[10] Y. LeCun and Y. Bengio. Convolutional networks for images, speech, and time-series. In M. A. Arbib, editor,The Handbook of Brain Theory and Neural Networks. MIT Press, 1995
[11] B T Chen, Y S Chen and WH Hsu,” A Parameterized Fuzzy Processor
and its Applications,” Fuzzy sets and systems, Vol 59, pp. 149-172, 1993
[12] Sehultze-Lam S, Harauz G, Beveridge TJ, “ Participation of a
cyanobacterial S-layer in fine grain mineral formation”, 1992
[13] Maher Ahmed, Rabab Ward, “A Rotation Invariant Rule-Based Thinning
Algorithm for Character Recognition”, IEEE Transactions on Pattern Analysis and Machine Intelligence , Volume 24 Issue 12, December 2002 , Page 1672-1678
[14] Peter I. Rockett, 2005, An Improved Rotation- Invariant Thinning
Algorithm, IEEE, Trans. Patt.Anal.MachineIntll., Oct, Vol. 27.No.10. pp. 1671-1674.
[15] Gonzlez R.C and Woods R. E, 2002 “ Digital Image Processing text
book” 2nd
edition 2002
[16] Nafiz Arica and Fatos T. Yarman-Vural, “An Overview of Character
Recognition Focused on Off-Line Handwriting”, IEEE Transactions On Systems, Man, And Cybernetics—Part C: Applications And Reviews, Vol. 31, No. 2, May 2001
[17] Zhijie Xu, Jianqin Zhang and 3Hengyou Wang, “Twin Minimax
Probability Machine for Handwritten Digit Recognition”, International Journal of Hybrid Information Technology Vol.8, No.2 (2015), pp.31-40
[18] Syed Salman Ali, Muhammad Usman Ghani “Handwritten Digit
Recognition using DCT and HMMs”, CONFERENCE PAPER · JANUARY 2014
[19] Sakshica, Dr. Kusum Gupta, “Handwritten Digit Recognition using
various Neural Network Approaches”, International Journal of Advanced Research in Computer and Communication EngineeringVol. 4, Issue 2, February 2015
[20] Ms. D. Devikanniga, Dr. M. Thangamani, “Handwritten Digit