e-ISSN: 2278-067X, p-ISSN: 2278-800X, www.ijerd.com
Volume 11, Issue 05 (May 2015), PP.57-63
Study on Consolidation and Correlation with Index Properties
Of Different Soils in Manipur Valley
Soibam Priyadarshini Devi
1, Dr. Konsam Rambha Devi
2,
Dr DSV Prasad
3, Dr.GVR Prasada Raju
4
1PG Student, Dept. of Civil Engineering, BVC Engineering College, Odalarevu. AP. 2
Assistant Professor, Dept.of Civil Engineering, Manipur Institute of Technology, Imphal.
3Professor&Principal, Dept. of Civil Engineering, BVC Engineering College, Odalarevu, AP. 4
Professor, Department of Civil Engineering, Registrar, JNT University, Kakinada, AP, India.
Abstract:- It is essential to know the rate of compression of clay for design purposes. Determination of the value of coefficient of consolidation cv which gives the rate at which compression of soil layer takes place can
be done by conducting routine one-dimensional consolidation tests. Since this test is time consuming, it is desirable to predict the value of cv by correlating with some simple index property, especially for preliminary
assessment. From literature, it can be seen that researchers have attempted to correlate cv with various index
properties like liquid limit (Lambe and Whitman, 1979), plasticity and liquidity index (Carrier, 1985),void ratio at the liquid limit and in situ effective overburden pressure (Raju et al., 1995), shrinkage index (Sridharan and Nagaraj, 2004) etc. To obtain a correlation of cv with index properties for the soil of Manipur, routine
one-dimensional consolidation tests were conducted on five different types of soils collected from different places of Manipur. From the present experimental study on undisturbed soil specimens, it is found that cv has a better
correlation with the liquid limit.
Keywords:- liquid limit, plasticity index, shrinkage index, coefficient of consolidation,overburden pressure.
I.
INTRODUCTION
Settlements in deep deposits in soft clay constitute an engineering challenge in construction of buildings, road embankments, flood control levees, dykes and dams. For improvement of soft soil or the construction of building foundations or embankments, it is essential to know the rate of compression of this soil. This can be done by conducting routine one-dimensional consolidation tests from which the values of compression index Cc and coefficient of consolidation cv can be evaluated. This process is time consuming and
there is a need to predict long term settlement with a high degree of accuracy in short duration of time by correlating these long process for determination of consolidation test of soil with some other simple properties tests. Due to time constrains, emergency of the project as well as for a better comparison, several correlations are widely used while preparing geotechnical investigation report. Carrier (1985) has made an early attempt to predict coefficient of consolidation, cv(in m2/s) as given by the equation,
CV= [9.09x10 -7
(1.192+ACT-1)6.993(4.135IL+1) 4.29
]/[Ip(2.03IL+1.192+ACT -1
)7.993],
where, ACT=Activity, IL=Liquidity index, IP=Plasticity index and it can be observed from above equation, the
coefficient of consolidation (cv) is inversely proportional to the plasticity index. Raju (1995) proposed an
equation to predict coefficient of consolidation, cv (in cm2/s) for a normally consolidated clay in terms of the
void ratio at the liquid limit (eL) and the in situ effective overburden pressure, σv (kPa), given as cv=[1+[eL
(1.23-0.276logσv)/eL]]*[[1/σv‟(0.353)]*10-3]], Sridharan and Nagaraj (2012) have brought the role of plasticity properties
in controlling the compressibility characteristics. They have shown that shrinkage index has a better correlation with compressibility characteristics than the plasticity index or liquid limit of soils given by the equation cv= [3/(100(Is)3.54 ] , where, cv= Coefficient of consolidation in m2/sec; Is= Shrinkage index. Asma et al.,(2011) have
proposed a relation between coefficient of consolidation and liquid limit of undisturbed silty clay of Middle and South Iraq is cv= 4258 wL(-1.75),where, wL= Liquid limit of soil. Solanki (2011) study compressibility
characteristics for locally available highly plastic clay for Surat City and Suda treated with different percentages of rice husk and found that coefficient of consolidation has a better correlation with plasticity index shown in the equation (cv) = 7.7525 Ip-3.1025 cm2/sec . It is inferred from the works of various researchers that there are
varying opinions on the correlation of cv with the different plasticity properties of different clays. The paper is
an attempt to find suitable correlation of cv with the plasticity property of the soil found in Manipur.
This indicates that for large projects consolidation is one of the criteria influencing design. There is very little literature available on engineering properties of soil of Manipur excepting the available soil investigation reports. In this study, five undisturbed samples of clay from different places (Lamphelpat, Keithelmanbi, Singjamei, KeiraoWangkhem and Moirang) of Manipur were used to predict coefficient of consolidation by correlating with some of their index properties.
II.
MATERIALS USED
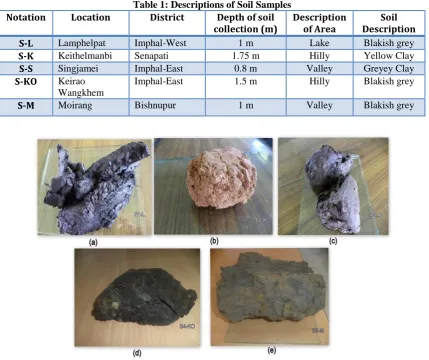
Manipur is a state situated in North-Eastern part of India. Out of total area, about nine-tenth constitute the hills which surround the remaining one-tenth valley. The soil formation in this region mainly consists of soft clays and soft clay with organic matters in low lying areas which have now filled up. It was expected that the value of settlement is high in these places considering the soft nature of clay and high compressibility of the soft clay in comparison to any other type of soil. Locally available five different types of clayey soil including one organic clay soil were used for the test. The descriptions of the sites are given in Table 1.The undisturbed block soil samples of size 300×400×300 mm3 were collected from the depths of around 1.5 m to 1.75 m from five locations in the valley and near the hilly areas shown in Fig.1. Laboratory investigations were carried out on the soil samples to find their basic index properties.
Table 1: Descriptions of Soil Samples
Notation Location District Depth of soil
collection (m)
Description of Area
Soil Description
S-L Lamphelpat Imphal-West 1 m Lake Blakish grey
S-K Keithelmanbi Senapati 1.75 m Hilly Yellow Clay
S-S Singjamei Imphal-East 0.8 m Valley Greyey Clay
S-KO Keirao
Wangkhem
Imphal-East 1.5 m Hilly Blakish grey
S-M Moirang Bishnupur 1 m Valley Blakish grey
Fig. 1: Five Samples (a) S1-L (b) S2-K (c) S3-S (d) S4-KO and (e) S5-M
III.
TESTING PROCEDURE
3.3. Grain Size Distribution: Sieve analysis has been conducted as per IS: 2720 (Part IV 1965).
3.4. Liquid Limit: The test has been carried out using the standard Casagrande liquid limit apparatus as per IS: 2720-(PartV-1965).
3.5. Plastic Limit: The plastic limit of the soil specimens was determined by the rolling thread method as outlined in the IS: 2720 (Part 5)-1985.
3.6. Shrinkage Limit: The shrinkage limit of soil specimens was determined according to Indian standard code for a shrinkage factor IS: 2720 (Part VI) - 1972 of soils by the mercury method.
3.7. Plastic Limit: The plastic limit has been determined according to the IS: 2720- (Part V-1970).
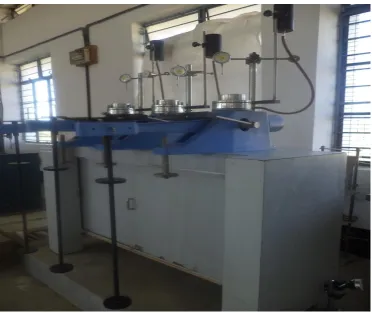
3.8. One-Dimensional Consolidation: One-dimensional consolidation tests were performed by standard floating ring consolidometer with stainless steel rings, 60 mm in diameter and 20 mm high according to IS: 2720 (Part 15)-1986. One-dimensional consolidation tests were performed on five undisturbed samples in standard floating ring consolidometer with stainless steel rings, 60mm in diameter and 20mm high according to IS: 2720 (Part 15)-1986 (Reaffirmed 2002).The test was continued with applied stress of 10, 20, 40, 80, 160, 320, 640 and 1280kPa. For each load increment reading was taken using a time sequence of 0.1, 0.25, 1, 2.25, 4, 6.25, 9, 12.25, 25, 36, 49, 64, 81, 100, 121, 144, 169, 196, 225, 256, 289, 324, 361, 400, 500, 600 and 1440 minutes. Each specimen was loaded to a stress of 640kPa and later unloaded with a load decrement ratio of one-fourth of the preceding load up to a 10kPa. After unloading the specimen was again reloaded with an increment of four times the preceding load. Each specimen was loaded up to a maximum load of 1280 kPa. This maximum load is then kept for another 15 to 25 days until the compression ceased to a value for determination of creep and the reading were taken after every 24hrs. The time sequences were used to plot the change in thickness of specimen against logarithm of time for determination of co-efficient of consolidation for each load increment as shown in Fig.2.
Fig. 2: Three loading gang Consolidometer (Oedometer)
IV.
TEST RESULTS
Table 2: Details of Index Properties of Soils Used
Sample S1-L S2-K S3-S S4-K S5-M
Location Langol Keiithelmanbi Singjamei Keirao Moirang
Soil Description Black organic clay
Yellow Clay Grey Clay Blackish grey
Blackish grey
Water Content w (%)
86 35.29 52.17 30.9 30.2
Specific Gravity Gs
2.48 2.77 2.7 2.78 2.71
Liquid Limit WL (%)
88 58.65 76.2 62.1 52.4
Plastic Limit WP (%)
67.77 34.56 25.55 29.14 28.87
Shrinkage Limit Ws (%)
25.16 25.80 24.90 25.30 25.00
Plasticity index Ip (%)
40.23 24.09 50.65 32.96 22.53
Shrinkage index l s (%)
62.84 32.85 51.30 36.80 30.4
Activity 0.657 0.536 0.675 0.978 1.07
Grain size Distribution (%)
Sand 0.01 5.11 0.27 1.55 11.71
Silt 29.65 53.69 24.73 64.75 59.28
Clay 70.34 41.00 75.00 33.70 29.00
Soil Classification CH MH CH MH-CH MH-CH
4.1 Consolidation Test Results
From consolidation test results, the coefficient of consolidation (cv) value was determined by
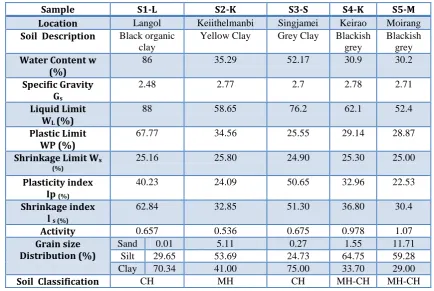
Casagrande‟s method. From Table 3 it is observed that the compressibility of S1-L is the highest. This is expected to the organic content of the soil. Sample S5-M is found to be the least compressive of soils tested.
Table 3: Consolidation Parameters
Parameters S1-L S2-K S3-S S4-KO S5-M
Water Content (%)
76 35.29 52.17 30.9 30.2
Initial Void Ratio E0
1.77 0.707 1.5 0.96 0.71
Pre-Consolidation
Pressure P (kN/m2)
70 180 160 80 160
Compression Index Cc
0.747895 0.244034 0.257034 0.258915 0.14537
Co-efficient of Consolidation
Cv (m2/Sec)
1.02 E-08 To 6.27E-09
1.32E-07 To 8.84E-08
1.0E-7To 2.73E-08
1.18 E-07 To 4.20E-08
1.25E-07 To 5.95E-08
4.2 Coefficient of Consolidation with Effective Consolidation Vertical Pressure
Fig.2 shows the plot of cv versus effective vertical pressure (v) on log-log plot for all the five samples.
From this plot it is noted that below an effective pressure of 40 kPa the value of cv are low. Above this effective
vertical pressure, cv values are more or less the same for all the pressure increment applied for soil.
Robinson and Allam (1998) found from their studies on the response of cv to v increase in clays that it
is governed by the mechanical and physicochemical factors that govern the compressibility. They have concluded that the increasing behavior of cv tov due to the compressibility of such soils being governed by
Sridharan and Nagaraj (2004) observed from their studies on cv of remolded soils that cv values are
relatively higher for less plastic than for more plastic soils, through their liquid limit is nearly the same. The author explained that, for a normally consolidated soil, the soil particles become more oriented with increase in effective consolidation pressure and for more plastic soil, the diffuse double layer repulsive forces mobilize and offer more resistance to compression (both rate and amount). For less plastic soils whose compressibility behavior is governed mainly by mechanical forces, as the consolidation pressure increases, the gravitational forces increase and over ride the little repulsive pressure at the particle level in retarding the compression of soil, and hence, the increase in the rate of compression of the soil, i.e., an increase in cv with pressure.
1.0E-09 1.0E-08 1.0E-07 1.0E-06
1 10 100 1000 10000
Co
-e
ff
ic
ie
n
t
o
f
c
o
n
so
li
d
a
ti
o
n
, c
v
(m
2/s
e
c
)
Effective pressure, σ'v(kPa)
S1-L S2-K S3-S S4-KO S5-M
Fig. 3: Coefficient of Consolidation Vs. Effective Pressure
4.3 Correlation of Coefficient of Consolidation with Index Properties
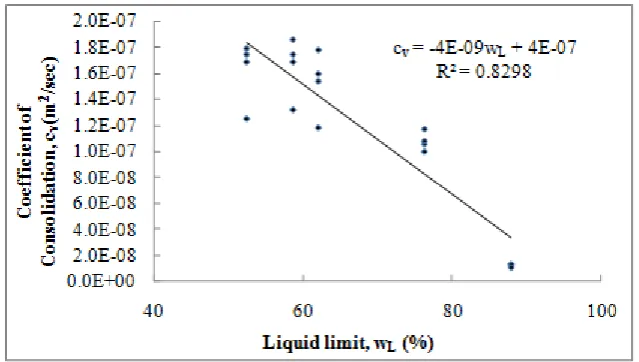
The values of the cv of five different soils obtained from the experimental results are correlated with
index properties viz. liquid limit, plasticity index and shrinkage index to check which one fits the best. Coefficient of correlation „R2‟, determined graphically using Microsoft Excel spreadsheet, is used as evaluation
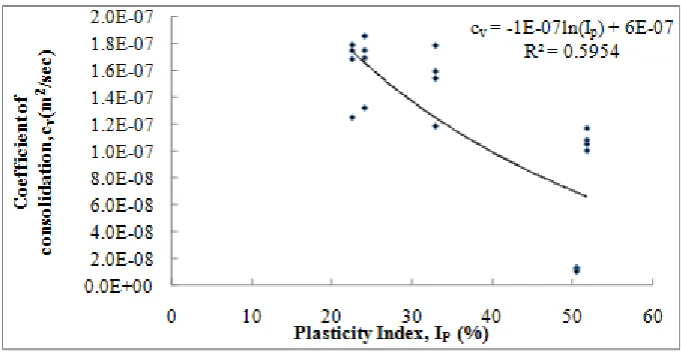
criteria to check the best fits of the curves. Figs. 4, 5, and 6shows the correlation of coefficient of consolidation with liquid limit, plasticity index and shrinkage index along with their coefficient of correlation.
Fig.4: Relationship between Plasticity Index and Coefficient of Consolidation
From these figures it is observed that scatter is most in the correlation of cv with plasticity index. It is also
observed that better correlation exists between cv and shrinkage index (liquid limit-shrinkage limit) as compared
with the plasticity index. However, coefficient of consolidation correlates the best with liquid limit compared to the plasticity index or shrinkage index for the soils under study.For the soils under study, the cv can be
correlated with liquid limit by the equation
From this study it is clear that for undisturbed soil samples, among the correlation of cv with index properties
correlation of cv with liquid limit is a better correlative parameters in comparison with shrinkage index and
plasticity index.
cv= 1E-06e-0.064Is R² = 0.6132
0.0E+00 5.0E-08 1.0E-07 1.5E-07 2.0E-07 2.5E-07
0 20 40 60 80
C
o
e
ff
ic
ie
n
t
o
f
C
o
n
so
li
d
a
ti
o
n
,
cv
(m
2/se
c
)
Shrinkage index, IS (%)
Fig. 5: Relationship between Shrinkage Index and Coefficient of Consolidation
Fig. 6: Relationship between Liquid Limit and Coefficient of Consolidation
V.
CONCLUSION
From the experimental results the specific gravity varies between 2.48 to 2.78, liquid limit values are 52.4% to 88%, plastic limit values between 25.55% to 67.77% and the shrinkage limit values are ranging between 24.90 %to 25.80% , consolidation tests void ratio varies between 0.707 to 1.77 and coefficient of consolidation are between 1.0E-7 - 2.73E-08 to 1.32E-07 - 8.84E-08 for five selected samples. An attempt has been made to correlate the variations in the values of cv and index properties of the soils. The conclusion of the
study for the prediction of cv by correlating with some simple index properties viz. liquid limit, plasticity index
and shrinkage index, it is concluded that cv correlates better with liquid limit of soil.
REFERENCE
[1]. Carrier, W. D., III, (1985). “Consolidation Parameters Derived From Index Tests,” Geotechnique, Vol. 35, No. 2, pp. 211–213.
[2]. Lambe, T. W. and Whitman, R. V., (197).Soil Mechanics, John Wiley and Sons, New York.
[3]. Robinson,R. G. and Allam, M. M., (1998). “Effect of Clay Mineralogy on Coefficient of Consolidation,” Clays and Clay Minerals, Vol. 46 (5), pp. 596-600.
[4]. Asma Y. Al-Tae‟e and Abbas F. Al- Ameri (2011). “Estimation of Relation between Coefficient of Consolidation and Liquid Limit of Middle and South Iraqi Soils,” Vol. 17 (2), pp. 433-440.
[6]. Solanki, C. H., Desai,M. D. and Desai,J. A. (2010).“Quick Settlement Analysis Of Cohesive Alluvium Deposits Using New Empirical Correlations”, Journal of Civil Engineering Research and Practice, Vol. 7(2), pp. 49-58.
[7]. Solanki C. H., (2011), “Quick Settlement Computation of Shallow Foundation Using Soil Index and Plasticity Characteristics,” Geotechnical conference, pp. 1-5.