CONDITIONAL RISK ASSESSMENT BASED ON SOFTWARE
VULNERABILITY WITH CVSS
HyunChul Joh1
1. INTRODUCTION
“If you cannot measure, you cannot improve it” – Lord Kelvin, 1824-1907 –
Governmental organizations, especially military related facilities, regularly carry into speculations of their security maintenances. It could be a simple education of security refresher or a real security audit conducted by outsiders [1, 2]. When inspectors examine security facilities, they evaluate how certain items are secure enough, and express what they measured of security levels in numbers or letter grades. Perhaps, for the next inspection, reviewed organizations hope to have better security grades to receive financial support continually. Many organizations are cautious about their computing environments regardless of their capability to protect themselves against the hostile cyber environments since once a computer security accident happens, it causes major damages on their reputations (blog.datalossdb.org). As a result, organizations try to avoid those types of incidents, but it is not an easy task eliminating all the possible ICT security vulnerabilities from their workplaces. Fortunately, we still can improve the unsecure environments by measuring risk levels and trying to reduce risk values one at a time.
While sometimes risk is informally stated as the possibility of a harm to occur [3], formally, risk is defined to be a weighted measure depending on the consequence. For a potential adverse event, a risk value is stated as [4]:
(1)
This presumes a specific time period for the evaluated likelihood. In this paper, we focus our attention on the risk caused by software systems mainly. Since ICT risk is a subset of risk in a general concept expressed in Equation (1), one of the first step for improving the ICT risk level is measuring how much unsecure the computing environment is. That is because, to improve an unsecure computing environment, they need to somehow measure what their current status is.
So far, numerous methods have been proposed for the risk assessment [5, 6]. In the previous paper [7], we presented a simple methodology for assessing a software risk based on a multi-vulnerability lifecycle for a single software system. In this paper, further, we are trying to show how to measure ICT risk values based on the software vulnerability lifecycle in an organization-wide on top of the multi-vulnerability lifecycle for a software system. Here, we also present combination of the organization-wide risk and the conditional risk [8] in a vulnerable software system. The final values that we like to produce are specific numbers so that calculated risk levels could be compared among other organizations or within the same company with the risk values from the previous years.
The remainder of this paper is organized as follows. Section 2 presents some of the related works. In Section 3, actors in software vulnerability ecosystem will be analyzed. Then, in section 4, CVSS is explained for the background of the following sections. Section 5 will present a conditional risk assessment with CVSS and section 6 will introduce risk assessment method in organization-wide level based on the previous study. Finally, Section 7 concludes the paper with some future works.
1 Department of Computer Engineering, Kyungil University, Gyeongsan, 38428 Korea
DOI: http://dx.doi.org/10.21172/1.103.19
e-ISSN:2278-621X
Abstract – Many organizations are cautious about their ICT computational task environments regardless of their sizes because computer security accidents often cause numerous financial compensations with major damages on their reputations and painful law suits. However, it is next to impossible to remove all the possible ICT security vulnerabilities completely from their workplaces. Fortunately, we still can improve the unsecure computing environments by measuring risk levels and trying to reduce the risk values one by one. In this paper, we propose a novel concept of how to measure ICT risk values based on multiple software vulnerabilities in a target organization. A final produced ICT risk value from an organization that we are considering is a specific number so that risk levels could be compared one another. It is expected that ICT department managers could utilize the result from this research to estimate potential risk levels in their workplaces.
2. RELATED WORKS
In his paper, Arnuphaptrairong [9] compiled a list of software risk from eight literatures in six countries. Publication dates of the eight papers extend from 1991 to 2008. The paper found that the top three most mentioned software risk causes from the eight papers are related to planning and control, requirements, and users. Also it discovered the facts that the most frequent mentioned software risks are misunderstanding of requirements and lack of top managements’ commitment and support. However, the paper pointed out that there might be several factors other than what they found, such as time dimension, culture, application areas and research method. It could be an interesting research topic to investigate the relationship between the list of risks in the paper and vulnerability analysis research [10] that we are currently working on.
Meanwhile, Kondakci [11] offers a quantitative risk assessment model. The author tried to show causal relationships among threat sources and victim systems to facilitate quantitative and relational security assessment for information systems. In order to analyze and infer dependence, causality, and risk propagation within a dependent structure of assets and network nodes, this paper utilizes the Bayesian Belief Network (BBN). It details mathematics of the causal risk assessment approach, and presents a sample assessment. BBN could be further investigated linking to a quantitative vulnerability research as a future work.
Gilliam [12] introduces some of the security assessment instruments and techniques about risk management, developed by Jet Propulsion Lab at CalTech. Flexible Modeling Framework instrument helps to mitigate state space explosion, while Property-Based Tester verifies code for the security properties which are specified in the requirements. In the paper, the author indicated that the use of the software security assessment instruments in the development and maintenance life cycles reduces overall risk to the organization and software users.
Wang et al. [13] tackle security hole of permission-based model in Android applications. They present a framework for quantitative security risk assessment, called DroidRisk, which targets for improving the efficiency of Android permission system. The authors collected 27,274 benign apps from the Google Play and 1,260 Android malware samples to analyze statistically. In the paper, they demonstrated that the DroidRisk framework is able to be utilized for improving the efficiency of Android permission system for informing the user about the risks of Android permission and apps. They claimed that the proposed method will be useful for those third party markets having no malware detection capabilities.
Lastly, Younis and Malaiya [14] compare two vulnerability measurements of CVSS base metric and Microsoft rating systems. They applied the two methods into 813 vulnerabilities from the Internet Explorer and Windows 7 to see whether both approaches agree their results. The output shows that they do not produce the same outcome of how much the vulnerabilities are severe in terms of exploitability and impact point of view. Further, the paper introduces three exploitability index performance measures of sensitivity, precision and F-measure.
3. ACTORS ON SOFTWARE VULNERABILITY ECOSYSTEM
It is helpful for understanding ICT risk assessment to know who the actors in the software vulnerability ecosystem are. That is because majority of the ICT related risks are coming from the software vulnerabilities. As Figure 1 shows, there are many players in the software vulnerability ecosystem. Developers are the creators of security vulnerabilities in software systems. This could be a commercial or governmental vendor, sub-contractor, freelancer, or an open source community. Unsafe or careless programming behaviors cause the security defects.
There are largely two types of vulnerability discoverer: white hat and black hat. When white hats discover the security vulnerability, they follow the responsible disclosure practice, which usually means a full disclosure under the all
stakeholders’ agreement of a period of time for developing patches on the vulnerability, before publishing the details of vulnerability. On the other hand, if black hats detect the vulnerability, they use the information for their own goods. Ozment [15] divided the discoverer into the three types: vendor detector, external detector, and accidental detector.
Radianti et al. [16] empirically shows that there is indeed vulnerability black markets along with the white markets run by security companies such as TippingPoint (http://www.eweek.com/c/a/Security/Price-War-iDefense-Doubles-Bounty-for-Security-Flaws). Whether it is a black or white, the vulnerability markets give motivations and incentives for the vulnerability hunters. Many commercial software vendors directly sell their products online, but more often retailers and service providers do those businesses for the software producers. Buyers could be home users or organizations. In general, the home users install the products and patches in their systems by themselves whereas, in organizations, usually specialized system administrators do the jobs.
Administrators’ roles are very important for defending systems efficiently against malicious users. System admins need to decide when to install newly released security updates because some patches or updates causes problems which not exist before [17], yet if it is too late, the system could be compromised via the security hole.
The terminology of script kiddie is frequently used to distinguish from a black hat who is able to create a hacking tool and able to analyze target system’s security flaws. The script kiddie uses scripts or programs made by other skilled hackers to attack systems and networks. Even though script kiddies’ skill is not mature enough to create their own hacking tools nor analyzing software systems to find critical security holes, they are increasingly recognized as a big concern in security community. In his master’s thesis, White [18] demonstrated the relationship between the number of exploited machines and vulnerability lifecycle as shown in Figure 2 to refute Schneier’s vulnerability lifecycle (http://www.schneier.com/crypto-gram-0009.html). The figure clearly represents that right after the scrip is available, the number of exploited systems are dramatically increasing.
Distributing the detail information to the public about the discovered vulnerability under the responsible disclosure agreement is role of software vendors, security advisories, mass media, and researchers. At the same time, they need to educate end users about the seriousness of the security vulnerabilities and how to fix the problems.
4.CVSS
In July 2003, National Infrastructure Advisory Council (NIAC) commissioned a project to address the problem of multiple and incompatible IT related vulnerability scoring systems. As a result, the Common Vulnerability Scoring System (CVSS) has been adopted by many vendors since its first launch in 2005 such as application vendors, vulnerability scanning and compliance tools, risk assessment products, security bulletins, and academics [19, 20, 21]. Then, significant issues (https://www.first.org/ cvss/v2/history) with the first draft had been found, which led the project to the second version CVSSv2, released in 2007. After that, in June 2015, CVSSv3.0 has been released with reflecting further considerations.
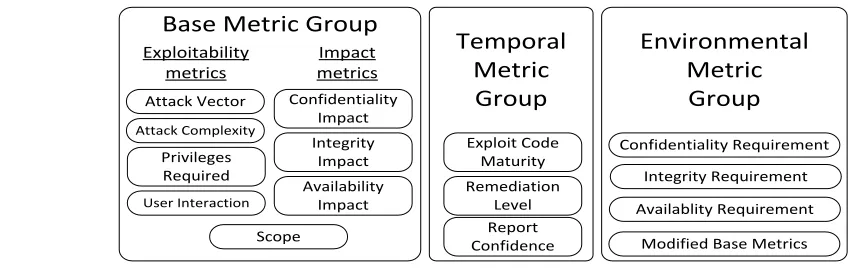
The CVSS is composed of three metric groups: base, temporal and environmental as shown in Figure 3. The final produced score ranges from 0.0 to 10.0; scores close to 0.0 indicate more stable whereas scores close to 10.0 mean more vulnerable to exploitation and cause more serious outcome. For the final CVSS score, the base metric is must be calculated while the other two are optional.
The base metric group, ranges of [0.0, 10.0], represents the intrinsic and fundamental characteristics of a vulnerability, so the score is not changed over time. The base metric has two scores of exploitability and impact scores. The two sub-scores are also ranges of [0.0, 10.0]. The exploitability sub-score captures how a vulnerability is accessed and whether or not
extra conditions are required to exploit it while the impact sub-score measures how a vulnerability will directly affect an IT asset as the degree of losses in confidentiality, integrity, and availability.
The exploitability sub-score is composed of four elements: access vector (AV), access complexity (AC),privileges required (PR), and user interaction (UI). AV reflects how the vulnerability is exploited in terms of Network (N), Adjacent (A), Local (L), or Physical (P). AC measures the complexity of the attack, required to exploit the vulnerability, once an attacker has gained access to the target system in terms of High (H) or Low (L). PR describes the level of privileges an attacker must process for a successful exploitation for a target vulnerability, and this metric is measured in terms of None (N), Low (L), or High (H). And, UI determines whether the vulnerability can be exploited solely at the will of the attacker, or whether a separate user must participated in some manner, and the metric has two possible values of None (N) or Required (R).
Meanwhile, the impact sub-score is composed of the three key aspects in information security components: confidentiality (C), integrity (I) and availability (A). The impact attributes are all assessed in terms of High (H), Low (L), or None (N). A new metric has been added into the base metric CVSSv3.0, called scope (S) which has an ability capturing a fact whether a vulnerability in one software component to impact resources beyond its means, or privileges. This metric has two possible values of Unchanged (U) or Changed (C).
Before CVSS scores are entered into NVD, security experts analyze the vulnerabilities and assign one of the qualitative letter grades mentioned above on the vulnerabilities [21]. Since the central goal of CVSS is producing comparable vulnerability scores, analyzers are allowed to rate the vulnerabilities only with those letters. Finally, scoring is in the process of combining all the metric values according to the specific formulas (https://www. first.org/cvss/specification-document).
The temporal metric group, ranges of [0.0, 10.0], is measured dynamically in terms of Exploit Code Maturity (E), Remediation Level (RL), and Report Confidence (RC). E measures the current state of exploit techniques or code availability, and is evaluated in terms of Not Defined (X), High (H), Functional (F), Proof-of-Concept (P) or Unproven (U). RL refers to the type of remediation available in terms of Official Fix (O), Temporary Fix (T), Workaround (W), Unavailable (U), or Not Defined (X). RC attribute refers to the confidence in the existence of the vulnerability and the credibility of the known technical details, and is evaluated in terms of Not Defined (X), Confirmed (C), Reasonable (R), or Unknown (U).
The environmental metric group, ranges of [0.0, 10.0], measures the characteristics of a vulnerability that are associated with a user’s IT environment: all related to the system environment and the stakeholders’ values. It is measured in terms of, first, Security Requirements of Confidentiality (CR), Integrity (IR), and Availability (AR), and second, Modified based metrics which enable analysts to adjust the base metrics according to the modifications that exist within analysts’ environments. The security requirements are all measured in Not Defined (X), High (H), Medium (M) or Low( L), and the possible values for the Modified base metric are the same values as the corresponding Base Metric, as well as Not Defined as default value. The attributes of security requirements enable analysts to customize the score depending on the importance of the affected IT asset to a user’s organization.
The temporal metrics measure impact of developments such as release of patches or code for exploitation. The environmental metrics allow assessment of impact by taking into account the potential loss based on the expectations for the target system. The optional temporal and environmental metrics can add additional information to the base metric used for estimating the overall software risk more accurately if the required information is available.
5. CONDITIONAL RISK ASSESSMENT WITH CVSS
In the previous conference paper [8], based on the CVSS, a concept of conditional risk measure for a software system has been introduced. It shows conditional measures of risk can be potentially combined into a single measure of total risk. In this section, first, we explain what we have shown in the previous preceding paper. Researchers have often explored methods of risk that seem to be defined differently. The likelihood of the exploitation of a vulnerability depends not only on the nature of the vulnerability but also how easy it is to access the vulnerability, the motivation and the capabilities of a potential intruder.
Base Metric Group
Exploitability metrics Impact metrics Attack Vector Attack Complexity Privileges Required User Interaction Confidentiality Impact Integrity Impact Availability Impact ScopeTemporal
Metric
Group
Exploit Code Maturity Remediation Level Report ConfidenceEnvironmental
Metric
Group
Confidentiality Requirement Integrity Requirement Availablity RequirementModified Base Metrics
In general, a system has multiple weaknesses. The risk of exploitation in each weakness i is given by Equation (1). Assuming that the potential exploitation of a weakness is statistically independent of others, the system risk is given by the summation of individual risk values:
(2)
where Li is the likelihood of exploitation of weakness i and Ii is the corresponding impact. The likelihood Li can be expressed
in more detail by considering factors such as probability of presence of a vulnerability vi and how much exploitation is
expected as shown below equations for:
where the security attribute j=1,2,3 respectively represents confidentiality, integrity and availability. IiA is the CVSS Base
Impact sub-score whereas Cji is the CVSS Environmental CR, IR or AR metric.
The two detailed expressions for likelihood and impact above allow defining conditional risk measures. Often risk measures used by different authors differ because they are effectively conditional risks which consider only some of the risk components. The components ignored are then effectively equal to one.
As mentioned above, for a weakness i, risk is defined as Li ⅹIi. The conditional risk measures {R1, R2, R3, R4} can be
defined by setting some of the factors in the above equations to unity:
R1: by setting {LCi, LDi, Cji} as unity. The CVSS Base score is a R1 type risk measure. R2: by setting {LDi, Cji} as unity. The CVSS temporal score is a R2 type risk measure. R3: by setting LDi as unity. The CVSS temporal score is a R3 type risk measure. R4: is the total risk considering all the factors.
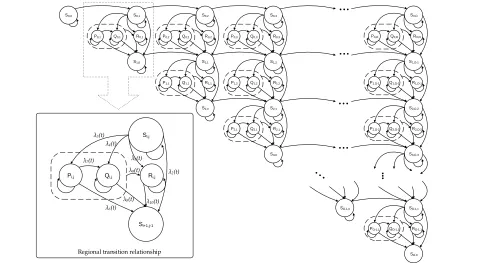
We first consider evaluation of the risk due to a single vulnerability using a stochastic model [22]. The regional transition relationship in Figure 4 [7] presents a simplified model of the lifecycle of a single vulnerability, described by five distinct states. Initially, the vulnerability starts in State S0,0 where it has not been found yet. When the discovery event leading to S0,1(Si,j, where i means the number of patched vulnerabilities, and j means the number of not patched vulnerabilities. Hence,
there are total i + j many known vulnerabilities.) is made by a white hat, there is no immediate risk, whereas if it is found by a
R0,1 P0,1 Q0,1
S1,0
R0,2 P0,2 Q0,2
R1,1 P1,1 Q1,1
S1,1
S2,0
R0,3 P0,3 Q0,3
R1,2 P1,2 Q1,2
S1,2
S2,1
R2,1 P2,1 Q2,1
S3,0 S0,3 S0,2 S0,1 S0,0 R0,Ω P0,Ω Q0,Ω
R1,Ω-1 P1,Ω-1 Q1,Ω-1
S1,Ω-1
S2,Ω-2
R2,Ω-2 P2,Ω-2 Q2,Ω-2
S3,Ω-3 S0,Ω
SΩ-1,1
RΩ-1,1 PΩ-1,1 QΩ-1,1
SΩ,0 SΩ-1,0
Ri,j
Pi,j Qi,j
Si+1,j-1
Si,j
λ4(t)
Regional transition relationship
λ5(t)
λ2(t)
λ7(t)
λ6(t)
λ8(t)
λ9(t)
λ10(t)
λ3(t)
black hat, there is a chance it could be soon exploited. State Si+1,j-1 represents the situation when the vulnerability is disclosed
along with the patch release and the patch is applied right away. Hence, Si,0 is a safe state and is an absorbing state. In State Qi,j, the vulnerability is disclosed with a patch but the patch has not been applied, whereas Pi,j represents the situation when
the vulnerability is disclosed without a patch. Both Qi,j and Pi,j expose the system to a potential exploitation which leads to Ri,j.
We assume that Ri,j is an absorbing state.
In the figure, for a single vulnerability, the cumulative risk in a specific system at time t can be expressed as probability of the vulnerability being in Ri,j at time t multiplied by the consequence of the vulnerability exploitation.
If the system behavior can be approximated using a Markov process, the probability that a system is in a specific state at t
could be obtained by using the Markov model. Computational methods for semi-Markov [23] and non-Markov [24] processes exist, however, since they are complex, we illustrate the approach using the Markov assumption. Since the process starts at S0,0, the vector giving the initial probabilities is α = (P0(0) P1(0) P2(0) P3(0) P4(0) P5(0)) = (1 0 0 0 0 0), where Pi(t)
represents the probability that a system is in State i at time t. Let (t) be as a state transition matrix for a single vulnerability where t is a discrete time point. Let the xth element in a row vector of v as v
x, then the probability that a system is in State 3
(Ri,j) at time n is . Therefore, according to the Equation (1), the risk for a vulnerability i at time t is:
(3)
The impact may be estimated from the CVSS scores for Confidentiality Impact (IC), Integrity Impact (II) and Availability
Impact (IA) of the specific vulnerability, along with the weighting factors specific to the system being compromised. It can be
expressed as impacti = fC(ICRC,IIRI,IARA) where fC is a suitably chosen function. CVSS defines environmental metrics termed
Confidentiality Requirement, Integrity Requirement and Availability Requirement that can used for RC, RI and RA. The
function may be chosen to be additive or multiplicative.
We now generalize the above discussion to the general case when there are multiple potential vulnerabilities in a software system. If we assume statistical independence of the vulnerabilities (occurrence of an event for one vulnerability is not influenced by the state of other vulnerabilities), the total risk in a software system can be obtained by the risk due to each single vulnerability given by Equation (3). We can measure risk level as given below for a specific software system:
The method proposed here could be utilized to measure risks for various units, from single software on a machine to an organization-wide risk due to multiple software systems. Estimating the organizational risk would involve evaluating the vulnerability risk levels for systems installed in the organizations. The projected organizational risk values can be utilized for optimization of remediation and resource allocation.
A conditional risk measure for a software system could be defined in terms of the intervals between the disclosure and patch availability dates that represent the gaps during which the vulnerabilities are exposed. We can use CVSS metrics to assess the threat posed by a vulnerability. Let us make a preliminary assumption that the relationships between the Likelihood (L) and the Exploitability sub-score (ES) as well as the Impact (I) and the Impact sub-score (IS) for a vulnerability
i are linear:
N
u
m
b
e
r
o
f
vu
ln
e
ra
b
ili
ti
e
s
Time t v1
v2
v4 ,v5,v6
v7
v8
v3
v9
Learning Linear Saturation
Because the minimum values of ES and IS are zero, a0 and b0 are zero. That permits us to define normalized risk values, as
can be seen below. Now, a conditional risk, Risk_ci for a vulnerability i can be stated as:
For the aggregated conditional risk is:
A normalized risk measure can be defined as divided by the constant 1/a1b1 , expressed as:
(4)
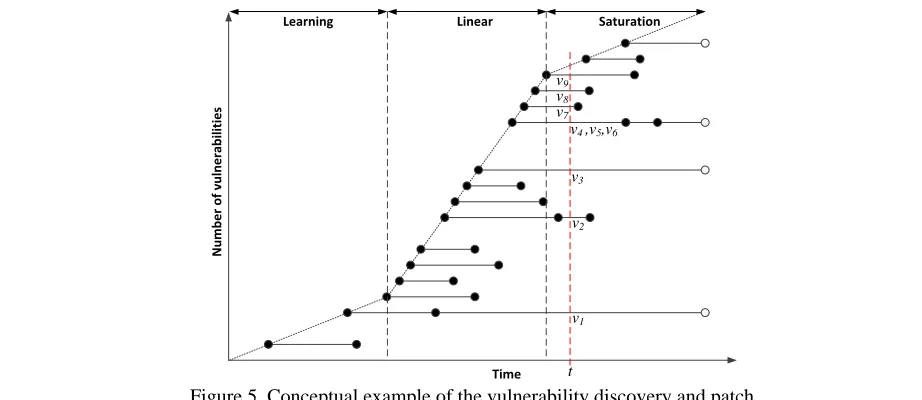
This serves as an aggregated risk measure for known and exposed vulnerabilities. Figure 5 is a conceptual diagram to illustrate the risk gap between vulnerability discoveries and patch releases on top of the simplified three phase vulnerability lifecycle in AML model [25]. In the initial learning phase, the software is gaining market share gradually. In the linear phase, the discovery rate reaches the maximum due to the peak popularity of the software, and finally, in the saturation phase, vulnerability discovery rate slows down.
In the figure, each horizontal line represents the duration for an individual vulnerability from discovery date to patch availability date. When there are multiple dots at the right side, the horizontal line represents multiple vulnerabilities discovered at the same time, but with different patch dates. A white dot is used when a patch is not hitherto available. For example, in Figure5, at time t marked with the vertical red dashed line, there are nine known vulnerabilities with no patches. To calculate the conditional risk level at that time point, each single vulnerability risk level needs to be calculated first and then added as shown in Equation (4).
6. RISK ASSESSMENT IN ORGANIZATION –WIDE
To achieve the probability that the system is in State Ri,j in Figure 4, two transition relationships are needed. One is from
the regional transition relationship and the other is a super state transition relationship. A super state i,j consists of states
having the same indices of i and j. The super state transition relationship exists among super states. Information about super state transitions is needed for the calculation of transition probabilities among super state levels, whereas the regional
transition probability relationship is required to know the likelihood of a system is in state Ri,j, after the system is arrived at a
certain super state i,j.
(5)
Equation (5) describes how we measure the risk on a software system based on the known vulnerabilities [7]. Basically, it tells that a risk in a software can be represented by probability of security breach ( ) times consequence of security breach (+++++++++++++++++++++++++). Since the equation is constructed on top of the multi-vulnerability lifecycle, it has two time points of tα and tβ. It takes tα to arrive at super state an(d), then it takes tβ to enter the exploited state
where a system has been compromised due to a specific vulnerability. In this paper, we are not explaining the equation more detail. For more information about the equation, refer to the previous study [7]. The purpose of showing Equation (5) here is to give brief background for the risk assessment in an organization-wide.
Now, given that Equation (5) is able to describe a risk level for a single software system, we could also measure a risk for a target organization which most likely has more than one software system used by employees. Potential risk in ICT computing environments is virtually based on security related software bugs which are software security vulnerabilities. If we assume that the above equation provides risk metric of a single software system, then the summation of risk values from each software system based on Equation (5) could deliver the entire risk value, representing the target ICT environment for a given organization. If so, the organization-wide risk value can be expressed as follow:
(6)
whereωis the total number of software systems in the target organization. Figure 6 shows that multiple software systems, each having multiple vulnerabilities, in a single organization. Likewise, then, regional ICT risk could also be calculated with Equation (6), based on the summation of the total risk values from each organization. Equation (7) shows the concept how to measure risk in a certain area (Riskr), like New York city. It could be expressed as follow, where is the total number of organization in a given area.
(7)
7. DISCUSSION
“One accurate measurement is worth 1,000 expert opinions” –Admiral Grace Hopper, 1906-1992 –
To reduce risk around the ICT environment, first, people must measure the risk somehow. In this paper, we first discussed about conditional risk assessment based on the software vulnerabilities with CVSS, and then we proposed a noble idea of how to measure ICT risk in a given organization or in a certain region. This proposal is based on the previous suggestion that we published which examines how to measure a single software risk [7].
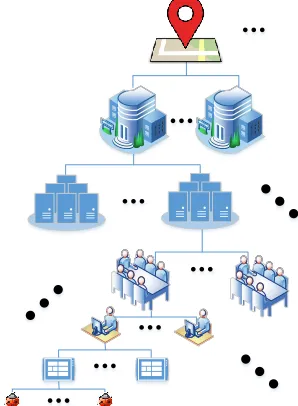
An interesting future research topic is modeling risk assessment based on recursion, so-called divide and conquer risk assessment model. For a risk assessment, to measure a certain level of risk, for instance, for measuring a company-wide ICT risk, we could divide the risk level until we reach into the depth of level which cannot be divided into anymore and can be
calculated very clearly, which is the base case. After that, we assess risk values in base cases, and walk up to the next higher level, and mergevalues. Doing this process over and over again until we reach the level that we want to assess.
Figure 7 shows the hierarchical structure for the divide and conquer risk model. Fundamentally, one organization is composed of multiple departments, each department is composed of team members. One team member uses multiple ICT devices having several software systems, and each software system contains multiple vulnerabilities.Although every organization does not consist of six levels as showing in Figure 7, it surely has some kind of a pyramid and hierarchical structure, in general.
The proposed approach should provide a systemic methods for measuring risk on computing environments. It can be used for comparing the risk levels for alternative systems, organizations, or even industrial regions. The approach can be incorporated into a methodology for allocating resources optimally by system administrators or CTOs.
ACKNOWLEDGEMENT
This research was supported by Basic Science Research Program through the National Research Foundation of Korea (NRF) funded by the Ministry of Science, ICT & Future Planning (NRF-2015R1C1A1A02036448)
REFERENCES
[1] U.S.Army distributed learning system. Mandatory Annual & Semi-Annual Online Training, Issue Date: 19 August 2014, <Online Available: https://www.dls.army.mil/2015_Mandatory_Online_Training.pdf>
[2] Lockheed Martin Corporation. Consultant Annual DoD Security Refresher, presentation material, <Online Available: http://www.lockheedmartin.com/content/dam/lockheed/data/corporate/clearanceconnection/Consultant_DOD_Annual_Refresher.pdf>
[3] C.P. Pfleeger, S.L. Pfleeger, Security in Computing 3rd ed (Prentice Hall PTR 2003).
[4] National Institute of Standards and Technology (NIST) (2001). Risk management guide for information technology systems, Special Publication 800-30.
[5] M.A. Hadidi, J.S. Al-Azzeh, B. Akhmetov, O. Korchenko, S. Kazmirchuk, and M. Zhekambayeva, Methods of Risk ssessment for Information Security Management, (2016) International Review on Computers and Software (IRECOS), 11(2), pp.81-91.
[6] A.K. Yılmaz, Enterprise Risk Optimization Model with Using Risk Analysis Tools and ANP-based Approach, International Review of Civil Engineering (IRECE), 5(6), pp.193-206.
[7] H. Joh, Modeling Software Risk Assessment Based on Multi-Vulnerability Lifecycle, International Review on Computers and Software (IRECOS), 11(2), pp.116-122.
[8] H. Joh, Y. K. Malaiya, Defining and Assessing Quantitative Security Risk Measures Using Vulnerability Lifecycle and CVSS Metrics, Proceedings of the 2011 International Conference on Security and Management (SAM), pp. 10-16, 2011.
[9] T. Arnuphaptrairong, Top Ten List of Software Project Risks: Evidence from the Literature Survey, Proceedings of the International MultiConference of Engineers and Computer Scientists 2011 Vol I (IMECS), Hong Kong, March 16-18, 2011.
[10] H. Joh, Y.K. Malaiya, Periodicity in Software Vulnerability Discovery, Patching and Exploitation, (2016) International Journal of Information Security, first online, pp. 1-18. <https://doi.org/10.1007/s10207-016-0345-x>
[11] S. Kondakci, A causal model for information security risk assessment, Proceedings of the sixth International Conference on Information Assurance and Security (IAS), pp.143-148, 23-25 Aug. 2010. <https://doi.org/10.1109/ISIAS.2010.5604039>
[12] D.P. Gilliam, Security risks: management and mitigation in the software life cycle, Proceedings of the 13th IEEE International Workshops on in Enabling Technologies: Infrastructure for Collaborative Enterprises, pp.211-216, 14-16 Jun. 2004.
[13] Y. Wang, J. Zheng, C. Sun, S. Mukkamala, Quantitative security risk assessment of android permissions and applications, Proceedings of the 27th international conference on Data and Applications Security and Privacy XXVII (DBSec’13), Lingyu Wang and Basit Shafiq (Eds.). Springer-Verlag, Berlin, Heidelberg, pp. 226-241, 2013. <https://doi.org/10.1007/978-3-642-39256-6>
[14] A. Younis, Y.K. Malaiya, Comparing and Evaluating CVSS Base Metrics and Microsoft Rating System, Proceedings of the 2015 IEEE International Conference on Software Quality, Reliability and Security, pp. 252-261, 2015. <https://doi.org/10.1109/QRS.2015.44>
[15] A. Ozment, Vulnerability discovery and software security, Ph.D. dissertation, University of Cambridge Computer Laboratory, Cambridge, UK, 2007. [16] J. Radianti, E. Rich, J. Gonzalez, Vulnerability black markets: Empirical evidence and scenario simulation, Proceedings of the 42nd Hawaii
International Conference on System Sciences (HICSS ’09), pp. 1-10, 2009.
[17] S. Beattie, S. Arnold, C. Cowan, P. Wagle, C. Wright, Timing the application of security patches for optimal uptime, Proceedings of the 16th USENIX conference on System administration (LISA ’02), Berkeley, CA, USA: USENIX Association, pp. 233-242, 2002.
[18] D.S.D. White, Limiting vulnerability exposure through effective patch management: threat mitigation through vulnerability remediation, Master’s
thesis, Department of Computer Science, Rhodes University, 2006.
[19] A. Stango, N. R. Prasad, D. M. Kyriazanos, A threat analysis methodology for security evaluation and enhancement planning, Proceedings of the 3rd International Conference on Emerging Security Information, Systems and Technologies, Washington, DC, USA: IEEE Computer Society, pp. 262–267, 2009.
[20] I. Mkpong-Ruffin, D. Umphress, J. Hamilton, J. Gilbert, Quantitative software security risk assessment model, Proceedings of the 2007 ACM workshop on Quality of protection, New York, NY, USA, pp. 31–33, 2007. <https://doi.org/10.1145/1314257.1314267>
[21] S. H. Houmb, V. N. Franqueira, E. A. Engum, Quantifying security risk level from cvss estimates of frequency and impact, (2010) Journal of Systems and Software, 83(9), pp.1622-1634. <https://doi.org/10.1016/j.jss.2009.08.023>
[22] H. Joh, Y. K. Malaiya, A Framework for Software Security Risk Evaluation using the Vulnerability Lifecycle and CVSS Metrics, Proceedings of International Workshop on Risk and Trust in Extended Enterprises (RTEE), pp. 430-434, Nov. 2010.
[24] Y. K. Malaiya, S. Y. H. Su, Analysis of an Important Class of Non-Markov Systems, (1982) IEEE Transactions on Reliability, R-31(1), pp. 64-68. <https://doi.org/10.1109/TR.1982.5221231>

![Figure 2. Generalized Model of Empirical Findings [18]](https://thumb-us.123doks.com/thumbv2/123dok_us/1412008.1653994/3.612.128.417.68.276/figure-generalized-model-empirical-findings.webp)