JETIR1508008 Journal of Emerging Technologies and Innovative Research (JETIR) www.jetir.org 3302
A Hybrid Classification Model for Diabetes
Dataset Using Decision Tree
1
P.Thangaraju, 2D.Nanthini,
1
Associate Professor , 2Research Scholar
1,2
Department of Computer Science,
1,2
Bishop Heber College,Tiruchirappalli, TN, India
Abstract—Diabetes has become a modern day life style disease affecting millions of people around the world. Data mining is growing in relevance to solving real world problems and hence this can be applied to the diabetes problem as well. The study proposes to use the UCI repository dataset called PIMA Indians Diabetes dataset and decision tree algorithms like C4.5, J48 and FB Tree. The comparison study includes parameters like efficiency, accuracy and features or nodes selected. This hybrid model enables to accurately classify the diabetes dataset and help the people providing treatment as well as those suffering from the disease.
Keyword—Diabetes,DecisionTree,J48,C4.5,FBTree,Classification
________________________________________________________________________________________________________ I.INTRODUCTION
A decision tree is a classification model, i.e. represents a relationship between some numerical or symbolic inputs (the attributes) and one symbolic output. In a decision tree, each interior node is labeled with a test build upon one attribute and each leaf is labeled with a class (one value of the output)[1]. To know the output or class associated to some input values, one starts at the top node of the tree and apply sequentially the tests encountered to select the appropriate successor[2]. Finally a unique terminal node is reached and the class stored there is assigned to this case.
The rule found in the sales data of a supermarket would indicate that if a customer buys onions and potatoes together, he or she is likely to also buy hamburger meat. Such information can be used as the basis for decisions about marketing activities such as, e.g., promotional pricing or product placements. In addition to the above example from market basket analysis association rules are employed today in many application areas including Web usage mining, intrusion detection, Continuous production, and bioinformatics[3]. In contrast with sequence mining, association rule learning typically does not consider the order of items either within a transaction or across transactions.A root node is one that has no incoming edges. An internal node is one that 1 incoming edge and two or more outgoing edges. A leaf or terminal node is one that has 1 incoming edge and no outgoing edges. Each non terminal (root and internal node) serves as a question which helps further subdivide the item until the condition is arrived at. II. RELATED WORK
Jianchao Han [4]in his research work the decision tree using WEKA has been used to build the prediction model of the type 2 diabetes data set. These models consider the Plasma Insulin attribute as the main attribute for predicting the disease.
Al Jarullah et al.,[5] has stated that diabetes of the patients is calculated by using the decision tree in two phases: data pre-processing in which the attributes are identified and second is diabetes prediction model constructed with the help of using the decision tree method.
.
B.M. Patil et al.,[6]proposed that large number of classification algorithms on the diabetes dataset have performed classification with various range of accuracies. The improvement in the prediction accuracy can also be obtained by using improved weighted least squares support vector machine (WLS-SVM) based on quantum particle swarm optimization (QPSO) algorithm.
E.G.Yildirim et al.,[7] in his research work the predictive data mining has also been applied in dosage planning for the type 2 diabetes. He also proposed two models namely Adaptive Neuro Fuzzy Inference System (ANFIS) and Rough Set theory methods. Parthiban et al.,[8] in his research work the main objective is to predict the changes of diabetic patient getting heart attack disease. In this they used Naive Bayes data mining classifier technique which produces an optimal prediction model, using minimum training set. The WEKA tool is used for this diabetic research.
Huang Y.et al.,[9]in his work the role of data mining is used to extract interesting patterns from large amount of data set and it is used in decision support, prediction and estimation.
JETIR1508008 Journal of Emerging Technologies and Innovative Research (JETIR) www.jetir.org 3303 Gaganjot Kaur.,[11] A diabetic person has risk of having the other diseases as blood vessel harm, blindness, heart disease, nerve damage and kidney disease Improved J48 Classification Algorithm for the Prediction of Diabetes.
Hussein Asmaa S, et al.,[12]. Have studied that presently 246 million people are suffering from diabetes worldwide and this number is expected to increase up to 380 million.
T.Mitchell[13] in her work the decision tree model has been build using WEKA J48 decision tree classifier on the data set. Association rule has also been implemented on the same datasets
Sugimoto et al.,[14]have in theMLR and ADTree models are compared on the basis robustness against missing values. MLR is less robust against missing values than ADTree. At low boosting and ensemble number sufficient robustness is achieved and as these numbers increase it is compromised.
Bache,K et al.,[15] had represented a hybrid method using unified Collaborative Filtering and multiple classifications, a Chronic Disease Diagnosis Recommender System approach
Geetha Ramani R et al.,[16]had presented a model for automatically detecting the disease detection in retinal image analysis approach. The data mining techniques have been used to accurately categorize the Normal, Diabetic Retinopathy and Glaucoma affected retinal images.
Ashwinkumar et al.,[17]had used a combination at classification level between these classifiers to get the best multi-classifier approach and accuracy for each data set. Diabetes and cardiac diseases are predicted using Decision Tree and Incremental Learning at the early stage.
Salama et al.,[18] have used the classification algorithms like Naive Bayes, decision tree (J48), Sequential Minimal Optimization (SMO), Instance Based for K-Nearest neighbour (IBK) and Multi-Layer Perception and compared by using matrix and classification accuracy.
Korting et al.,[19]Decision Tree Algorithm is to find out the way the attributes-vector behaves for a number of instances. Also on the bases of the training instances the classes for the newly generated instances are being found. This algorithm generates the rules for the prediction of the target variable
III. METHODOLOGY
The data are collected from real time diabetes repository. The objective of this data set is to analysis the Type II diabetes based on the given attributes. The data set consists of 10 attributes that are used to predict the type II diabetes. The detail description of the attributes are given as below, The attributes are given based on data types. The data set is based on the numeric and nominal data type. Here the Patient Id, Plasma insulin/glucose, FBS, IBS, Age, Family history, Cholesterol are given in the numeric data type and BMI, Blood Pressure, gender are given in nominal data type.
Figure 1 Decision Tree Process
INPUT
DATA PREPROCESSING
COLLECT DB
DATA CLEANING
DECISION TREE ALGORITHM
OUTPUT J48
C4.5
JETIR1508008 Journal of Emerging Technologies and Innovative Research (JETIR) www.jetir.org 3304 1. DIABETES DATASET
The variables being investigated is whether the patient shows diabetes according to World Health Organization criteria Results: The parameters used are real-valued between 0 and 1. This was transformed into a binary decision using a cutoff of 0.448. The number of training includes 576 training instances, the sensitivity and specificity their algorithm was 76% on the remaining 192 instances. In this database, there are 768 numbers of instances and 9 number of Attributes such as Number of time pregnant, Plasma glucose concentration a 2 hours in an oral glucose tolerance test, Diastolic blood pressure (mm Hg),
Triceps skin fold thickness (mm), 2-Hour serum insulin (mu U/ml), Body mass index (weight in kg/(height in m) 2 ), Diabetes pedigree function, Age (years) and Class (tested positive or negative). Several constraints were placed on the selection of these instances from a larger database. In particular, all patients here are females at least 21 years old of Pima Indian heritage.
Number of Instances: 768 Number of Attributes: 8 plus class For Each Attribute: (all numeric-valued) 1. Number of times pregnant
2. Plasma glucose concentration a 2 hours in an oral glucose tolerance test 3. Diastolic blood pressure (mm Hg)
4. Triceps skin fold thickness (mm) 5. 2-Hour serum insulin (mu U/ml)
6. Body mass index (weight in kg/(height in m)^2) 7. Diabetes pedigree function
8. Age (years)
9. Class variable (0 or 1) Missing Attribute Values: Yes
Class Distribution: (class value 1 is interpreted as "tested positive for diabetes") Class Value Number of instances
0 500
1 268
10. Brief statistical analysis: 2. LOAD DATA SET
In this project, the PIMA Indians Diabetes dataset is input from the UCI[21] repository to the algorithms. 3. IRRELEVANT FEATURE REMOVAL
In this module, first eliminate the irrelevant features in the given data set using this algorithm. Find out the relevance between each feature and the target concept. That means calculate the distance between each and every features and the target concept. The distance is calculated using Euclidian and Manhattan distance. If the distance is greater than the predetermined threshold value then it is a relevant feature. Otherwise it is a irrelevant feature. In this way eliminate the irrelevant and get the r elevant features.
4. REDUNDANT FEATURE REMOVAL
In this module which composed of three components: i. Minimum Spanning Tree Construction ii. Tree Partition or Clustering
iii. Representative feature selection
4.1 MINIMUM SPANNING TREE CONSTRUCTION[MST]
JETIR1508008 Journal of Emerging Technologies and Innovative Research (JETIR) www.jetir.org 3305 other features are removed from the relevant ones. Finally get the highly correlated features with target concept. Construct the MST from these relevant features using Prim algorithm
4.2 TREE PARTITION OR CLUSTERING
The tree partition or clustering module is used to eliminate the redundant features. After the minimum spanning tree is constructed the features are divided into clusters by using graph-theoretic clustering method. This is also called tree partitioning. The tree will be partitioned below constraint. The constraint is taking a pair of features in minimum spanning tree. Calculate the information gain of these features. If the information gains of these features is less than the target concept then partition this group of features. A cluster consists of all features. Each and every cluster is independent. Each cluster is treated as a single feature 4.3 REPRESENTATIVE FEATURE SELECTION
In this module is used to select the representative feature in each and every cluster and then select the representative feature from each cluster based on information gain. It means choose the high information gain feature from each cluster. Finally get highly correlated feature subset from high dimensional data set.
5. CLASSIFICATION
The classification model is done by using the three decision tree algorithms where the features are put as the respective nodes in C4.5, J48 and FB Tree respectively.
MODIFIED FBTREE ALGORITHM Procedure DecisionTreeLearner(X,Y,E) 2: Inputs
3: X: set of input features, X={X1,...,Xn} 4: Y: target feature
5: E: set of training examples 6: Output
7: decision tree
8: if stopping criterion is true then 9: return pointEstimate(Y,E) 10: else
11: Select feature Xi∈X, with domain {v1,v2} 12: let E1={e∈E: val(e,Xi)=v1}
13: let T1=DecisionTreeLearner(X \ {Xi},Y,E1) 14: let E2={e∈E: val(e,Xi)=v2}
15: let T2=DecisionTreeLearner(X \ {Xi},Y,E2) 16: return⟨Xi=v1, T1, T2⟩
17:
18: Procedure DecisionTreeClassify(e,X,Y,DT) 19: Inputs
20: X: set of input features, X={X1,...,Xn} 21: Y: target feature
22: e: example to classify 23: DT: decision tree 24: Output
25: prediction on Y for example e 26: Local
27: S subtree of DT 28: S←DT
29: while S is an internal node of the form ⟨Xi=v,T1,T2⟩do 30: if val(e,Xi)=v then
31: S←T1 32: else
33: S←T2 34:
35:
36: return S
J48 GENETICALLY MODIFIED ALGORITHM
JETIR1508008 Journal of Emerging Technologies and Innovative Research (JETIR) www.jetir.org 3306 x_{2,i}, ...,x_{p,i}) , where the x_j represent attributes or features of the sample, as well as the class in which s_i falls.The J48 algorithm chooses the attribute of the data that splits its set of into subsets enriched in one class or the other. The splitting criterion is the normalized information gain (difference in entropy). The attribute with the highest normalized information gain is chosen to make the decision. The algorithm then recurses on the smaller sublists.
ALGORITHM STEPS
1. Check for base cases - I 2. For each attribute - a
1. Find the information gain from splitting on a 3. Let a_best be the attribute with the highest standardized gain 4. Create a decision node that splits on a_best
5. Recursive on the sublists obtained by split on the best and add those nodes as children of nodes. C4.5 ALGORITHM
C4.5 is an algorithm used to generate a decision tree developed by Ross Quinlan. C4.5 is an extension of Quinlan's earlier ID3 algorithm. The decision trees generated by C4.5 can be used for classification and for this reason, C4.5 is often referred to as a statistical classifier.C4.5 builds decision trees from a set of training data in the same way as ID3, using the concept of information entropy.
This algorithm has a few base cases.
i. All the samples in the list belong to the same class. When this happens, it simply creates a leaf node for the decision tree saying to choose that class.
ii. None of the features provide any information gain. In this case, C4.5 creates a decision node higher up the tree using the expected value of the class.
iii. Instance of previously-unseen class encountered. Again, C4.5 creates a decision node higher up the tree using the expected value.
IV RESULTS AND DISCUSSION
It has been found that of the three decision tree classification algorithms, (i) different values result in different classification accuracies; (ii) there is a value where the corresponding classification accuracy; and (iii) the values, in which the best classification accuracies are obtained, are different for both the data sets, the FB Decision Tree is found to be the best. The results and findings are tabulated below Table 1.
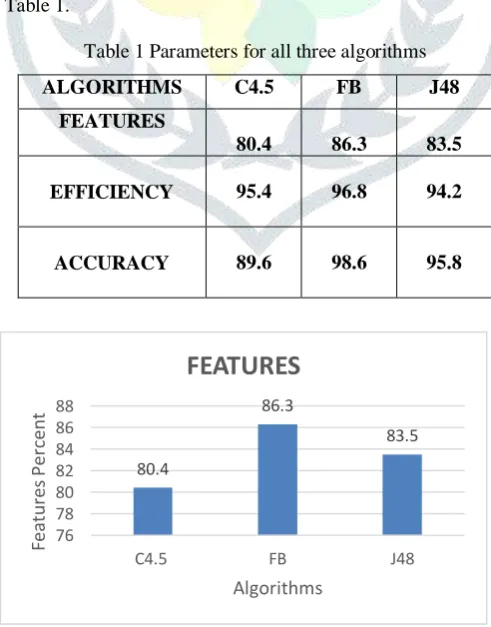
Table 1 Parameters for all three algorithms
ALGORITHMS C4.5 FB J48
FEATURES
80.4 86.3 83.5
EFFICIENCY 95.4 96.8 94.2
ACCURACY 89.6 98.6 95.8
Figure 2 showing the features generated 80.4
86.3
83.5
76 78 80 82 84 86 88
C4.5 FB J48
Fea
tu
res
P
er
cent
JETIR1508008 Journal of Emerging Technologies and Innovative Research (JETIR) www.jetir.org 3307 Based on the features it has been found that FB tree has the most nodes and hence the most features, next comes J48 and then C4.5 showing in Figure 2.
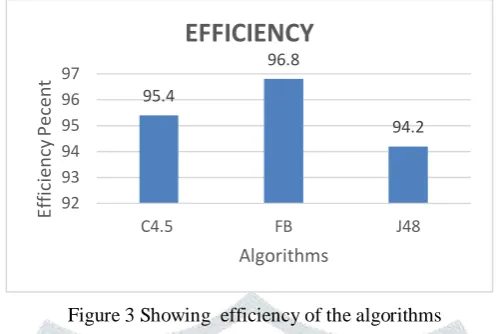
Figure 3 Showing efficiency of the algorithms
In terms of efficieny again FB Tree shows the maximum efficiency with 96% closely follows by J48 with 84% showing in Figure3.
Figure 4 Showing Accuracy of the algorithms
When it comes to accuracy the J48 is termed as most accurate of the three is showing the Figure 4
This means the results are the best, and the performance is optimal for FB tree. For each of the three decision tree algorithms, although the values where the best classification accuracies are obtained are different for various parameter in the dataset, the commonly accepted one is FB tree because the corresponding classification accuracies are among the best or nearly the best ones. When determining the value, besides classification accuracy, the proportion of the selected features are taken into account as well. V. CONCLUSION
The study thus successfully shows the comparison of the three decision tree classification models for the pima Indians diabetes dataset and shows the tree structure formed enabling users to take accurate decisions based on the input parameters. Further FB tree is found to be the most efficient and accurate in terms of mining features. In future the models may include other decision support systems with parameters from clinical tests aiding prediction of the diabetes.
REFERENCES
[1] Han J. Kamber, M, "Data Mining; Concepts and Techniques", Morgan Kaufmann Publishers, 2012. [2] Margaret H. Dunham, "Data Mining Techniques and Algorithms", Prentice Hall Publishers, 2012.
[3] S.Priya, "An improved data mining model to predict the occurrence of Type 2 diabetes", Proceedings published in IJCA, 2012.
[4] Han, Jianchao, Juan Carlos Rodriguez, and Mohsen Beheshti, "Diabetes data analysis and prediction model discovery",
Second International Conference on Future Generation Communication, pp. 96-99, IEEE, 2008.
[5] Al Jarullah, Asma A, "Decision tree discovery for the diagnosis of type II diabetes", International Conference on Innovations in Information Technology (IIT), pp. 303-307, IEEE, 2011.
[6] Patil, Bankat M., Ramesh Chandra Joshi, and Durga Toshniwal, "Hybrid prediction model for Type-2diabetic patients" ,Expert systems with applications, pp. 8102-8108, (2010).
[7] E.G.Yildirim, A.Karachoca and T.Uea, "Dosage Planning for diabetes patients using data mining methods", science direct, procedia computer science, pp. 1374-1380, 2011.
95.4
96.8
94.2
92 93 94 95 96 97
C4.5 FB J48
Ef
fi
ci
ency
P
ec
ent
Algorithms
EFFICIENCY
89.6
98.6
95.8
85 90 95 100
C4.5 FB J48
A
cc
ur
acy
P
er
cent
JETIR1508008 Journal of Emerging Technologies and Innovative Research (JETIR) www.jetir.org 3308 [8] Parthiban, G., A. Rajesh, and S. K. Srivatsa, "Diagnosis of heart disease for diabetic patients using naive bayes
method" ,International Journal of Computer Applications,pp. 7-11, 2011.
[9] Huang, Yue, Paul McCullagh, Norman Black, and Roy Harper, "Feature selection and classification model construction on type 2 diabetic patients’ data", Artificial intelligence in medicine, pp. 251-262, 2007.
[10] Huang, Feixiang, Shengyong Wang, and Chien-Chung Chan, "Predicting disease by using data mining based on healthcare information system", International Conference on Granular Computing,pp. 191-194, IEEE, 2012.
[11] Kaur, Gaganjot, and Amit Chhabra, "Improved J48 Classification Algorithm for the Prediction of Diabetes" ,International Journal of Computer Applications,pp. 13-16, 2014.
[12] Hussein Asmaa S,Wail M. Omar, Xue Li, and Modafar Ati, "Efficient Chronic Disease Diagnosis prediction and recommendation system", International Conference on Biomedical Engineering and Sciences, pp. 209-214, IEEE, 2012. [13] T.Mitchell, "Machine Learning", McGraw -Hill, New York- 2 edition, 2010.
[14] Sugimoto, Masahiro, Masahiro Takada and Masakazu Toi, "Comparison of robustness against missing values of alternative decision tree and multiple logistic regression for predicting clinical data in primary breast cancer", International Conference on Engineering in Medicine and Biology Society, pp. 3054-3057, IEEE, 2013.
[15] Bache, K. & Lichman, M. (2013). UCI Machine Learning Repository [http://archive.ics.uci.edu/ml]. Irvine, CA: University of California, School of Information and Computer Science.
[16] Geetha Ramani R, Lakshmi Balasubramanian, and Shomona Gracia Jacob, "Automatic prediction of Diabetic Retinopathy and Glaucoma through retinal image analysis and data mining techniques", International Conference on Machine Vision and Image Processing, pp. 149-152, IEEE, 2012.
[17] UM, Ashwinkumar, and Anandakumar KR, "Predicting Early Detection of Cardiac and Diabetes Symptoms using Data Mining Techniques", pp:161-165, IEEE , 2011.
[18] Salama, Gouda I., M. B. Abdelhalim, and Magdy Abd-elghany Zeid, "Experimental comparison of classifiers for breast cancer diagnosis",International Conference on Computer Engineering & Systems (ICCES), pp. 180-185, IEEE, 2012. [19] Korting, Thales Sehn, "C4. 5 algorithm and multivariate decision trees", Image Processing Division, National Institute for
Space Research–INPE Sao Jose dos Campos–SP, Brazil 2006. [20] www.cs.waikato.ac.nz/ml/weka/