Study and Evaluation Facial Expressions
Recognition Methods
1
Mahsa Naeeni Davarani; 2 Touraj Banirostam; 3 Hayedeh Saberi
1
Department of Computer Engineering, Islamic Azad University, Central Tehran Branch, Tehran, Iran
2
Department of Computer Engineering, Islamic Azad University, Central Tehran Branch, Tehran, Iran
3
Department of Psychology, Islamic Azad University, Roudehen Branch, Roudehen, Iran
Abstract - In recent years, facial expressions recognition has automatically attracted attention in car vision and non-linguistic communications due to its extremely important applications. The reason of the popularity is extensive applications in various fields. As a result, the implementation of Facial expressions recognition system is very important. For this purpose, various methods such as neural network, neural-Fuzzy network, fuzzy algorithms, deep learning, etc can be used. Various simulations provide different accuracy of facial expressions recognition. In this paper, different ways to identify facial expressions recognition are examined and compared in two ways, quantitative (accuracy of each method) and qualitative (statistical society, advantages, disadvantages, goals and obtained results from the method). This study can help researchers choose the best method for their research and can be familiar with the advantages and disadvantages in each method.
Keywords - Facial expressions recognition, image based methods, feature-based methods, EEG-based methods.
1. Introduction
lthough serious studies on the face recognition is related to the nineteenth century and the work of Darwin and Galton, but in the sixty decade, Baldosu produced the first automatic face recognition machine.
In recent years, facial expressions recognition has automatically attracted special attention to machine vision and non-linguistic communication due to its very important applications. One of these applications is the study of psychology, robotics, virtual reality, videoconferencing, facial animation, and study of customer satisfaction and information and web services [1]. Despite the existed improvements in facial expressions recognition, providing the ways to recognize the accuracy is interesting. Effort to improve current methods and provide new methods are always important and various efforts have been made in different parts of a facial expressions analysis system.
Looking at the literature, the importance of this issue and the need to improve and provide methods to address all kinds of available challenges from the most important to
the most none important in order to achieve the final goal of this field, i.e. the development of analysis system of ideal facial expressions is quite obvious.
The feature selection is used extensively on many issues, including face recognition, pattern recognition and machine learning [2]. One of the most important issues in the features election is the quality examinations of the presented parameters [3]. The feature selection among all the available features can influence directly on the efficiency and outcome [3].
Viola Jones algorithm. The second step is the face modeling. For this, the introduced methods in the second part will be used. The third step is computational analysis based on artificial intelligence that uses a large data bank. The computational techniques of facial expressions recognition essentially determine the key points of the face and obtain the information from geometry of these points. The features of emotional recognition can be constant, dynamic, and point-centered (geometric) or region-centered (appearance). Geometric features are extracted from the important face component such as the mouth and eyes. The face position like state of important points such as the mouth and eyebrows and the direction of the head are some items that are used for analysis. This computational method requires a large amount of data. These data should include precise images with labels and have usability to determine facial features. There are a number of databases with necessary factors that it can refer to encoded database of the Cohn-Kanade AU facial expressions [4].
In the following section, first, the applications of face recognition are introduced in the second part. In the third section, face recognition methods are then categorized and the methods will be compared in the fourth part.
2.
Application
for
recognizing
facial
expressions
Face recognition is basically used on two verification and identification modes [7].
Verification: Generally described as an adaptation system because the system tries to match the provided image with the individual with a particular image in the file.
Identification: In this state, the presented image is matched to other images in the database. Identification systems are described as one-to-many matching systems (n), where n is the total number of existed images in the database.
There are several application areas in which facial recognition is used for these two purposes, listed below in several areas [7]:
• Security: (access controlling to buildings, airports / ports, ATMs and border inspection posts, computer / network security, email authentication, multimedia workstations)
• Supervision: A large number of CCTVs can be used to monitor known criminals, drug offenders, etc., and when one of these happens, the authorities can be notified.
• General Identity Verification: Election Registration, Banking, E-Commerce, Newborn Identification, National Identity, Passport, Driving Certificates, Employee Identification Cards.
• Criminal justice systems: reservation systems, post-event analysis, forensics
• Checking the image database: Search of image databases from licensed drivers, beneficiaries, missing children, immigrants and police reservations
• Smart Card Applications: In contrast to maintaining a database of images, a printed image of the face can be stored on a smart card, bar code, or magnetic tape, which is possible to identify through live image matching with a stored pattern.
• Multimedia environments with human adaptive computer interfaces, video profiling (face tagging in video)
3. Introduction and categorization of facial
recognition methods
Facial expressions are the most important means of communication in face-to-face interactions. Given the ability to recognize emotional states of people from their faces to computer applications is an important and difficult task. In high volume data, the need for data diminution is needed to select the optimal feature. According to conducted researches, analysis algorithm of main components is used to reduce data dimensions in many other fields [7].
If it assumes, there is a dataset with several variables that each variable has various dimensions. Analysis algorithm of main components is helpful method for choosing features from complicated database by reducing variable number, finding communicative structure among data and removing low-important features. Computing rate reduce using reduction of data dimension. As a result, it increases system efficiency. First, it is better to explore dimension reduction methods.
3. 1 Dimensionality Reduction
reduction is one of curial level of pre-processing in data mining and makes advance efficiency and accuracy. Dimensionality reduction has benefit like accuracy in dataset categorization, increase computing efficiency and better imaginary. In study [3], it concentrates on methods investigation which is used to reduce dimensionality reduction in dataset with sacrifice categorization accuracy. Their observations show that methods which are used to reduce feature, belong to special set of data i.e. in each studied paper, dimensionality reduction method is implemented on special part of dataset, not on all. As shown at figure 1, used algorithms are categorized to reduce dimension to classes of feature ranker, feature evaluator, dimensionality reduction, clustering algorithms. Each of these types of algorithms has its own strengths and weaknesses. Depending on the combination of used algorithms, four types of methods have been identified. These four methods are evaluation and feature ranker, DR linear algorithms, DR nonlinear algorithms and clustering based on feature selection.
Figure 1. Classification of dimensionality reduction methods [3]
3.1.1. Feature evaluating and ranking algorithm
Selecting features is the selection process of a sub-set of features among the larger number of features from a data set. Feature selection is done to identify and remove unrelated and non-important features. Methods for evaluating and ranking features are widely divided into Filters and Wrappers. In the filter method, the subtypes of the features are ranked independently of the classifier (predictor). If this method only examines a variable at a
time, it is called single variable, otherwise, if there is more than one variable simultaneously, this method is called multivariable. Filter methods use proxy scales to evaluate and grade a subset of features, which make increase this method speed, but generally reduces its predictive performance than to the Wrappers method. The commonly used scales in filtering method are shared information, Pearson correlation coefficients, increasing information and shared point-to-point information. In Wrappers method, a classifier (prediction model) is used to evaluate and grade various features or feature subtypes. The prediction error rate in this model is calculated using any feature subset to give point to that subset.
Common methods of Wrappers method can include fragmented linear network algorithms, branch and bound genetic algorithms and stepwise regression. Filters are more efficient computationally than Wrappers, but Wrappers show better performance in providing the best features subset for a classifier.
Diwi Suriakumar, Andrew H. Sang and Kinsang Liu, [6] suggested in their research that critical dimensions can be identified by a repeat method that uses the Q-square score for the evaluation and ranking algorithm. In their testing, first, the accuracy of the dataset classification was calculated using all the features. The Q-square score of all features are computed according to the class and the features are ranked based on the Q-square score from the big to the small. Then the feature with the least important is deleted from feature set and the classification accuracy is recalculated. The removal of the least important feature continues as long as the accuracy of the classification is significantly reduced and does not increase with the removal of further features.
3.1.2. Linear Algorithms of dimensionality reduction
In the selection of a feature subset, a miniaturized subset of the main features is obtained, but in linear reduction of dimension, we have achieved a linear combination of initial properties that can reflect the initial data on a smaller space. The analysis of the main PCA component is the most common preprocessed technique that reduces the feature space by finding linear relationships among different attributes. The PCA finds the main components that represent the linear combination of the original features in orthogonal terms and display the most variance in the data. In general, achievement to high variance is possible only using a few of the main components. To find the main components, the covariance matrix of main data is obtained and special values are calculated. The main components are the eigenvectors that match with the largest values. Then the main components are calculated as eigenvectors of Cov (M). In PCA, the covariance between each pair of features is zero and the features are classified according to the higher variance, respectively. The eigenvectors s Cov(M) provide a smaller set of orthogonal axes that can be considered as the initial axis. Another commonly used linear DR technique is linear differential analysis (LDA). This method answers the question of whether the dimensions of the highest variance provider are in fact the same relevant and appropriate dimensions. The purpose of the LDA is to maintain the maximum possible differential information and, at the same time, the operation of reduction size. This method takes into account both the dispersion within the class and between the classes, and attempts to find the axis in which the classes are separated in the best direction. The transition occurs in such a way that the dispersion between classes is maximized but the dispersion within the floor is minimized. The transition occurs as the dispersion between classes is maximized but the dispersion within the class is minimized. In a practical scenario, in order to reduce the dataset dimensions, the PCA is first used to find the main components, and then the LDA is used to find the axis that it separate best classes the best.
3.1.3. Non-linear algorithms of dimensionality reduction
While PCA is the most common and most popular dimensionality reduction algorithm, especially in bioinformatics, nonlinear methods of dimensionality reduction are also gaining popularity. Because the PCA is less efficient for data sets such as the genes and proteins presentation that has inherently non-linear structures. When the PCA tries to transform nonlinear structure into a low-dimensional space, most of this structural information is lost due to the use of linear distance scales, such as Euclidean distance. On the other hand, non-linear methods of dimensionality reduction such as spectral clustering, isometric mapping, special Laplace maps, and PCA cores use special methods to maintain nonlinear structures of data and transfer them simultaneously to less dimensional space [6].
3.1.4. Clustering algorithm
Clustering algorithms: Clustering is one type of unsupervised learning in which data groups are based on similarity scales, like the existence of similar objects in groups. The most common methods for clustering K meanings and clustering are genetic regulation. The most common methods for clustering are K-means and hierarchical clustering. These algorithms use distances such as the Euclidean distance as a similarity scale. Choosing a subset of feature is difficult work because of unsupervised learning due to the unavailability of the information in the preceding class [3].
Table 1. Comparison of dimensionality reduction methods[3]
Methods Strength
Weakness
Feature evaluation algorithms and feature ranking
algorithm High
classification accuracy
Easy implementation - Long computing
time - Disproportionate
for uncontrolled learning data with a
large number of dimensions.
Linear dimensionality
reduction algorithms Short computing
time Low sensitivity
to noise
-Difficult assessment of the covariance matrix.
- It assumes that features with the most variance are the most important
- Depending on the data proportionate.
Nonlinear dimensionality
reduction algorithms Dimensionality
reduction efficiently for datasets that non - linear structure. - High complexity
of algorithms - High computing
time
Clustering algorithms - Exact detection
of feature subsets - Usability for
both learning with control and
without control - It is only
applicable for a few numbers of
datasets. - It isn't helpful for
datasets with non- linear structure.
3.2. Face Recognition Methods
Facial expression recognition is based on three main methods, including image – based methods, appearance-based methods, and EEG-appearance-based emotion recognition method. Attribute-based methods itself include three approaches (pattern-based, appearance-based and geometric-based). Image-based methods also include three approaches, fuzzy algorithms, neural networks, and so on.
Figure2. General view of facial detection methods
3.2.1. Attribute-based methods
Attribute-based approaches use facial features for their recognition process. Hjemal and Low later categorized this method into three classes: low level analysis, feature analysis, and active form model [5].
• Low level analysis: in [8] implementation of a method, an edge display method is used to diagnose facial feature in drawing lines by
detecting changes in pixel attributes. In [9], further development of this method is conducted for human head design. Edge – based methods concentrate on labeled edges that are adapted to confirm to facial method. Generally, it seems that the eyebrows, around the eyes (Gogh) and the lips are darker than the surrounding area, and therefore extraction algorithms can be searched for the minimum points. In contrast, the local maximum can be used to indicate the face bright points such as the tip of noise. Then the identification is carried out using a gray scale of low level of thresh-holding.
• Feature Analysis: This method uses more information about the face and eliminates created ambiguities by low-level analysis. The feature analysis includes search strategies for sequential features based on the relative position of individual facial attribute, which first prominent features of the face are determined and making it possible to be assumed attributed that are less prominent.
• Active shape models: This method is used to define the appearance of the higher level and the physical appearance of attribute. These models were developed by Tim Cootes and Chris Taylor in 1995. ASM is a model of objects forms that repeatedly converts form to fit with an example of an object in a new image. It operates in two steps:
o Look at the image of any point
around for a better position than that point.
o Update the model to the best
adaption for these new found locations.
3.2.1.1 Pattern-based approach
remain on the face for a long time. This problem can greatly reduce the realism of communication factors. They focused on analyzing how facial emotional activity changed over time. Their goal was to find time patterns of face activities for six basic senses in order to improve the simulation of the incidence of continuous faces states on a three-dimensional face. To do this, they initially analyzed the video database automatically using facial recognition techniques.
To do this, they initially analyzed the video database automatically using recognition techniques of facial expression. Their hypothesis is that facial expressions appear successively when creating a sense, and their severity decreases over time. For example, when a happy event happens to a person that it makes him happy, the person's happy smile is not the same at all times, and will reduce as time goes. To confirm this hypothesis, the movements of facial members were detected and automatically matched with predefined patterns. Based on time patterns, they presented a plan for representing continuous emotional states by a communication agent on a three-dimensional face. The results indicated that the received facial expressions were more natural and more reliable. The process of the emotional activity analysis of a face in the research is as follows. The system input is a video that is processed frame to frame by the system.
For each frame, the face recognition system detects the face and determines its position. Then the ASM Fitting method was used to perform the fitness and to achieve the ASM face mode. The normalization unit of the face uses this state in this method to normalize to change facial expression to normal size. Finally, it investigates the intensity of AUs related to each of the underlying basic senses using the obtained facial features in ASM methods and then extracts the face normalization.
3.2.1.2 Appearance-based approach
Fengxi Song and et.al. [2] propose specifically usage of the principal component analysis PCA for feature selection. PCA has been widely used in various fields such as image processing, pattern recognition, data compression, data mining, machine learning and computer vision. The presented idea and method in this study are not only completely new and innovative, but also is simple and perceptive. As we know, PCA is a powerful method to display and can capture the most varied components of data related to samples. The principal component analysis method was used for facial recognition, image noise reduction and machine learning.
PCA has also been used as a basis method for testing new methods. On the other hand, almost all of these studies focus on PCA, its application in the area of extracting features. On the other hand, almost all of these studies about PCA focus on its application in extraction feature area. In other words, most of the PCA applications are limited to transferring samples to a new space and using a view with lower dimension later from the new space for marking. Since the extraction results of feature is an integrated reflection of the primary feature of the samples components, it appears that the PCA cannot perform feature selection and no one has ever attempted to perform this. However, in [6], for the first time, it was indicated that the use of the PCA is practical to select feature and can use a number of features among all the feature components of initial sample. This was done by examining the transfer of PCA from a numerical analysis point of view. The proposed method in fact considers the problem of feature selection from the point of view of numerical analysis. This method uses eigenvectors s to evaluate the effect of each feature components on the results of the feature extraction. The result of the feature extraction of an arbitrary sample is a linear combination of all the feature components of this sample and generates vector inputs of related to coefficients. This means that in this linear combination, in fact, the coefficient of the feature component of the sample i is actually the i input of the eigenvectors. As a result of this matter, if the i input has a small net value, the i feature of all samples will have little statistical effect on the result of the feature extraction. There are usually more than one feature component, which are small (and therefore have little effect). For example, if the samples are images such as facial images, the samples have large dimensions and the experimental results show that a large number of feature components have little effect. Therefore, since this method eliminates all the feature components with low effect; this method reduces the size of the prototype considerably. It should be noted that their method performs a feature selection using a very low computational cost, while traditional method of feature selection usually have a high computational complexity.
larger eigenvalue instead of smaller eigenvector. Second, if only a special vector is used to evaluate the importance of the various feature components from the prototype, the evaluation results will not be the representative of whole sample. Fengxi Song uses several eigenvector to evaluate the importance of different feature components. This allows them that they have more solid and reliable evaluation results. The obtained results are shown in table 2.
Table 2.error and accuracy rate in PCA method [12]
Error rate accuracy rate
Database
0/5047 99/4952
AR
3.2.1.3. Geometry-based approach
In [11], a set of 125 geometric features has been proposed for the classification of facial expressions. Research [12] also examines the performance of geometric feature along a neural network on a visual sequence. In other researches of ASM, polygonal attribute, linear and centrifugal features have been used. G. Palestra and et.al. [13] have presented an innovative and automatic method to help diagnose facial expressions from a consistent image that uses a combination of features derived from geometric information. In fact, this method uses simultaneously linear, centrifugal, polygonal and angular features to improve the accuracy of diagnosis. As a first step in this process, first, the faces are diagnosed and the 20 important facial points are identified automatically using the extractor of facial key points. In following, identified points are processed to create sets of 32 facial geometric features based on linear, centrifugal, polygonal, and angular data. In addition, they also focus on the classification stage through performance analysis with three different ways that usually used to do this. In fact, the functions were examined using supporting vector machines (SVMs), Random Forest and k nearest neighbors. All of these experiments were performed on the expanded Cohn-Kanade (CK +) face-to-face database. Facial recognition and extraction of critical points of the face are considered as the first steps. Facial recognition has been performed by the Viola-Jones algorithm [13]. Then the diagnosed face is processed by an extractor of the main points of the face that uses the STaked Active Mode model (STASM). STASM uses the active mode model to determine the position of 77 important facial points through a simplified type of SIFT descriptors and uses Multivariate Adaptive Regression Spline (MARS) to match the descriptors. This modified SAM is fast and has better performance than existing techniques for automatically identifying facial points. After this stage, 32
geometric feature are calculated. More precisely, the precise observation of facial expressions and extracted critical points from STASM is defined collection of 32 useful feature to identify facial expressions.
To reduce computational costs, the face is assumed to be symmetrical on the two sides of the vertical axis that crosses the center of the face and 20 STASM points are used. More precisely, for the upper part of the face, which includes features related to eyes, eyebrows and species, only one side (the left side of the face) is considered. On the other hand, the lower part of the face, which includes nasal and oral attributes, considered two parts of faces. The classification is the final stage of the recognition process facial expression that analyzes the feature vector to predict facial expressions. In recent years, a large number of classifiers have been introduced, but each of these classifiers shows a different performance depending on the specific features of the input data. In [13], a new set of feature has been proposed including uncertainty about the best method to perform a classification stage. To answer this issue, three different classifications were tested: support vector machines (SVM), random forest RF and k-NN. Obtained results from [13] have been shown in Tables 3 and 4, as it is seen, RF has the highest accuracy.
Table 3. Recognition Results of six facial expression [13]
Error rate accuracy rate
Methods
17.59 82/41
Multi-SVM
25.24 74/76
K-NN
Table 4. Recognition results of 7 facial expression [13]
Error rate accuracy rate
Method
29.06 70/94
Multi-SVM
28.04 71/96
K-NN
7.76 92/24
RF
3.2.2 Appearance based methods
recognition is prescribed as a general pattern for recognition model. An image-based approach contains many approaches, such as neural networks, fuzzy algorithms and support vector machine [7].
3.2.2.1 Fuzzy algorithm
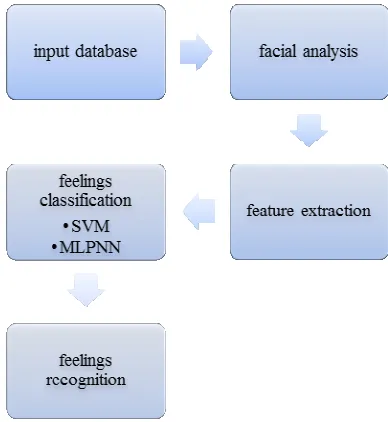
Research [7] use a comprehensive method composed of fuzzy method and PCA methodology for strong and efficient recognition of human emotions. The face plays an important role in the transmission of emotions. Therefore, in order to identify emotions, the first step is extraction of a human face from the general picture using Face Fuzzy Detector and Securitization (FFDAS). Then the PCA technique is used to simplify the dataset to a lesser extent while maintaining the features of the total data. They offer a non-monitoring detection pattern system that operates independently of complex geometry and computation. In this method, the logic is used to diagnose and classify the face.
PCA is also used to detect the emotions; this method is based on information theory, in which the useful information about a face is extracted as efficiently as possible. In following, the Euclidean distance is applied to classify emotions, which determines the similarity degree between the training images and the testing images. The emotion recognition system of this research is shown in Figure 3:
Figure3. Process of sensing recognition system [14]
Facial images were collected with different emotions such as neutral, sadness, anger, hatred and wonder, as well as image without face. The database is divided into two
categories: one training dataset (includes 40 images) and one testing dataset (includes 12 images). The used images in the study are derived from the FACES database linked to the Max Planck Institute. This database consists of images of people in different age groups and different sexes that show different feelings. In the next step, both training images and testing images pass the following processing steps: 1. Normalize image size 2. Removing noise 3. Minimize background 4. Light control. After processing, images were sent to the FFDAS to reduce the work space to form a more precise working space by identifying the face and cutting the extra space around it. RGB images are first converted to the YCbCr space. Then the Cb and Cr values are applied to separate the skin color. The Sugeno fuzzy inference system is designed based on a set of rules that defined by the Cb and Cr values , the YCbCr color model as inputs of the fuzzy system and skin pixels as output. In following, PCA is used to extract unique features of the face that are important in differentiating among different human emotions. The next step is to calculate Euclidean distance. The main idea, "Dimensionality reduction along with calculation of space in subsidiary space", is one of the most important tools for complexity management and finding hidden patterns among massive volumes of data in real world. The obtained results from this study [5] are shown in Table 5.
Table5. error and accuracy rate in fuzzy method and PCA [14]
Error rate accuracy rate
Method
3/34 96/66
fuzzy
and PCA
Research [15] has implemented a Mamdani fuzzy system to diagnose facial expressions. The system recognizes six main modes of face that are: fear, wonder, pleasure, sadness, hatred and anger. Normal or Neutral mode is another form of facial expression that is often categorized as one of the main modes of the face. Therefore, there are seven modes in the total number of facial expressions output for this system. They used the top-down method to diagnose facial expressions.
areas related to the eight main components of the face mode. In extraction phase of feature related to the eight major extracted phases were preprocessed to determine the values of the facial activities for each region. In the next step, the values of facial activity (which range from 0 to 10) are given to a mamdani fuzzy system to achieve the final output of the face. The steps are briefly mentioned:
• PPP Pre-Phase Phase: In this phase, the face is separated from the background by structural components. Then this image is graded according to the system specification [15].
• Region Extraction Phase (REP): The extracted face then enters the region extraction phase. They have determined eight active areas active to form the face, including eyes, eyebrows, nose, forehead, cheeks, lips, teeth and chin. They define nine main lines to extract region. These lines include: above the eyebrows, middle of the face, above the eyes, the bottom of the eyes, the inner corner of the eyes, middle of the face, the outer edge of the lip, the bottom of lip, the top of the lips. The feature extraction phase uses these extracted regions to discover facial activity values for all facial activity elements. The specialized algorithms were modeled to find the facial activity values and are measured on a scale from 0 to 10 [5].
• Facial Expression Recognition Phase (ERP): ERP is a mamdani-type fuzzy rule system. In their research, a new algorithm is presented for the recognition of lip corners. This algorithm has four steps. In the first stage, enlarging the lobe area in the binary image of the mouth is to focus more on the region of the lips. Lips corners are dark areas of the enlarged region of the lips, so they allocated high capacity to these dark points. The second stage includes the implementation of illumination map on the enlarged area of the lips. In the third step, the columns of mapped image of the lips are scanned vertically and the pixels with appropriate light are selected as the mouth. In the fourth stage, the central line of the mouth is identified and, based on this line, the
change and movement occurred on the corners of the lip are calculated [5].
• Input and output: eight main components of face activity are for output of facial expression, eyes, eyebrows, forehead, nose, chin, teeth, cheeks and lips. One of these extracted regions is compared with available matters in sample database and then state of these face components is given to fuzzy system as input. This inputs classified from 0 to 10. These inputs were imagined using membership function of MF input like related fuzzy sets. Inputs that have three membership functions, have two function in highest degree and one function in middle degree. Inputs with two functions have one function in two highest degrees. Output facial expression has seven membership functions that show main facial expression. Their distinct system feature is design of "membership function of facial expression". These functions have scale from 0 to 10. This classification type is facial expression related search [15].
• Fuzzy rules: used fuzzy rules in system [15] can be divided to two class: main rules (classifier) and slight rules (non classifier). Main rules classify six essential facial expressions. They modeled implementation of six essential facial expressions as well as combination of different states of face member. Main rules indicate general state of all main facial expression. Slight rules cause system reflexion by ability to transfer easily among face similar expression. Face similar expression is expressions of face that are overlapped each other in some cases, expressions like fear-wonder, anger, hatred and enjoy - wonder.
Obtained results [15] is observable in table 6 and figure 4.
Table6. error and accuracy rate of Mamdani fuzzy method [15]
Error rate Accuracy
rate Expression Method
8/7 91/30 Wonder
Mamdan i fuzzy system
7 93
Hatred
4/96 95/04 Enjoy
8 92
Anger
7/25 92/75 Fear
8 92
Sadness
91.3 93 95.04 92 92.75 92
8.7 7 4.96 8 7.25 8
0 20 40 60 80 100
accuracy rate errorrate
Figure4. error and accuracy rate of Mamdani fuzzy method
Average of error and accuracy rate in Mamdani fuzzy method[15]is shown in table 7.
Table 7. average of error and accuracy rate of Mamdani fuzzy method
Error rate accuracy rate
Method
7.32 92/68
Mamdani fuzzy
system
3.2.2.2 Neural network
I. Perikos and et.al. [16] provide a sense recognition system through face to determine sense state. This system analyses facial expressions and detect six basic feelings based on Ekman's definition according to a analysis and detection location based method. First, this system recognizes human face using Viola-jones algorithm by observing a new image. Then transformation measure
different points of face such as eyes, eyebrows and mouth and extract geometry features like location, length, width and shape. These extracted features indicates transformation caused by face expression and according it, a classification pattern that composed of support vector machine (SVM) and a classifier of multilayer perceptron neural network, recognize sense content of one of facial expression. First SVM classifier detects facial expression by being neutral or sensing and then MLPNN detect and classify sensing state of face in suitable sensing group.
Figure5. feeling recognition process [16]
pattern, SVM determine this issue whether facial expression is sensing or not, and MLPNN detects sensing content of facial expressions which recognize sensing SVM. Evaluation of [16] was conducted on JAFFE and Kanade Cohn database and obtained results in table 8 about system performance in recognition of face sensing expressions and detection of their sensing content based on Ekman scale is helpful.
Table 8. Results of SVM method performance [16]
Total Cohn
Kanade JAFFE Parameter
96.4 100
92.3
accuracy
99.2 100
98.3
Resolution
96.9 100
93.4
Sensivity rate
95 100
90
Feature
First, system performance related to face facial expressions was evaluated as neutral or sensing. Results in table 9 show that system has optimal performance to determine expression or lack of feeling expression in facial expression. In fact, SVM had great performance in Kanade Cohn database and shows 100 % accuracy in all factors. The reason is that Kanade Cohn presents neutral facial expressions as suitable and coordinated case.
Table 9. Results of MLPNN method performance [16]
Total Cohn Kanade
JAFFE Parameters
%85.5 %81.4
%89.7
Accuracy
average
%86.7 %82.8
%87.3
resolution
%86.7 %81.4
%88.9
F size
Second part of evaluation studies performance of system MLPNN mechanism to recognize feeling content of one feeling expression of face. Facial expressions which are emotional and are detected probably using SVM, are used for this part of test. According to being multi group of output, accuracy, precision and scale criteria were applied. MLPNN performance is satisfied to recognize feeling state of a facial expression. In table 10, we observe
that results of this evaluation are better for JAFFE database because models of this database displays emotions with more powers. In fact, in many cases, models of JAFFE database show different feelings, quite obvious and with considerable changes in the face.
Table 10. Results of system total performance [16]
Total Cohn
Kanade JAFFE Parameter
%85 %84.1
%85.9 Accuracy
average
%86 %85.6
%87.5 Resolution
%86.1 %85.4
%87.4 f size
In third part, general performance of provided system was evaluated. Results of general performance show that system has optimal performance in two databases.
3.2.3 EEG Based feeling recognition
In [7], EEG is used to recognize severity of a impact reaction but this method has limitation that recognition includes just a part of sensing situation like Arousal status. Behavioural scales investigate movements of body or face muscles using EMG or recoded videos and predict human sensing situation through it but sensing is limited to just predefined sensing situation. Dependent measurement can recognize created physiological reactions caused by sensing by neural system when encountering with stimulating physiological stimulus. These methods include skin conduction responses (SCR) and heart rate variability (HRV), but these methods only understand a small part of our sensing states. Non-invasive sensors have specific features in terms of resolution and time and space portability. These include MEG, fMRI, and EEG. The fMRI has already been used to find cortical structures that are related to emotional states. The MEG has also been used to detect emotional states through accurate timing and time sensitive resolution. EEG records fast reactions of brain activity with very sensitive time resolutions, and with benefits such as cost-effectiveness and portability.
been rhythmic oscillations in electrical activity of brain and reflect the state of the brain. The five main rhythms of the brain that are related to emotions are delta (1.5-4 Hz), theta (4-7.5 Hz), alpha (8-13 Hz), beta (13-30 Hz), and gamma (30 Hz and above). The experimental test of instantaneous emotional recognition in [17],is performed in two sessions, as follows:
At the first training session, the stimulants related to each emotional state were shown to the participants and accordingly, a hierarchical model was created. In the second session, EEG data are collected lively from each participant and emotions are detected instantaneously. To select the stimuli, after examining a wide range of online resources, 32 audio-visual stimuli were selected for experiment. Experimental test were performed on eight participants, one of whom was female and seven was male. Participants were between 17 and 28 years old and had different levels of education from high school to university license, in different fields such as engineering , Science, accounting and finance. To extract EEG signals, participants from the OpenBCI Kit kit with 250Hz sampling speed rate have been used. Two different electrode positions have been used to collect EEG data. Three electrode positions and eight electrode positions were used bilaterally. Generally, 192 datasets were collected, which was 96 datasets for each of the triple and eighth electrode positions.
The feeling recognition algorithm includes:
• Processing: brain waves of participant are delta, theta, alpha, beta and gamma to determine the human feeling. The raw data is filtered by a gap filter to eliminate background noise.
• Feature extraction: To select the feature, it uses the dimensional fractal values related to each electrode and combine them together in form of a feature vector. For calculating the fractal dimensions, the Higuchi fractal dimensions algorithm is used.
• Classification: James A.Russell [18] introduced a bipolar sensation model. Russell concluded in this model that opposite pleasure of bipolar of suffering and arousal is dipole opposite of sleepiness. The bipolar emotional space can represent variance in 42 common scales, such as happiness, anger, fear, anxiety, excitement and
depression scales. In [17], this dipole model that is known as the capacity- arousal model was used in its classification algorithm. Using the created feature vector for each section in the previous step, the feature matrix was created for the capacity and arousal models that are matched each row with one of the labels: low or high arousal for the arousal model, positive capacity or negative capacity for the capacity model. In SVM, a super-page was made in n-dimensional space to separate the different datasets. For A hierarchical classification of SVM was used to create two binary models:
• Arousal and Capacity. Thus, distinct emotions can be defined on arousal-capacity the axis. Since their feature space has very small dimensions, radial base function is used to reflect the feature space with higher dimensions than nonlinear EEG data. Using two models, arousal and capacity models, four emotional states have been identified: low / positive arousal (pleasant), low / negative arousal (sadness), high / positive arousal (happy), and high / negative arousal (disappointing).
The results obtained from [17] are shown in Tables 11 and 12.
Table11. Error and accuracy rate with 3 electrodes [17]
Error rate accuracy
rate Electrode
number Expression
40/83 59/17 3
Arousal
31/61 68/39 3
Capacity level
48/06 51/94 3
Classification of sensing situation
Table12. Error and accuracy rate with 8 electrodes [17]
Error rate accuracy
rate Electrode
number Expression
12/38 87/62 8
Arousal
16/72 83/28 8
Capacity level
22/62 77/38 8
Error and accuracy rate with 8 electrodes which have better percents than error and accuracy rate with 3 electrodes, in search [17] are observed in table 13:
Table13. Error and accuracy rate with 8 electrodes
Error rate accuracy rate Electrode number 16.91 83/09 8
4. Comparison of facial expression recognition
methods
Comparison results of mentioned methods are done in two states. In first state, accuracy and error rate are compared and in second state, qualitative comparison of facial expression recognition methods are concluded. Due to range of geometry based methods and neural networks; it prevents to compare with other methods, quantitatively.
Table14. Methods Comparison
Error rate Accuracy rate Paper reference number Method 0/50
99/49
[2] Appearance based approach 3/34
96/66
[14] Fuzzy algorithm 7/32
92/68
[15] 16/91
83/09 [17] EEG Based approach 0 20 40 60 80 100 120
[13] [18] [19] [21]
accuracy rate
errar rate
Now, all methods generally are compared qualitatively
Figure6. Comparison of facial recognition methods
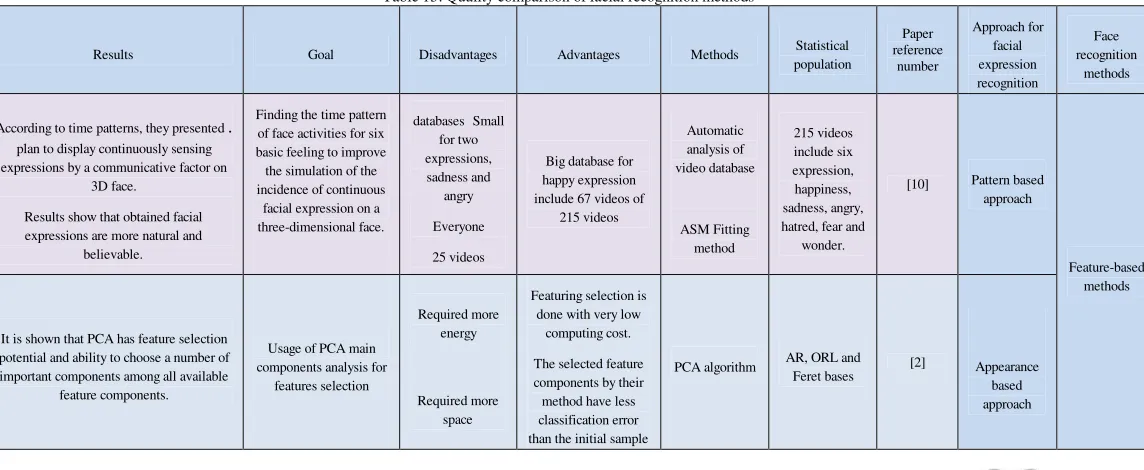
Table 15. Quality comparison of facial recognition methods
Face recognition methods Approach for facial expression recognition Paper reference number Statistical population Methods Advantages Disadvantages Goal Results Feature-based methods Pattern based approach [10] 215 videos include six expression, happiness, sadness, angry, hatred, fear and
wonder. Automatic analysis of video database ASM Fitting method Big database for
happy expression include 67 videos of
215 videos Small databases for two expressions, sadness and angry Everyone 25 videos Finding the time pattern
of face activities for six basic feeling to improve the simulation of the incidence of continuous
facial expression on a three-dimensional face.
.
According to time patterns, they presented plan to display continuously sensing expressions by a communicative factor on
3D face.
Results show that obtained facial expressions are more natural and
believable. Appearance based approach [2]
AR, ORL and Feret bases PCA algorithm
Featuring selection is done with very low
computing cost. The selected feature components by their method have less classification error than the initial sample Required more
energy
Required more space Usage of PCA main
components analysis for features selection It is shown that PCA has feature selection
potential and ability to choose a number of important components among all available
error rate. Geometry based approach [13] Dataset Cohn-Kanade ) CK+ ( Viola-jones algorithm Usage of geometry information Support vector machine Random jungle Nearest neighbourhood It minimizes computing time. It has high accuracy to
find face. Geometry methods have low computing
complexity. System in
recognition of feeling, angry,
hatred and sadness has ambiguous Suggestion of new
features set includes uncertainty about best
way of classification level. For 7 expression set, proposed method in
left side of face has 95.46 % performance and in right side of face has 94.36 % performance. Suggested method had higher recognition rate when were applied for left
side.
Table16. Rest of qualitative comparison of facial recognition methods
Facial recognitio n methods Facial expression recognition approaches Paper referen ce number Statistics population Methods Advantages Disadvantages Goals Results Image based methods Fuzzy algorithm [14] FACES database which related to max Blank
Institute. PCA algorithm Face Fuzzy Detector and Securitizati on (FFDAS) Fuzzy inference system Ability to apply
senses such as enjoy, fear and anger in computer
applications Minimum rate
of recognition is very low about
41%. Dimensionality
reduction along with distance computing in subsidiary Space The average recognition rate is
96.66%, which indicates that the fuzzy method and PCA apply successfully in the feeling test on a
set of standard image data in recognizing feelings from facial
expressions. [15] Randomly from facial expressions database Mamdani fuzzy system It shows more
sensitivity than sadness and fear feelings and has recognition power than other methods. In anger and
wonder expressions, it shows low recognition power than FRBS. Design of facial
expression membership function Performance of Mamdani fuzzy
system was better in many cases and shows high accuracy, 91%,
about all senses.
Neural networks [16] Dataset Cohn-Kanade Dataset JAFFE Viola-jones algorithm The results of the
JAFFE Dataset evaluation are better because its models show the
feelings as powerfully. The JAFFE Dataset does not display neutral expressions, completely coherent. Providing a senses
recognition system to determine sensing
situation Obtained results about system
performance in recognition of facial sensing expression and detection of their sensing content is hopeful base
EEG Based sense recognition
[17] They selected
32 audio-visual stimuli,
totalling 192 datasets are
collected EEG
SVM It is affordable.
It is portable. For better
results, more electrodes are
required Severity recognition of
impact reaction Usage of more number of electrodes
improves performance of human sensing recognition using hierarchical classification model based on arousal - capacity model.
5.
Conclusion
In this study, different techniques of face recognition and feature extraction are discussed. Pattern based methods are implemented easily but don't provide general structure of face. Appearance based methods show optimal feature points that can indicate general structure of face. Geometry based methods such as face feature extraction present stable features.
In image based methods like combination of feature based methods and vector machine, fuzzy algorithm and neural network are used which can help recognize face using many cases like.... image and background. EGG based senses recognition methods can detect and recognize senses and facial expression using feature based and hardware based methods.
References
[1] M. K. Mandal, A. Awasthi, "Facial expressions to emotions: A study of computational paradigms for facial emotion recognition,"Springer Science, Chapter 9, pp. 173-198, 2015.
[2] F. Song, Z. Guo, and D. Mei, "Feature selection using principal component analysis,"in System Science, Engineering Design and Manufacturing Informatization (ICSEM), International Conference on, pp. 27-30, 2010. [3] N. Sharma, India , and K. Saroha, "Study of dimension
reduction methodologies in data mining,"presented at the Computing, Communication & Automation (ICCCA), International Conference on, Noida, 2015.
[4] D. Deodhare, "Facial Expressions to Emotions: A Study of Computational Paradigms for Facial Emotion Recognition," Springer India, Chapter 9, pp. 173-196, 2015.
[5] I. Ahmad, M. Hussain, A. Alghamdi, and A. Alelaiwi, "Enhancing SVM performance in intrusion detection using optimal feature subset selection based on genetic
principal components," Neural Computing and Applications, vol. 24, pp. 1671-1682, 2014.
[6] D. Suryakumar, A. H. Sung, Q. Liu," Dependence of Critical Dimension on Learning Machines and Ranking Methods," IEEE IRI, pp. 738-739, 2012.
[7] U. Bakshi, R. Singhal, "A Survey on face detection methods and feature extraction techniques of face recognition,"International Journal of Emerging Trends & Technology in Computer Science, Volume 3, Issue 3, ISSN 2278-6856, 2014.
[8] T. Sakai, M. Nagao, T.Kanade, " Computer analysis and classification of photographs of human face," First USA Japan Computer Conference, 1972.
[9] Craw, I., Ellis, H. and Lishman, " Automatic extraction of face feature," Pattern Recog, Lett, 183-187 1987. [10] T. D. Ngo, T. H. Nhan, V. H. Nguyen, "Improving
simulation of continuous emotional facial expressions by analyzing videos of human facial activities," Springer Science, LNAI 8861, pp. 222–237, 2014.
[11] D. Ghimire, J. Lee, " Geometric Feature-Based Facial Expression Recognition in Image Sequences Using Multi-Class AdaBoost and Support Vector Machines,"Sensors 13, 7714–7734, 2013.
[12] Rao, K.S., Saroj, V.K., Maity, S., Koolagudi, S.G.:" Recognition of emotions from video using neural network models,"Expert Systems with Applications 38, 13181–13185, 2011.
[13] G. Palestra, A. Pettinicchio, M. D. Coco, "Improved performance in facial expression recognition using 32 geometric features," Springer Science, LNCS 9280, pp. 518–528, 2015.
[14] Sh. Tayal, S. Vijay, "Human emotion recognition and classification from digital color images using fuzzy and PCA approach,"Springer Science, Advances in Computer Science, Eng. & Appl., AISC 167, pp. 1033–1040, 2012. [15] k. azadmanesh, R. javidan, S. E. Alavi, "Improvement of
facial emotion recognition using skin color and face components,"International journal of Computer Science & Network Solutions, Volume 2, No4, ISSN 2345-3397, 2014.
SVM and neural network schema,"Springer Science, CCIS 517, pp. 265–274, 2015.
[17] M. M. Javaid, M. A.Yousaf, "Real-time EEG-based human emotion recognition,"Springer Science, LNCS 9492, pp. 182–190, 2015.
![Table 1. Comparison of dimensionality reduction methods [3]](https://thumb-us.123doks.com/thumbv2/123dok_us/1330955.1641386/4.612.307.558.486.720/table-comparison-dimensionality-reduction-methods.webp)
![Table 3. Recognition Results of six facial expression [13]](https://thumb-us.123doks.com/thumbv2/123dok_us/1330955.1641386/7.612.313.552.397.583/table-recognition-results-facial-expression.webp)
![Figure 3: finding hidden patterns among massive volumes of data in real world. The obtained results from this study [5] are](https://thumb-us.123doks.com/thumbv2/123dok_us/1330955.1641386/8.612.72.251.438.631/figure-finding-hidden-patterns-massive-volumes-obtained-results.webp)
![Table 8. Results of SVM method performance [16]](https://thumb-us.123doks.com/thumbv2/123dok_us/1330955.1641386/11.612.307.556.164.277/table-results-svm-method-performance.webp)