Micro-analytics for Student Performance Prediction
Leveraging fine-grained learning analytics to predict performance
David Azcona1 and Kevin Casey2
1, 2
School of Computing, Dublin City University, Glasnevin, Dublin 9, Ireland
1
[email protected], [email protected]
ABSTRACT
Analytics have a major role in the future of higher education. Virtual Learning Environments are an excellent source of information for enhancing the learning process. The availability of real time insight into the performance of learners can be a significant help for educators in their planning of teaching activities. For students, getting feedback about their progress can be both motivating and encouraging.
Keywords: Learning Analytics; Data Mining; Virtual Learning Environments; Student Behaviour; Early Intervention.
1. INTRODUCTION
The future of education is closely interconnected with the rise of new technologies, and in particular with big data and analytics. Higher education generates enormous amount of data about students but has been inefficient in its use for purposes such as examining student dropout [12]. Universities must improve their processes and become smarter institutions with data-evidence analytics playing a major role [15].
Virtual Learning Environments (VLEs), also called Learning Management Systems (LMSs), in conjunction with the Internet, computers, and mobile devices are enabling the transition from ephemeral to explicit data. This learner-produced data provides valuable insight into what is actually happening in the learning process and suggest ways in which educators can make improvements, like students at risk of dropping out or needing additional support in the learning process. Early-warning reporting tools highlight students at risk and allow instructors to develop early intervention strategies by leveraging this learner-produced data. Casey et al. examined Moodle’s data for fifteen modules in three different courses [4]. The data stored in the system about the activities of both teachers and students is typically who performed the action, what action, when and where. They found some interesting correlations
that link with high performance such as daily module logins, the amount of material reviewed, or Moodle usage over a weekend. In addition, they found extremely high student activity levels on Moodle for certain modules are sometimes a negative indicator for student performance. This could be used to detect students with difficulties ahead of time through early intervention. Purdue University designed an early intervention solution for collegiate faculty called Course Signals [2]. Course Signals is a student success system that allows faculty to provide meaningful feedback to students based on predictive models, and to determine which students might be at risk. The solution helps to promote the integration between the student and the institution in different ways: faculty members send personalized mails to students with regards to their performance in a given course and encourage students to join college activities. A predictive student success algorithm is run on demand by instructors. It has four components: performance, effort, prior academic history, and student characteristics. A similar project is currently running at the Insight Centre for Data Analytics in Dublin City University where Corrigan et al. [5] mine data relating to previous student activity on the Moodle VLE and use this to predict behavior and outcomes for current students.
The second aspect of the platform that of hosting general learning activities, is possible because the module is largely a programming module. We have been able to move the tools that typically would have been used on the desktop into the browser itself, allowing students to program wherever they have a web-browser, with no need to install additional software. As students interact with the system, fine-grained data on their interactions is recorded centrally with a view to improving the learning experience. The fact that so much day-to-day course activity is taking place on an instrumented platform allows unprecedented opportunities in learning analytics and personalized content delivery.
A preliminary analysis has been performed to determine the utility of this approach. Although there are many potential outputs from analysis of the rich data available, the central question of this paper is to examine how useful this data would be for a specific purpose, namely student performance prediction.
This paper is organized as follows. In the next section, we present the environment we have set up. The following sections describe the discrimination proce-dure, the supervised learning approach to mine the data and the intervention algorithm. A Lab Dashboard built as a related project, future work and the conclusion covering the limitations and implication of this research follow.
2. LEARNING PLATFORM
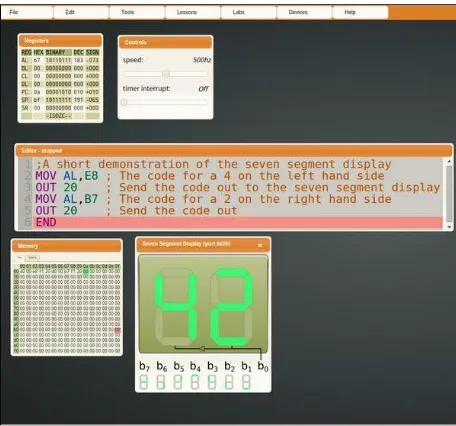
Dr. Casey lectures Computer Architecture and Assem-bly Language Programming to second year Computer Science undergraduates at Dublin City University. Dr. Casey built a web-based VLE and almost every interaction with the platform is tracked and sent to a centralized server which stores this information for future analysis. Lecture notes and Lab exercises are delivered via the system. All data captured is structured and reflects the learner’s interaction with the system. Students have 24 hours of in-Lab work and assessments. Two Lab exams are scheduled for Weeks 8 and 11, which account for 20% of the final grade each. A written exam at the end of the semester is worth 60%. This learner-produced data provides valuable insight into what is actually happening in the learning process (rather than the lecturer’s perception of what is happening) and suggests ways in which educators can make improvements. In this paper, we convert this data into useful and actionable knowledge, specifically a prediction as to whether a student will pass or fail the final exam in this module.
Fig. 1. VLE for Assembly Language Programming
3. DISCRIMINATION
We define our collection of numerical measurements for each student's interaction with the platform as our observations. We focus on a discrimination or pattern recognition process for predicting the unknown nature of each observation, a discrete quantity, which in this case is just a Pass or a Fail in that module for each student [6].
3.1 Data Preparation
On completion of the semester, raw data was retrieved from the centralized server and processed for our analysis. Due to issues such as invalid and missing values or unrecognized sessions, typical of such big data projects, considerable efforts were spent on data cleansing [8]. Cleaning and structuring the data was one of the most important phases as doing this part correctly will increase the likelihood of success of our analysis. The data is also anonymized at this stage to remove any personal identification information (PII).
substantial digital footprint that represent students' interaction with the system.
Fig. 2. Activity on the system
As we can see from Figure 2, the extent to which students on the module are assessment-driven becomes clear. There are three significant spikes in activity. These correspond to the just before the first lab exam, the second lab exam, and the final written exam. For each of the two lab exams, a smaller spike in activity can be seen just to the right. This corresponds to the activity during the lab exam itself. While the observation of assessment-driven behaviour is nothing new, it is illuminating to see analytical data supporting the observation and highlighting the extent of the phenomenon.
3.2 Dimensions
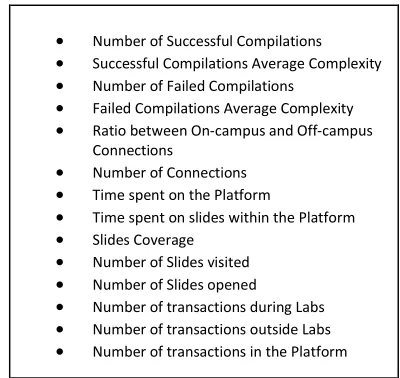
We consider the prediction of a student’s performance in this course (pass/fail) given a number of important factors. The features or dimensions we use for our prediction algorithm are simple metrics gathered from processing the students' interaction with the platform. The output of this prediction algorithm is whether a student fails or passes a course. The input to the prediction algorithm represents one or more observations regarding the student’s activity on the platform such as the number of successful and failed compilations, on-campus vs. off-campus connections and time spent on the platform. Some of the metrics used are presented in Table 1.
The complexity of the programs compiled was also measured and added to our dimensions vector. This metric has been calculated by stripping off the comments each program compiled, running a compression algorithm and measuring the length of the compression for each program. This technique, examined in detail by Jbara and Feitelson [9] is a useful proxy for code complexity.
Table 1: A selection of the metrics used for the classifier.
Number of Successful Compilations
Successful Compilations Average Complexity
Number of Failed Compilations
Failed Compilations Average Complexity
Ratio between On-campus and Off-campus
Connections
Number of Connections
Time spent on the Platform
Time spent on slides within the Platform
Slides Coverage
Number of Slides visited
Number of Slides opened
Number of transactions during Labs
Number of transactions outside Labs
Number of transactions in the Platform
3.3 Data Processing
The preprocessed data listed in Table 1 contain attributes with a mixture of scales for different quantities. The machine learning methods we apply either expect or are more effective if the data attributes all have the same scale. The two scaling methods we applied on our data were normalization and standardization.
In addition, we reduced the number of features or dimensions in order to verify whether feature reduction improves our prediction accuracy. Feature engineering, the judicious selection and pre-processing of such features, is one of the most challenging and important phases for such data-driven algorithms e.g. IBM Watson, Google Knowledge Graph [1].
4. SUPERVISED LEARNING
We assume this learning problem can be modelled stochastically and, hence, that the students' sequence is i.i.d. (independent and identically distributed). We consider this problem as a classification and we define two classes by converting the students' final grades to the classes Pass or Fail.
4.1 Classifier Options
There are many different classifiers that could be used for our prediction algorithm. Often the choice of which classifier to use is not clear, but there is a general paradigm for picking the appropriate classifier to obtain universal performance guarantees. Specifically, we wish to select a function from the set of classifiers which has a small error probability. Effectively, the approach is to use training data to pick one of the functions from the set to be used as a classifier. Using this training data, we select the classifier with the minimum empirical error probability.
Our bag of classifiers is composed of a Linear Regression classifier, a Logistic Regression classifier, Gaussian Naive Bayes classifier, Multinomial Naive Bayes classifier, Bernoulli Naive Bayes classifier, Support Vector Machine with Radial Basis function kernel classifier, a K-Neighbors classifier with K=12 and a Decision Tree classifier. To compare and evaluate different pre-processing techniques and models, we employed a cross-validation approach. In our case, we used a variant called "k-fold cross-validation" [14] in order to compare the classifiers in the set.
4.2 Empirical Error Minimization
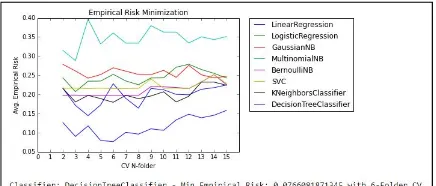
In Figure 3 we show the results of the empirical frequency error minimization approach, where the empirical error probability is minimized over the class of classifiers. After running cross-validation on more than a dozen folders and using several combinations of our selected and reduced dimensions, the top-performing classifier was Decision Tree Classifier.
Fig. 3. Empirical Error Minimization
The Receiver Operating Characteristic (ROC), or ROC curve, is a graphical plot that illustrates the performance of a binary classifier system as its discrimination threshold is varied. In addition, leveraging a ROC Area Under the Curve (ROC AUC) scoring function shows a reliable prediction accuracy score clearly greater than 91% for our Decision Tree Classifier, doing an arithmetic mean for multiple Cross-Validation folders. This is typically classified as an excellent accuracy using the traditional academic points system [10].
Our model's confidence will increase over time. Taking more samples is guaranteed to push us closer to the minimum probability of error (Bayes rule) in the long run [6].
Fig. 4. Decision Tree
5. INTERVENTION
A prediction algorithm per week and per period is developed in order to identify students at risk and develop early intervention strategies and methodologies. Learning analytics is still in the early stages of implementation and experimentation and these intervention systems need to be approached with caution.
For lecturers, the availability of real-time insight into the performance of learners, including students who are at risk can be a significant help in the planning of teaching activities. For students, receiving information about their performance in relation to their peers or about their progress in relation to their personal goals can be motivating and encouraging [11]. These solutions could also improve the quality and value of the learning experience. There appreciable issues here in relation to ethics. While many universities would have little issue with examining anonymized data for general usage patterns, the situation is more complex if students are getting direct feedback about their expected performance in an exam they have not yet taken. This is particularly significant, given that the classifiers used do not have 100% accuracy.
second is that student activity is generally backloaded in that they reserve most of their activity until just before the exam, so a significant amount of data is generated very late in the semester. This closely matches what we observe in the activity graph in Figure 2.
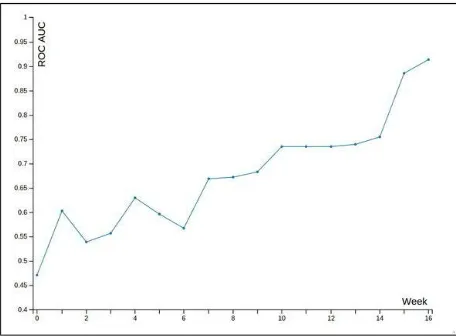
While our classifier has 91% accuracy at the end of the semester, it would be far more useful to obtain this accuracy earlier in the semester. We are adopting two different strategies to achieve this. Firstly, we are examining new dimensions to use with our classifier so that we can achieve better predictive accuracy earlier in the semester. Secondly, we need to pursue strategies to persuade students to frontload more of their activity on the platform. This alone is just good pedagogical practice and not motivated solely by wishing to improve our classifier. On the contrary, the analytics we have collected have helped us already in highlighting the full extent of backloaded student activity.
Fig. 5. Prediction accuracy on a weekly basis
6. Real-time Intervention Dashboard
As an example of what can be done with such analytics, apart from student performance prediction, we have also constructed an Intervention Dashboard. This Intervention Dashboard has been developed as a web application in order to identify students struggling during lab sessions. The visualization, available to lab tutors, shows real time statistics about students during the lab sessions and the lab instructor is able to customize it by selecting the chart type, the time interval on the X axes and activity Key Performance Indicator (KPI) weightings.
The dashboard gives the instructor actionable infor-mation at a glance and shows the number of successful compilations, the number of failed compilations and an activity KPI per time interval in a real time chart. In addition, the program code of the monitored students
(including failed compilations) is shown in real time in the dashboard giving the lab tutor useful information and allowing him to intervene in real time during the lab sessions. This is extremely useful in lab sessions where there are of the order of 50 students to manage.
Fig. 6. Lab Dashboard for instructors
The intervention system could still be further developed by including more data or building an interactive system that checks for issues on the failed compilations and automatically suggests a solution to the student or permits the lecturer to manually send feedback and/or corrections to the student.
7. FUTURE WORK
Our analysis will be expanded when we start mining the subsequent batches of data where additional interaction between the system and the students is tracked, for example mouse tracking data. We are also planning to approach this prediction problem as a multinomial classification problem by labeling the results in k grade divisions. This could be done incrementally by using an ensemble of binary classifiers [7]. The students that are most likely to pass could be subdivided on slightly at risk and not at risk for the first iteration and we could build intervention strategies for the group where students are slightly at risk.
In addition, we are introducing more complex features by measuring more complicated metrics such as when new concepts get propagated through the class. Preliminary results suggest it promising to explore when students write their first Interrupt Service Routine, or even just a simple loop, for example. Keystroke and the aforementioned mouse analytics have yet to be included as dimensions for our classifier.
8. CONCLUSIONS
As discussed in the introduction, our learning platform collects a significant amount of low level data. Consequently, the dataset we have contains a significant volume of fine-grained or microscopic data on student activity within a programming module, including a copy of all programs students write. By using a number of factors such as the complexity of the programs which students have written, we have been able to accurately predict student performance in the module in question with an excellent accuracy.
As a useful baseline, we were able to compare our project using microscopic analytics with another learning prediction project, PredictED [5] at Dublin City University that relies on macroscopic data collected from students’ interactions with Moodle. With the PredictED team’s co-operation, we were able to compare our results, and noted that it was possible to get significantly better prediction accuracy from the fine-grained data we were working with (91% accuracy for our system vs <75% for the comparable Moodle-based system). It is worth noting that the 75% figure we are comparing our results against represents the best prediction reliability for a single module from hundreds of potential modules and using 5 years worth of Moodle data. While our results are already promising, they are only based on a single year’s data. Our model will increase in confidence over time.
While it may seem obvious, in retrospect, that fine-grained (microscopic) analytics data should yield better results than coarse-grained (macroscopic), this result is exciting. It underlines the utility of an all-encompassing module delivery platform for modules such as programming, within which the majority of course-related activities can be supported. The data generated from these activities can be used for improvement of content, automated (and timely feedback) and, more specific to the current paper, early intervention to improve student performance.
We have performed a preliminary analysis to determine the utility of this approach of using microscopic analytics for student performance prediction. The central question of this research was how useful the microscopic data would be for a specific purpose, namely student performance prediction. By using just a limited portion of the analytics collected, it has already been possible to predict student performance with significantly greater accuracy than a similar Moodle-based system.
It is worth highlighting that such data can be used for far more than predicting students' pass/fail grades. There is a significant array of potential applications, for example adapting course content to individuals using personalized models, identifying problems in the
existing course content, and optimizing the running of lab-sessions. In addition, the introduction of additional student metadata such as gender (and subject to the usual ethical considerations), can allow further interesting insights into the process of Teaching and Learning.
REFERENCES
[1] A. Anderson, Michael, et al. "Brainwash: A Data System for Feature Engineering." CIDR. 2013.
[2] Arnold, Kimberly E., and Matthew D. Pistilli. "Course Signals at Purdue: Using learning analytics to increase student success." Proceedings of the 2nd International Conference on Learning Analytics and Knowledge. ACM, 2012.
[3] Blikstein, Paulo. "Using learning analytics to assess students' behavior in open-ended programming tasks." Proceedings of the 1st international conference on learning analytics and knowledge. ACM, 2011. [4] Casey, Kevin, Paul Gibson, and IT-Sud Paris. "Mining
Moodle to understand Student Behaviour.".
[5] Corrigan, Owen et al. “Using Educational Analytics to Improve Test Performance” EC-TEL 2015.
[6] Devroye, Luc et al. "A Probabilistic Theory of Pattern Recognition" (1996).
[7] Galar, Mikel, et al. "An overview of ensemble methods for binary classifiers in multi-class problems:
Experimental study on one-vs-one and one-vs-all schemes." Pattern Recognition 44.8 (2011): 1761-1776. [8] Hernández, Mauricio A., and Salvatore J. Stolfo. "Real-world data is dirty: Data cleansing and the merge/purge problem." Data mining and knowledge discovery 2.1 (1998): 9-37.
[9] Jbara, Ahmad, and Dror G. Feitelson. "Quantification of code regularity using preprocessing and compression." manuscript, Jan (2014).
[10]Mehdi, Tazhibi. "Kernel smoothing for ROC curve and estimation for thyroid stimulating hormone." International Journal of Public Health Research (2011): 239-242. [11]Macfadyen, Leah P., and Shane Dawson. "Mining LMS
data to develop an “early warning system” for educators: A proof of concept." Computers & Education 54.2 (2010): 588-599.
[12]Manyika, James, et al. "Big data: The next frontier for innovation, competition, and productivity." (2011). [13]Pedregosa, Fabian, et al. "Scikit-learn: Machine learning
in Python." The Journal of Machine Learning Research 12 (2011): 2825-2830.
[14]Refaeilzadeh, Payam, Lei Tang, and Huan Liu. "Cross-validation." Encyclopedia of database systems. Springer US, 2009. 532-538.