SELECTION OF OPTIMAL MACHINING
PARAMETERS IN CO2 LASER CUTTING FOR
EN-31 MATERIAL USING TAGUCHI BASED
RESPONSE SURFACE METHODOLOGY (T-RSM
APPROACH)
1
R K Bhatt,
2Prof. P D Zaveri,
3S H Bhatt
1Student, 2Asst. Professor, 3Asst. Professor 1,2,3 Department of Mechanical Engineering
1,2 B H Gardi College of Engineering & Technology, Rajkot, India. 3 Aditya Silver Oak Institute of technology, Ahmedabad, India.
________________________________________________________________________________________________________
Abstract: Laser Beam Cutting is an advanced material removal process. Due to versatile properties of Laser beam, flexible operation characteristics and capacity of processing wide range of materials (i.e. Metals and Alloys, Ceramics, Fiber etc.) it finds wide area of application in industry. Application of Taguchi’s DOE & Response Surface Methodology (RSM) approach in order to analyze and optimize laser parameters for processing of EN-31 material has been presented here. Effects of cutting speed, duty cycle and stand-of-distance (S.O.D) have been selected for investigation using Taguchi’s Standard L27 orthogonal array. Selected response has been optimized using Response Surface Methodology Approach. The selected response for Optimization is Kerf width.
IndexTerms - Kerf Width; LBC; Response surface methodology (RSM); Taguchi Method; Desirability Approach
________________________________________________________________________________________________________
I. INTRODUCTION
Practical and quick development has been set up in the improvement of relatively harder and hard to-cut metals and amalgams for over two decades. With headway in metals and combinations, momentous change in manufacturing processes has occurred. Since the conventional manufacturing processes can't satisfy the prerequisite of machining propelled materials with certain exactness and practical preferred standpoint. These processes are frequently named as "Cutting edge manufacturing processes" or "Non-conventional manufacturing processes" These processes are characterized concurring central wellspring of vitality utilized. For instance: - Mechanical, Thermal, Chemical and Electro-substance.[1] Laser shaft cutting is a piece of Thermal based propelled
manufacturing process where a high power laser pillar is coordinated and centred around a specific territory of material to be cut. The material removal marvels happens either by dissolving or vaporization. The laser shaft moves in the pre-characterized heading in material creating a cut channel which can be named as kerf. The over the top material is smothered by high-weight co-hub help gas. The standard of laser shaft cutting is depicted by a schematic outline in Fig. 1. Among all the assortment of modern applications, cutting of metal sheets has developed and across the board at worldwide level drastically in a decade ago. [2] The
purpose for it is: - Non-contact and expedient process, little heat affected zone (HAZ) and capacity to make accurate and intricate detail.[3]
The general procedure of any procedure is measured by specific reaction parameters. Most vital execution measures in laser cutting are kerf width, Material removal rate (MRR) and Surface roughness.[4] These execution measures are affected by different
free cutting factors like Laser power, bolster rate, obligation cycle, gas weight and so forth. Laser cutting is profoundly mind boggling process in which such a large number of parameters are should have been controlled with accuracy and harmony. Consequently, experimentation or test optimization is tedious, expensive and thus, inaccurate. Accordingly an accurate and proficient technique is required to decide ideal process parameters for best cutting yield. The execution measure considered here is kerf width and lower estimation of kerf width is favoured ideal.
Fig. 1:- Schematic diagram of laser beam cutting. [Kondayya at el. (2012)].
II. LITERATURE REVIEW
Avinash Kumar Dubey and Vinod Yadava (2007) developed a hybrid Taguchi method and response surface method (TMRSM) for the multi-response optimisation of a laser beam cutting process. The approach used the Taguchi quality loss function to find the optimum level of input cutting parameters such as assist gas pressure, pulse width, pulse frequency and cutting speed. [5]
A. K. Dubey and Vinod Yadava (2007) applied Taguchi tool to find the optimal cutting parameters for cutting of a reflective sheet made of aluminium alloy with Nd: YAG laser beam with software assisted technique called computer aided robust parameter design (CARPD).[6]
Lin Li,M. Sobih, P.L.Crouse (2007) carried out experimental work on laser cutting process into achieving striation-free laser cutting of EN43 mild steel sheet.[7]
Amit shrama and Vinod Yadava at el. (2011) carried out modelling and optimization of cut quality during pulsed Nd: YAG laser cutting of thin Al-alloy sheet for the straight profile.[8]
J. Powell, S.O.Al-Mashikhi, A.F.H.Kaplan & K.T.Voisey (2011) presented the results of an experimental and theoretical investigation into the phenomenon of ‘striation free cutting’, in fibre laser/oxygen cutting of thin section mild steel.[9]
Alkesh Manna & Arindam Ghoshal (2012) carried out experimental work with the help of Response surface Methodology (RSM) on machining of Al/Al2O3-MMC by ytterbium fibre laser in order to optimize response viz. Kerf taper and Material removal rate (MRR).[10]
Vinod Yadava and Amit Sharma (2012) presented Response surface Methodology (RSM) based modelling and optimization of cut quality characteristics during Nd: YAG laser cutting for difficult-to-cut and very thin delicate work piece material made from aluminium alloy sheet having curved profile.[11]
A. K. Dubey & Arun Kumar Pandey (2012) presented regression technique and GA based non-conventional optimization technique to simultaneously optimize kerf taper and surface roughness in the laser cutting for difficult-to-cut and very hard material which was Titanium alloy sheet (The Ti-6Al- 4V).[12]
D. J. Kondayya & A Gopala Krishna (2012) presented a new integrated methodology based on evolutionary algorithms (EAs) and Pareto analysis technique to model and optimize the laser beam cutting process for measuring responses viz. response Kerf width and MRR.[13]
A. K. Dubey & Arun Kumar Pandey (2013) carried out experimental work on hybrid approach of neural network and genetic algorithm has been proposed and applied for the optimization of different quality characteristics for modelling and optimization of Laser cutting for difficult to cut Titanium made alloy sheet. [14]
A. K. Dubey & Arun Kumar Pandey (2013) presented a hybrid approach of neural network and fuzzy logic theory to develop the fuzzy expert system to predict the responses viz. kerf widths and kerf deviation for Titanium alloy sheet.[15]
Sivaraos, K.R.Milkey, A.R.Samsudin, A.K.Dubey, P.Kidd (2014) carried out experimental work on optimization of kerf width using two statistical methods viz. Taguchi and Response surface methodology (RSM) and compared the results and stated that the RSM gave more accurate prediction. [16]
R. Adalarasan & M. Santhanakumar & S. Thileepan (2016) carried out experimental work on optimization of CO2 laser cutting for with pulsed Al6061/Al2O3 composite considering responses viz. Surface roughness and kerf width. [17]
Vikash Sharma and Vinod Kumar (2016) carried out experimental work on MMC material using CO2 laser cutting in order to study and optimize surface roughness and kerf deviation. To optimize the quality characteristics using desirability functional approach. [18]
Xueye Chen & Tiechuan Li & Ke zhai & Zengliang Hu & Mengde Zhou (2016) analyzed the effect of laser cutting parameters on the surface roughness of polymethyl methacrylate micro channels with the CO2 laser cutting process. [19]
III. EXPERIMENTAL DETAILS
A.EN 31 Alloy steel
EN 31 is a compound steel which is generally material in zones where close resilience of surface harshness are required, for example, assembling of the pass on and punch having high surface exactness. [4] The compound composition and mechanical
properties of EN 31 are appeared in taking after Table 1 and Table 2 individually.
Table 1:- Chemical Composition of EN 31 Alloy Steel
Table 2:- Mechanical Properties of EN 31 Alloy Steel
Property Bulk Modulus
Shear Modulus
Elastic Modulus
Poisson’s Ratio
Hardness Rockwell C
Average Value 140 GPa 80 GPa 190 GPa 0.30 20
B. Specimen- preparation
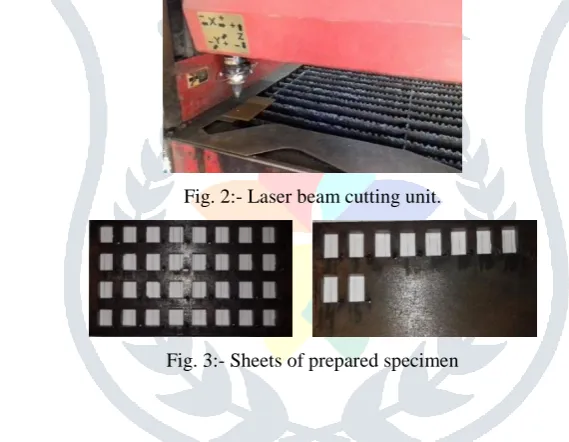
In this review, two sheets of EN 31 combination steel having 7 mm thickness and 100 mm width and 1ft length were utilized for experimentation. The square openings having 15 × 15 mm diameters were cut utilizing CO2 Laser. Outline, re-enactment and settling of the squares was done utilizing AutoCAD and apparatus way and cutting project was created utilizing CNC coding framework for laser cutting. The Laser cutting unit and arranged examples are appeared in figure 2 and 3 separately.
Fig. 2:- Laser beam cutting unit.
Fig. 3:- Sheets of prepared specimen
C.Response:
1. Kerf width:-
The kerf is the slot that is formed during through-thickness cutting. It is normally narrower at the bottom of the work piece than the top. The kerf width is defined as the width at the bottom of the cut, and is typically slightly larger than the focused beam diameter in optimized laser cutting. In contrast, the kerf width of other gas-assisted thermal cutting processes is dependent on the gas jet width.[24] Fig.4 shows schematic diagram of Kerf width.
'
Fig.4:- Schematic Diagram of Kerf Width
a. Formula for measurement
Formula for Kerf width which is used in this work mentioned here in equation (1).[16]
Kerf Width = Upper kerf width+ Lower kerf width … (1)
2
Element C Mn Si S P Cr
% Atomic Weight
0.90-1.20
0.30-0.75
0.10-0.35
b. Measurement method
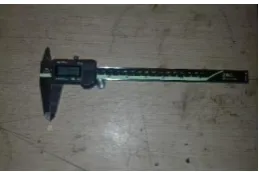
Kerf width has been measured by YAMMAYO Digimatic Vernier calliper. And the final kerf width is achieved using equation (1). The Image of the instrument is shown in Fig.5 and the specifications are mentioned in table 3.
Fig. 5:- YAMMAYO Digimatic Vernier calliper
Table 3:- Specification of YAMMAYO Digimatic calliper
Range 200 mm/ 8’’
Accuracy + 0.03 mm
Temperature 20◦ C
Measuring Values Errors
Internal External
50 mm 0.01 0.01
100 mm -0.01 0.02
150 mm -0.01 0.02
200 mm 0.02 0.03
D. Experimental Methods:-
1. Taguchi Method:-
In the Taguchi strategy, the ideal level of info process parameters or control elements are settled on the premise of measurable investigation of test results that makes the procedure harsh to the impact of varieties because of wild or commotion elements, for example, ecological temperature, mugginess and vibration. In this technique, the trials are executed according to uncommonly planned test network known as orthogonal array (OA).[21-22] The choice of OA depends on the aggregate level of opportunity (dof)
of the procedure. Scientifically, the d.o.f can be registered as [22]:
Degree of freedom =
[(number of levels-1) for each control factor + (number of levels for A-1) × (number of levels for B-1) For each control factor + 1] … (2)
Where, A and B are the interacting control factors.
In the Taguchi strategy, the S/N ratio (η) is utilized to speak to the quality attributes for the watched information or reactions. Here, the "signal" speaks to the attractive esteem and the "noise" speaks to the undesirable esteem and S/N ratio communicates the diffuse around the coveted esteem. The bigger the S/N ratio, littler will dissipate. Contingent upon the test targets, there are a few quality attributes. In the present case, a littler estimation of KW is alluring. In the Taguchi strategy this trademark is named SB sort. Scientifically, the S/N ratio (η) for SB sort quality trademark can be registered as [21-22]:
η= -10log10 (MSD) … (3)
Where, MSD=mean square deviation from the desired value and commonly known as quality loss function.
For SB-type;
MSD = [1
n∑ y
n
i=1 2i ] …(4)
Where, yi is the observed response or quality value at the ith trial or experimental run and n is the number of trials at same
parameter level.
2. Response surface method:-
By and large, a moment arrange relapse model is created in light of the fact that first-arrange models often give lack-of-fit [23].
As per RSM, all the info procedure parameters are thought to be quantifiable, the comparing reactions can be communicated as takes after:
y= f(x1, x2,……,xp) ... (5)
Where, x1, x2,……,xp are input process parameters and y is the response which is required to be optimized. Here, it is assumed
that the independent variables (input process parameters) are continuous and controllable by experiments with negligible errors. It is also required to find a suitable approximation for the true functional relationship between independent variables and responses. Usually, a second-order regression model as given below is utilized in RSM.
y= b0 + ∑pi=1𝑏𝑖 𝑥𝑖 + ∑i=1p 𝑏𝑖𝑖 𝑥𝑖2 +∑ ∑ 𝑏𝑖𝑗 𝑥𝑖𝑖 𝑗 𝑥𝑗 ... (6)
Where, all b’s are regression coefficients determined by least square method [23]. In order to estimate the regression coefficients in this model each variable xi must be taken at least three different levels. This requires 3p number of experiments in factorial design but it is a tedious job with large number of factors. For fitting second-order model a new design known as Box-Behnkan is generally used here.
3. Process parameters
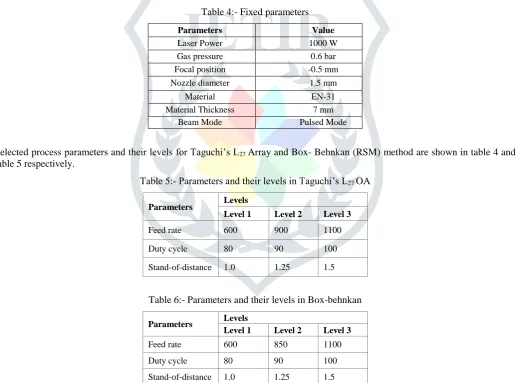
For the present experimental work, three process parameters each at three levels have been decided. It is desirable to have three minimum levels of process parameters to reflect the true behaviour of output parameters of study. Fixed parameters are mentioned in Table 4. The process parameters are renamed as factors and they are given in the adjacent column.
Table 4:- Fixed parameters
Parameters Value
Laser Power 1000 W
Gas pressure 0.6 bar
Focal position -0.5 mm
Nozzle diameter 1.5 mm
Material EN-31
Material Thickness 7 mm
Beam Mode Pulsed Mode
Selected process parameters and their levels for Taguchi’s L27 Array and Box- Behnkan (RSM) method are shown in table 4 and
table 5 respectively.
Table 5:- Parameters and their levels in Taguchi’s L27 OA
Parameters Levels
Level 1 Level 2 Level 3
Feed rate 600 900 1100
Duty cycle 80 90 100
Stand-of-distance 1.0 1.25 1.5
Table 6:- Parameters and their levels in Box-behnkan
Parameters Levels
Level 1 Level 2 Level 3
Feed rate 600 850 1100
Duty cycle 80 90 100
Stand-of-distance 1.0 1.25 1.5
4. Taguchi’s experimental method
5. Response surface Methodology (RSM)
Table 6 shows the different levels of the parameters used in the experimentation. The levels were fixed based on detailed preliminary experiments. The observations of the cutting process are based on Box- Behnkan method. The three control variables viz. feed rate. Duty cycle and stand-of-distance each at three levels, were chosen. The results for experiments after laser beam cutting which were evaluated as stated earlier on one performance measure. This table constitutes the training dataset and was used to predict the expression that best suits to the problem.
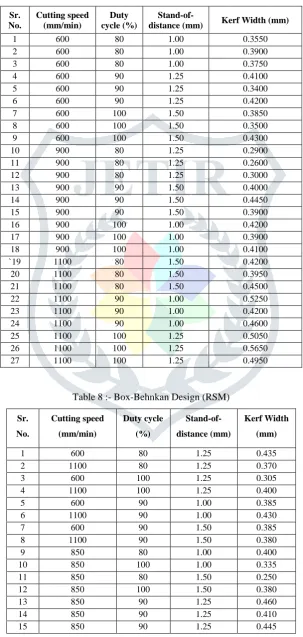
Table 7:- Taguchi’s Orthogonal L27 Array
Sr. No. Cutting speed (mm/min) Duty cycle (%)
Stand-of-distance (mm) Kerf Width (mm)
1 600 80 1.00 0.3550
2 600 80 1.00 0.3900
3 600 80 1.00 0.3750
4 600 90 1.25 0.4100
5 600 90 1.25 0.3400
6 600 90 1.25 0.4200
7 600 100 1.50 0.3850
8 600 100 1.50 0.3500
9 600 100 1.50 0.4300
10 900 80 1.25 0.2900
11 900 80 1.25 0.2600
12 900 80 1.25 0.3000
13 900 90 1.50 0.4000
14 900 90 1.50 0.4450
15 900 90 1.50 0.3900
16 900 100 1.00 0.4200
17 900 100 1.00 0.3900
18 900 100 1.00 0.4100
`19 1100 80 1.50 0.4200
20 1100 80 1.50 0.3950
21 1100 80 1.50 0.4500
22 1100 90 1.00 0.5250
23 1100 90 1.00 0.4200
24 1100 90 1.00 0.4600
25 1100 100 1.25 0.5050
26 1100 100 1.25 0.5650
27 1100 100 1.25 0.4950
Table 8 :- Box-Behnkan Design (RSM)
Sr. No. Cutting speed (mm/min) Duty cycle (%) Stand-of-distance (mm) Kerf Width (mm)
1 600 80 1.25 0.435
2 1100 80 1.25 0.370
3 600 100 1.25 0.305
4 1100 100 1.25 0.400
5 600 90 1.00 0.385
6 1100 90 1.00 0.430
7 600 90 1.50 0.385
8 1100 90 1.50 0.380
9 850 80 1.00 0.400
10 850 100 1.00 0.335
11 850 80 1.50 0.250
12 850 100 1.50 0.380
13 850 90 1.25 0.460
14 850 90 1.25 0.410
E.Analysis of Taguchi Design
1. Analysis of Kerf Width
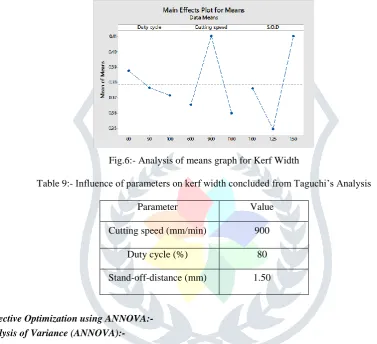
The response analysis, represented by graphs in Figure 5, indicates the change in response when a given factor varies from lower to higher level. Figure 5 represents the main effects plot for the mean value of kerf width against Feed Rate, Duty cycle and Stand-of-distance. It can be seen that greater laser power and duty cycle give a better kerf width. This phenomenon is witnessed probably due to an increase of the incident laser power absorbed by the work materials. On the other hand, it was experiencing inverse effects for cutting speed over the kerf width. The effect of the cutting speed is correlated by the fact that, as the cutting speed increases, the interaction time between the laser beam and work materials distorts.
The effect of various factors at different levels for responses kerf width is shown in Table 9. The optimum parameter level for minimum value of kerf width is A2B2C3. Tabulated in Table 9, the optimal combination of the parameters for the kerf width could be achieved by using a cutting speed of 900 mm/min, duty cycle of 80 %, and Stand-off-distance1.5 mm.
Fig.6:- Analysis of means graph for Kerf Width
Table 9:- Influence of parameters on kerf width concluded from Taguchi’s Analysis
Parameter Value
Cutting speed (mm/min) 900
Duty cycle (%) 80
Stand-off-distance (mm) 1.50
F.Single Objective Optimization using ANNOVA:-
1. Analysis of Variance (ANNOVA):-
The Analysis of both the statistical methods has been carried out by Analysis of Variance method (ANNOVA). In the statistical methods, the experimental results are analysed to achieve following goals:-
1. To establish the best or optimum condition.
2. To establish contribution of individual factors.
3. To Estimate the response under the optimum condition.
The optimum condition is identified by studying the main effects of each factors. The main effects indicate the general trend of the influence of the factors. The levels of factor which are expected to produce the best results can be predicted by knowing the characteristics i.e. whether higher or lower value produce the best results.
The nature of control to be established on production process can be decided by knowing the contribution of each factors. ANNOVA is statistical treatment most generally applied to the results of the experiment to determine the percent contribution of each other. Study of ANNOVA table for a given analysis to determine which of the factors need control and which not.
Once the optimum condition is determined, it is usually a good practice to run a confirmation experiment, Taguchi suggested two different routes to carry out complete analysis.
Standard Approach; where the results of the single run, or average of repetitive runs are processed through main effect and ANNOVA analyses as identified above.
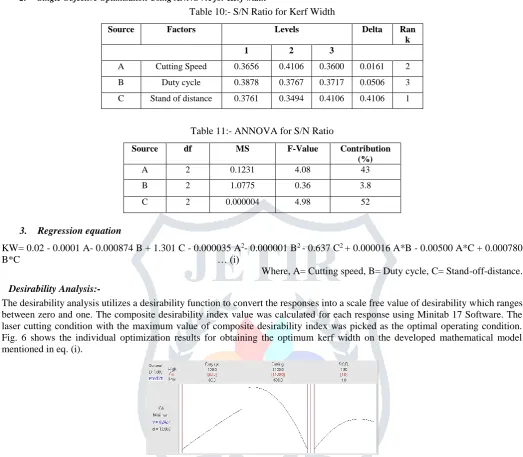
2. Single Objective Optimisation Using ANNOVA for Kerf width
Table 10:- S/N Ratio for Kerf Width
Source Factors Levels Delta Ran
k
1 2 3
A Cutting Speed 0.3656 0.4106 0.3600 0.0161 2
B Duty cycle 0.3878 0.3767 0.3717 0.0506 3
C Stand of distance 0.3761 0.3494 0.4106 0.4106 1
Table 11:- ANNOVA for S/N Ratio
Source df MS F-Value Contribution
(%)
A 2 0.1231 4.08 43
B 2 1.0775 0.36 3.8
C 2 0.000004 4.98 52
3. Regression equation
KW= 0.02 - 0.0001 A- 0.000874 B + 1.301 C - 0.000035 A2- 0.000001 B2 - 0.637 C2 + 0.000016 A*B - 0.00500 A*C + 0.000780
B*C … (i)
Where, A= Cutting speed, B= Duty cycle, C= Stand-off-distance.
Desirability Analysis:-
The desirability analysis utilizes a desirability function to convert the responses into a scale free value of desirability which ranges between zero and one. The composite desirability index value was calculated for each response using Minitab 17 Software. The laser cutting condition with the maximum value of composite desirability index was picked as the optimal operating condition. Fig. 6 shows the individual optimization results for obtaining the optimum kerf width on the developed mathematical model mentioned in eq. (i).
Fig.7:- Optimal Parameter Setting using Desirability Approach
In order to obtain the desired value, importance has been given to the upper bound and lower bound of the linear desirability function. For linear desirability function (d), the value of the weight is considered to be 1. The suggested levels of optimal laser cutting parameters using this approach were Duty Cycle = 80%, Cutting Speed = 1100 mm/min, Stand-of-Distance =1.00 mm
IV. CONCLUSION
After Carrying out Taguchi’s DOE, Influence of each parameter viz. Cutting speed, Duty cycle and S.O.D. on kerf width was found out. And it was concluded that influence of parameters in descending order is Stand-of-distance (52%), Cutting Speed (43%) and Duty cycle (3.8%)
Which led to Optimization using Response surface methodology. On the basis of RSM formula for Kerf Width was found out. This formula can be useful for multi-objective optimization. And also for advanced optimization techniques. The accuracy of the equation is given in Table 12.
Table 12:- Evaluation Table for Derived Equation
Response Practical Value Mathematical Value Accuracy %
REFERENCES
[1] Pandey P. C., Shah H.S., (2007): Modern Machining Processes, Tata McGraw-Hill, New Delhi.
[2] S.C. Tam, Lennie E.N. Lim and K.Y. Quek (1991): Application of Taguchi methods in the optimization of the laser-cutting process
[3] HA Eltawahni, KY Benyounis,AG Olabi (2016):High Power CO2 Laser Cutting for Advanced Materials – Review
[4] Vickram R., Kannan R. C., Lawrence I. D., (2015) : Optimization of Machining Parameters in Turning of EN 31 Alloy Steel using GRA and RSM, ResearchGate, India.
[5] Dubey A. K., Yadava V., (2007): Multi-objective optimization of laser beam cutting process, Elsevier, UK.
[6] Dubey A. K., Yadava V., (2007): Robust parameter design and multi objective optimization of laser beam cutting for aluminum alloy sheet, Springer-Verlag, London.
[7] Li Lin, Sobih M., Course P. L., (2007): Striation-free Laser Cutting of Mild Steel Sheets, Elsevier, UK.
[8] Dubey A. K., Yadava V., (2007): Modelling and optimization of cut quality during pulsed Nd: YAG laser cutting of thin Al-alloy sheet for straight profile. Elsevier, India.
[9] Powell J., Al-Mashikhi S. O.,Kaplan A. F.H., Voisey K. T. (2011): Fibre laser cutting of thin section mild steel: An explanation of the ‘striation free’ effect. Elsevier, UK.
[10] Ghosal A., Manna A. (2012): Response surface method based optimization of ytterbium fibre laser parameter during machining of Al/Al2O3-MMC. Elsevier, UK.
[11] Dubey A. K., Yadava V., (2012): Modelling and optimization of cut quality during pulsed Nd: YAG laser cutting of thin Al-alloy sheet for curved profile. Elsevier, UK.
[12] Dubey A. K., Yadava V., (2013): Simultaneous optimization of multiple quality characteristics in laser cutting of titanium alloy sheet, Elsevier, UK.
[13]Kondayya A., Krishna A. G., (2012): An integrated evolutionary approach for modelling and optimization of laser beam cutting process. Springer-Verlag, India
[14] Dubey A. K., Yadava V., (2013): Modeling and optimization of kerf taper and surface roughness in laser cutting of titanium alloy sheet, Springer, India.
[15] Dubey A. K., Yadava V., (2013): Fuzzy Expert System for Prediction of Kerf qualities in pulsed Laser cutting of Titanium Alloy Sheet, Taylor & Fransis, UK.
[16] 16.Sivaraos, Milkey K. R., Samsudin A. R., Dubey A. K., Kidd P., (2014):Comparison between Taguchi Method and Response Surface Methodology (RSM) in Modelling CO
2 Laser Machining. Jordan Journal of Mechanical and Industrial
Engineering
[17] Adalarsan R., Santhanakumar M., Thileepan S., (2016): Selection of optimal machining parameters in pulsed CO2 laser cutting of Al6061/Al2O3 composite using Taguchi-based response surface methodology (T-RSM). Springer-Verlag, London
[18] Sharma V., Kumar V., (2016) Multi‑objective optimization of laser curve cutting of aluminum metal matrix composites using desirability function approach, Springer.
[19] Chen X., Li T., zhai K. & HuHu Z. & Zhou M. (2016): Using orthogonal experimental method optimizing surface quality of CO2 laser cutting process for PMMA micro channels, Springer-Verlag, London.
[20] Steen WM. (1991): Laser Material Processing, 3rd edn. , Springer, New York.
[21] Ross PJ. (1988): Taguchi technique for quality engineering. New York: McGraw Hill.
[22] Phadke MS. (1989): Quality engineering using robust design. Englewood CL: Prentice-Hall.
[23] Montgomery DC. (1997), Design and analysis of experiments. New York: Wiley.
ABBREVIATIONS
k = no. of control factors or process parameters
Lj = the total normalized quality loss for jth trial condition or run
Iij = quality loss value in ith experimental run for jth quality characteristic
Li* = maximum quality loss for the ith quality characteristic among all the experimental runs
Ȋij = normalized quality loss value in ith experimental run for jth quality characteristic