e-ISSN: 2278-7461, p-ISSN: 2319-6491
Volume 8, Issue 3 [March 2019] PP: 12-20
The Effect of Ion-Dipole Interaction in Sulfonated Alkyl Ester
(SAE) and Nonionic Surfactants Mixture on Phase Behavior and
IFT in Waxy Oil-Brine System
Rani Kurnia
1), Taufan Marhaendrajana
1,*), Deana Wahyuningrum
2), Doddy
Abdassah
1)1) Petroleum Engineering Study Program, Institute Technology of Bandung, JalanGanesha No. 10, Bandung 2) Chemistry Study Program, Institute Technology of Bandung, JalanGanesha No. 10, Bandung
Corresponding Author:TaufanMarhaendrajana
ABSTRACT:Formulation of surfactant was usually conducted to improve several parameters related to surface interaction behavior. Among of such methods is by mixing ionic surfactant with nonionic surfactant. In this work, Sulfonated Alkyl Ester (SAE) surfactant was mixed with Fatty Ester Oleate (FEO) surfactant. SAE is an amphoteric surfactant that has sulfonated groups and ester groups as its hydrophilic groups, and FEO is a nonionic surfactant. Ion-dipole interaction mechanism between the two surfactants was found to be responsible for obtaining an optimum mixture composition. The ion-dipole interaction was quantified using spontaneous interaction energy, and atom distance oxygen atom (with free electron pair) in sulfonate group to carbon atom in carbonyl group. While typical plot to distinguish Winsor microemulsion type during salinity scan had been found in the literature, this study proposed a plot to identify Winsor microemulsion type changes with variation of surfactant concentration.
--- ---Date of Submission: 30-08-2019 ---Date of acceptance:16-09-2019 ---
---NOMENCLATURE
Symbol Description Unit
Vom Solubilized Oil mL
Vwm Solubilized Water mL
Vsm Volume fraction of
Microemulsion ratio
CMC Critical Micelle Concentration %wt
IFT Interfacial Tension mN/m
I.
INTRODUCTION
Surfactant has become more useful for developing enhanced oil recovery nowadays [1]. Surfactant could reduce the interfacial tension of oil-brine system by lowering the energy tensions and widening the surface. This phenomenon leads to spontaneous dispersion between oil and brine, thus the system become thermodynamically stable [2]. Microemulsions will form when the composition of surfactant and oil-brine system produces sufficiently low number interfacial tensions between oil and brine. Huh [3], studied that microemulsion is effective for enhanced oil recovery process, it was mentioned that solubilization of oil and brine into the surfactant-rich phase play important roles in the oil displacement process. The authors further offered analysis of solubilized oil and brine volumes as functions of salinity, surfactant structure, and Hamaker constant of the oil. For Enhanced Oil Recovery two or more surfactants can be combined. With a right formula, surfactant mixtures could lower the interfacial tensions of oil-brine more efficiently than each individual surfactant could. Surfactant tends to gather at the interface of oil and water where the hydrophobic and hydrophilic sides were on their lowest energy. This phenomenon leads to a wider surface and a lower energy at interface hence the interfacial tensions will be at the lowest point.
Ion-dipole interaction has been studied for its application and behavior [14] in various fields, such as protein science [15], polymer science [16], and also in physical chemistry [17,18]. Recent study showed hypothetically that ion-dipole interaction was responsible for a nonionic surfactant to improve an amphoteric surfactant performance in lowering the interfacial tension [19]. This study provided quantitative analysis of the ion-dipole interaction by computing the Interaction energy and the atomic distance. This reveals a new mechanism of non-ionic surfactant (as co-surfactant) changes the interaction ratio of hydrophilic-water phase and lipophilic-oleic phase of surfactant mixtures, which affects the interface properties and phase behavior.
II.
MATERIALS AND METHODS
Sulfonated alkyl ester (SAE) and fatty ester oleate (FEO) surfactant used in all measurements of this study. These two surfactants mixed with certain ratio and tested for its performance in reducing interfacial tension between oil and brine. The fluid samples used was from T-KS field, Indonesia, and in the characteristics this fluid samples have been described in previous study [19].
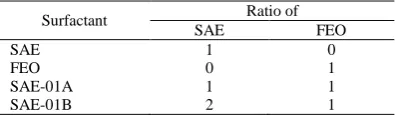
Phase behavior conducted to determine which type of microemulsions formed between oil and brine. There are four surfactants used in this study as seen in Table 1. The phase behavior tests conducted in two scenarios. First scenario used SAE, FEO, SAE-01A and SAE-01B at various concentrations which were diluted in reservoir brine (2,560 ppm or 44 mEq/ml). In the second scenario, SAE, FEO, SAE-01A and SAE-01B were diluted in brine in the salinity range of 150 to 3,500 mEq/mL.
Table 1Surfactants used in this study
Surfactant Ratio of
SAE FEO
SAE 1 0
FEO 0 1
SAE-01A 1 1
SAE-01B 2 1
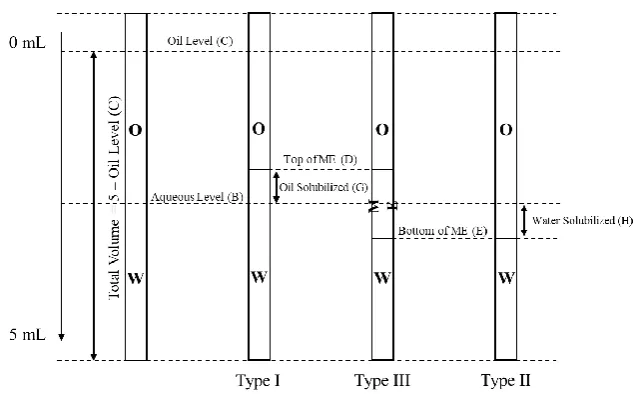
After loading all of the solutions, scale pipettes sealed using flame sealed technique and put in the oven at 63 ºC (temperature of reservoir). Microemulsion type was determined by recording the oil level (C), Aqueous Level (B), Top Microemulsion (D) and Bottom Microemulsion (E) as illustrated by Fig. 1. All data from phase behavior observation were inputted to Table 2.
Table 2Tables of data for phase behavior tests
Surfactant Concentration, %wt
Salinity, mEq/mL
Solubilized Oil, VOM (VOM = B-D)
Solubilized Water, VWM
(VWM = E-B)
Volume Fraction of Microemulsion, VSM
Fig. 1Illustration of phase behavior tests (rewritten from Sheng, (2011))
The interfacial measurement was conducted to determine the surfactant ability to lower the interfacial tension of oil-brine. This measurement was conducted by using spinning drop Tensiometer TX-500D at 63 ± 0.5 °C (reservoir temperature) with 6000 rpm of rotation for 30 minutes.
And for the measurement of atomic distance and interaction energy of surfactant on the interface was conducted by using minimization energy method and ChemOffice™ software. This measurement runs with a few assumptions, which are
1. The measurement of bond length and interaction energy is not in aqueous solution, hence the effect of monovalent ion, divalent ion, and other compounds in field brine is neglected.
2. The interaction of ion-dipole occurs at one molecule of SAE surfactant with one molecule of FEO surfactant.
III.
RESULTS AND DISCUSSION
Ion-Dipole Interaction Analysis
Marhaendrajana, et al., [19], hypnotized that ion-dipole interaction which occurs between sulfonate groups on SAE surfactants and carbonyl groups in FEO surfactant became one of parameter that improve the SAE surfactant performance. This interaction helps to extend the hydrophobicity of SAE surfactant to oil phase thus balancing the energy between hydrophobic group to oil phase and hydrophilic group to water phase.
The ion-dipole interaction occurs when an ionic compound mixed with polar compound. In previous study, the SAE surfactant showed a good performance in lowering interfacial tension at low salinity with 1:1 ratio of SAE and FEO surfactant because the HLB value of the mixture meet the criteria of surfactants to be used as chemicals in surfactant injection. The study concluded that interaction of ion-dipole interaction was responsible for the improvement of phase behavior and interfacial tension of surfactant mixtures solution and oil phase.
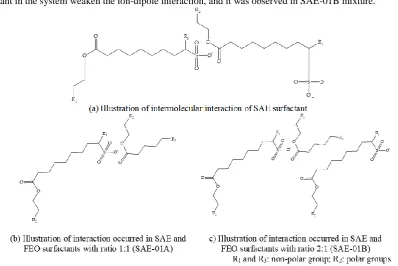
This paper proposed quantitatively computation of ion-dipole interaction by measuring the interaction energy of intermolecular. The interaction energy calculation results of SAE, FEO, SAE-01A and SAE-01B surfactants are shown in Table 3. SAE surfactant has a negative value of interaction energy means that ion-dipole interactions can occur between SAE molecules itself. For FEO surfactant, the molecule itself has no charge in the hydrophilic group which caused no ion-dipole interaction between FEO molecules, but instead dipole-dipole interaction occurred. Ion-dipole interaction also took place in SAE-01A and SAE-01B mixtures.
Table 3Interaction energy of SAE, FEO, SAE-01A and SAE-01B surfactants
Surfactant Interaction Energy (kcal/mol)
Ion Dipole Interaction Dipole-dipole Interaction
SAE -1.9753 18.5878
FEO - 2.1646
SAE-01A -33.9031 13.2374
Fig. 2Illustration of SAE and FEO surfactants in one system
To prove the present of ion-dipole interaction in the mixture of FEO and SAE surfactant is by computing the atom distance. Table 4 shows the atomic distance of oxygen atom (with free electron pair) in sulfonate group to carbon atom in carbonyl group. Although there is no decisive number of the atomic distance to form ion-dipole interactions, some studies stated that ion-dipole interaction can form at 2 – 4 Å [20,21] and at 1 – 5 Å [15]. It was obvious that ion-dipole interaction was stronger in SAE-01A mixture than in SAE-01B mixture.
Table 4Atomic distance between each formulation of surfactant
Formulation code Ratio of Atom distance (Å)
SAE FEO
SAE-01A 1 1 2.459
SAE-01B 2 1 5.792
The measurement of atom distance which formed ion-dipole interaction can be useful to understand the arrangement of surfactant on the interface of oil and water. Table 5 shows the interfacial tension and CMC measurement results of SAE, FEO, SAE-01A and SAE-01B surfactants. In oil-water system, each molecule of surfactant will be placed on the interface of oil and water. The arrangement of surfactant molecule will continue until the entire oil-water interface area is covered by surfactant molecules. It is the minimum surfactant concentration where surfactant molecule starts to form micelles in the water phase.
Table 5Interfacial tension and CMC measurement results of all surfactants at salinity of 44 mEq/mL
Formulation code Ratio of CMC
(%wt)
IFT at CMC (mN/m)
SAE FEO
SAE 1 0 2.0 1.69 100
FEO 0 1 3.0 1.74 10-2
SAE-01A 1 1 2.0 2.59 10-3
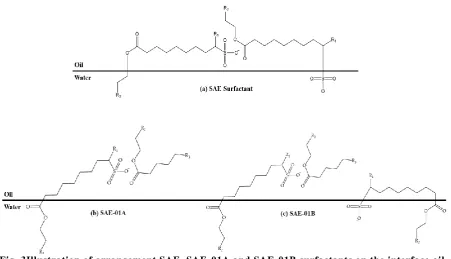
Fig. 3Illustration of arrangement SAE, SAE-01A and SAE-01B surfactants on the interface oil and water
Fig. 3 shows the illustration of arrangement SAE, SAE-01A and SAE-01B surfactants on the interface oil and water. It can be seen in Fig. 3(a) that SAE surfactant molecule has a wide conformation which will require a few SAE molecules to cover the interface. Compared to SAE-01B arrangement Fig. 3(c), the excess SAE molecule helped to cover the interface area less than only SAE surfactant did, which yield a lower CMC value. SAE and SAE-01A have a same value of CMC. It is mentioned earlier that FEO surfactant help SAE surfactant to elongate the hydrophobic groups to be able to interact with oil better. Though both SAE and SAE-01A have CMC value, the interfacial tension value of SAE-SAE-01A surfactant is lower than SAE surfactant. It is caused by the lack of a hydrophobic group interaction of SAE surfactant with oil.
The Effectof Surfactant Concentration in Phase Behavior Tests
Phase behavior test becomes one of the parameters used as a reference in analyzing the performance of a surfactant in surfactant injection [22–24]. The phase behavior tests were conducted to analyze the ability of surfactant to form microemulsions. In application of surfactant injection, surfactant that could form a microemulsion with Winsor type III preferably chosen.
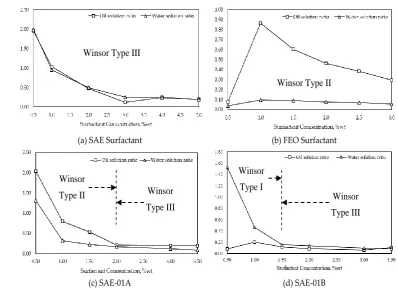
In phase behavior tests, oil solution ratio was calculated by dividing solubilized oil with the amount of surfactant, while water solution ratio was calculated by dividing solubilized water with the amount of surfactant. Phase behavior test for SAE surfactant, FEO surfactant, SAE-01A and SAE-01B for various concentrations with reservoir oil and brine were conducted and were observed for seven days (Fig. 4). It is possible from figure to characterize the Winsor type of microemulsion formed during phase behavior test as function of surfactant concentration. Winsor type I was indicated by water solution ratio higher than oil solution ratio. On the other hand, Winsor type II was distinguished by water solution ratio lower than oil solution ratio. When the two curves relatively coincide the phase behavior showed Winsor type III.
Fig. 4The effect of surfactant concentration in phase behavior measurement results using SAE surfactant, FEO surfactant, SAE-01A and SAE-01B
A different profile showed when phase behavior test used FEO surfactant. It showed significant difference in amount of oil solution ratio and water solution ratio (Fig. 4(b)). It began with Winsor type III and shifted to Winsor type II as surfactant concentration increased. At this state the microemulsion has a richer amount of oil and poor amount of water which caused water dispersed in oil. The SAE surfactant has stronger hydrophilic group than FEO surfactant which caused stronger interaction with water [19].
The mixture of SAE and FEO surfactants, SAE-01A and SAE-01B, showed an interesting microemulsion type changes with surfactant concentration changes. At SAE-01A (Fig. 4c)), microemulsion type changes from water-in-oil emulsion (Winsor Type II) to middle phase (Winsor Type III). It happened because of the interaction with water is weaker as the result of sulfonate groups in SAE surfactant interact with carbonyl group in FEO surfactant form ion-dipole interaction. As SAE composition is higher in the mixture (SAE-01B), excess SAE strengthen the interaction with water phase, so at lower concentration the phase behavior formed Winsor type I microemulsion (oil-in-water), as can be seen in Fig. 4(d). As surfactant mixture concentration increases Winsor type III microemulsion started to develop which was indicated by the two curves coincide, starting at CMC of 1.5%.
Plot of oil solution ratio and water solution ratio was proposed to be a tool to analyze the phase behavior results (microemulsion type identification) as function of surfactant concentration. This plot also suggested a more confident CMC value denoted by the two curves started to intersect. It could be helpful to determine surfactant optimum condition in term of balancing interaction of hydrophilic group with water and hydrophobic group with oil.
The Effectof Salinity Changes in Phase Behavior Tests
As mentioned earlier, phase behavior was affected by surfactant concentration, types of oil, and salinity of brine. The effect of salinity through phase behavior test was analyzed by plotting the VOM/VSM and VWM/VSM vs salinity. In this study, SAE, SAE-01A and SAE-01B was tested for phase behavior tests by using variation of salinity in the range of 150 to 3,500 mEq/mL.
From Fig. 4 the plot of oil solution ratio and water solution ratio, there was a concentration where the plot started showing plateau conditions which showed that the interaction of hydrophobic group with oil and hydrophilic group with water reached its balance. This concentration was used as the concentration for each surfactant during salinity scan, i.e. SAE surfactant 2.0 %wt, SAE-01A surfactant 2.0 %wt and SAE-01B surfactant 1.5 %wt.
Salinity effect to phase behavior was analyzed by plotting salinity to VOM/VSM and VWM/VSM vs
(c) SAE-01A (d) SAE-01B
Type II Winsor Type III
Type I
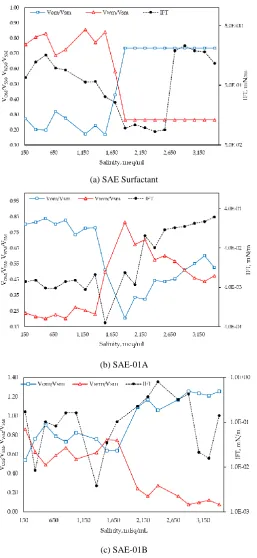
salinity. The plot of salinity vs VOM/VSM and VWM/VSMpresented an information of microemulsion type shifting from type I – type III – type II, the lower VOM/VSM value would indicate that the resulting microemulsion is a microemulsion type I. On the contrary, the higher VWM/VSM value would indicate that the resulting microemulsion is type I. Winsor type III appears in the area below the intersection curve between VOM/VSM and VWM/VSM[25,26]. During salinity scan, ratio between water and oil dissolution was measured as volume of dissolved water or oil surpasses volume of surfactant in microemulsion phase. Ratio of oil dissolution increases as the salinity increases, meanwhile ratio of water dissolution decreases as the salinity increases [27].
The phase behavior test results of SAE surfactant at one day of observation can be seen in Fig. 5(a). It showed that the intersection of VOM/VSM and VWM/VSMresulted area below it in the range of salinity 1,500 to 1,882mEq/mL and the intersection point is 1,717 mEq/mL which indicated that SAE surfactant forms microemulsion Winsor type III. This curve followed typical salinity vs VOM/VSM and VWM/VSMcurve which showed the increasing of VOM/VSM and the decreasing of VWM/VSM along with the increasing of salinity. Fig. 5(a) also showed that the lowest value of IFT is in salinity of 1,882mEq/mL which was also still in microemulsion Winsor type III form.
Compared to SAE-01A, the resulted curve was different from typical curve of salinity vs VOM/VSM and VWM/VSM. It can be seen in Fig.5(b), the resulted curve was the opposite of the typical curve. When SAE and FEO surfactants were mixed, VOM/VSM is increasing and VWM/VSM is decreasing along with the increasing of salinity which indicates that SAE-01A and SAE-01B started with Winsor type II before the optimum salinity. In Fig. 5(b) there were two intersection points, i.e. salinity of 1,540 meq/mL and 2,909 mEq/mL. The first intersection area was between salinity of 1,369 to 1,882 mEq/mL. If we assumed that the first intersection area resulted microemulsion Winsor type III as typical curve of salinity vs VOM/VSM and VWM/VSM, the lowest IFT values has been reached when the microemulsion type appeared in Winsor type III (5.0710-4mN/m at salinity of 1,540 mEq/mL). After the first intersection area, the curve was following typical salinity vs VOM/VSM and VWM/VSM curve, where the increasing of VOM/VSM and the decreasing of VWM/VSM along with the increasing of salinity. The second intersection area appeared in the range salinity of 2,738 to 3,080 mEq/mL with the intersection point at 2,909 mEq/mL. But the resulted IFT was higher than the first intersection area and remained constant. From the results, the addition of FEO surfactant could lower the intersection point (optimum salinity) from 1,717 to 1,540 mEq/mL, also widen the intersection area from 1,500 –1,882 mEq/mL to 1,369 – 1,882 mEq/mL. it can be said that FEO surfactant improve the interaction of SAE surfactant to water and oil with lowered the interaction hydrophilic group of SAE surfactant by forming ion-dipole interaction as illustration in Fig. 3(b).
In surfactant mixture, the results will be different depending on ratio of each surfactant. From Fig. 5(c), SAE-01B resulted three intersection points while the curve was similar to SAE-01A curve. The intersection point appeared at 302; 1,441; and 1,751 mEq/mL. There were also three areas below the intersection of VOM/VSM and VWM/VSMwhich are in the salinity range of salinity 171 – 531 mEq/mL; 1,369 – 1,540 mEq/mL; and 1,711 – 2,242 mEq/mL. While the lowest IFT also appeared at two salinities, i.e. at salinity 342 mEq/mL (IFT = 8.510-3mN/m) and 1,369 mEq/mL (IFT = 3.810-3mN/m). If we apply the same assumptions as to SAE-01A that the intersection area was resulted microemulsion Winsor type III, the mixture of SAE and FEO surfactant with ratio 2:1 could still improve the optimum salinity range and lowering the IFT.
Fig. 5Comparison of phase behavior test and IFT results usi ng SAE surfactant, SAE-01A and SAE-01B
IV.
CONCLUSION
The mixture of FEO surfactant and SAE surfactant lower interfacial tension and optimum salinities by utilizing ion-dipole interaction, compared to SAE surfactant alone. The ion-dipole interaction stronger at surfactant mixture composition at 1:1 ratio between SAE and FEO. At this composition, spontaneous interaction energy of ion-dipole is largest. The atom distance between oxygen in sulfonate group and carbon atom in carbonyl group is smallest.
(b) SAE-01A
Plot of oil solution ratio and water solution ratio was proposed to be a tool to analyze the phase behavior results (microemulsion type identification) as function of surfactant concentration. This plot also suggested a more confident CMC value denoted by the two curves started to intersect. It could be helpful to determine surfactant optimum condition in term of balancing interaction of hydrophilic group with water and hydrophobic group with oil.
In this study, it has been found that the curve of phase behavior results during salinity scan of surfactant mixture showed a different profile from typical optimum salinity curve of a single surfactant, but it still needs further confirmation by using a different mixture of surfactants.
REFRENCES
[1]. J. J. Williams, Formulation of Carpet Cleaners, vol. 1. Elsevier B.V., 2007.
[2]. I. Danielsson and B. Lindman, “The definition of microemulsion,” Colloids and Surfaces, vol. 3, no. 4, pp. 391–392, 1981. [3]. C. Huh, “Interfacial tensions and solubilizing ability of a microemulsion phase that coexists with oil and brine,” J. Colloid Interface
Sci., vol. 71, no. 2, pp. 408–426, 1979.
[4]. D. .Dauben and H. .Froning, “Development and Evaluation of Micellar Solutions to Improve Water lnjection,” J. Pet. Technol., 1971.
[5]. K. Shinoda, “The Formation of Micelles,” Colloid. Surfactants, pp. 1–96, 1963.
[6]. V. J. Kremesec and A. P. Co, “Laboratory Evaluation of a Cosurfactant Micellar Fluid,” no. August, 1988.
[7]. A. Martiz, S. Samaniego, Y. Aray, and R. Paredes, “Synergism Between Ionic and Nonionic Surfactants for Producing Low Interfacial Tension at Oil-Water Interface,” SPE Lat. Am. Caribb. Pet. Eng., 2015.
[8]. B. Swadesi, T. Marhaendrajana, L. Mucharam, and H. P. S. Siregar, “The Effect of Surfactant Characteristics on IFT to Improve Oil Recovery in Tempino Light Oil Field Indonesia,” J. Eng. Technol. Sci., vol. 47, no. 3, pp. 250–265, 2015.
[9]. M. J. Rosen, Surfactants and interfacial phenomena. 2004.
[10]. A. Witthayapanyanon, E. J. Acosta, J. H. Harwell, and D. A. Sabatini, “Formulation of ultralow interfacial tension systems using extended surfactants,” J. Surfactants Deterg., vol. 9, no. 4, pp. 331–339, 2006.
[11]. M. Buijse, R. Prelicz, J. Barnes, and C. Cosmo, “Application of Internal Olefin Sulfonates and Other Surfactants to EOR. Part 2: The Design and Execution of an ASP Field Test,” 2010.
[12]. J. J. Sheng, “Optimum phase type and optimum salinity profile in surfactant flooding,” J. Pet. Sci. Eng., vol. 75, no. 1–2, pp. 143– 153, 2010.
[13]. J. L. Salager, A. M. Forgiarini, and J. Bullón, “How to attain ultralow interfacial tension and three-phase behavior with surfactant formulation for enhanced oil recovery: A review. Part 1. Optimum formulation for simple surfactant-oil-water ternary systems,” J. Surfactants Deterg., vol. 16, no. 4, pp. 449–472, 2013.
[14]. F. E. Budenholzer, E. A. Gislason, and P. Polak‐Dingels, “Ion–dipole scattering: The differential cross section for the K+–CsCl system,” J. Chem. Phys., vol. 76, no. 10, pp. 4878–4882, 1982.
[15]. K. H. Sippel and F. A. Quiocho, “Ion-dipole interactions and their functions in proteins,” Protein Sci., vol. 24, no. 7, pp. 1040– 1046, 2015.
[16]. W. K. Roh, “Phase Behavior of Dipolar Fluids and Ion–Dipole Mixtures, And Surface Diffusion Of Adsorbed Polymers,” University of Illinois, 2010.
[17]. E. Díaz-Herrera and F. Forstmann, “The density and polarization of an ion-dipole-electrolyte near a charged wall,” J. Chem. Phys., vol. 102, no. 22, pp. 9005–9017, 1995.
[18]. D. Boda, K. Y. Chan, and D. Henderson, “Monte Carlo simulation of an ion-dipole mixture as a model of an electrical double layer,” J. Chem. Phys., vol. 109, no. 17, pp. 7362–7371, 1998.
[19]. T. Marhaendrajana, R. Kurnia, D. Irfana, D. Abdassah, and D. Wahyuningrum, “Study to improve an amphoteric sulfonate alkyl ester surfactant by mixing with nonionic surfactant to reduce brine–waxy oil interfacial tension and to increase oil recovery in sandstone reservoir: T-KS field, Indonesia,” J. Pet. Explor. Prod. Technol., vol. 9, no. 1, pp. 675–683, 2019.
[20]. P. A. Hassan, G. Verma, and R. Ganguly, Soft materials-properties and applications. Elsevier Inc., 2012. [21]. R. Belford, “Ion dipole forces,” in General Chemistry 2, LibreTexts, 2019, pp. 9–12.
[22]. D. W. Green and G. P. Willhite, Enhanced Oil Recovery. Richardson: Society of Petroleum Engineers, 1998.
[23]. D. B. Levitt, “Experimental Evaluation of High Performance EOR Surfactants for a Dolomite Oil Reservoir,” Engineering, p. 160, 2006.
[24]. J. J. Sheng, Modern Chemical Enhanced Oil Recovery: Theory and Practice. Elsevier, 2011.
[25]. P. A. Winsor, “Hydrotropy, solubilisation and related Emulsification processes. Part I,” Trans. Faraday Soc., vol. 44, no. 1942, pp. 376–398, 1948.
[26]. J. J. Sheng, “Status of surfactant EOR technology,” Petroleum, vol. 1, no. 2, pp. 97–105, 2015.
[27]. K. A. Elraies and S. Ahmed, “Mechanism of Surfactant in Microemulsion Phase Behavior,” J. Appl. Sci., vol. 14, no. 10, p. 43, 2014.
[28]. M. Baviere, W. . Wade, and R. S. Schechter, “The Effect of Salt, Alcohol and Surfactant on Optimum Middle Phase Composition,” Surf. Phenom. Enhanc. Oil Recover., no. 1, pp. 117–118, 1981.