PERFORMANCE ANALYSIS OF SUPPORT VECTOR MACHINE
FOR PREDICT RAINFALL AND HEART DISEASES
Kolluru Venkata Nagendra1, Dr.M.Ussneiah2
1. INTRODUCTION
Data mining (DM) is a process of nontrivial extraction of implicit, previously unknown and potentially useful knowledge from a large amount of incomplete, noisy, fuzzy and random data. Data Mining is away to discover unknown knowledge and summarize data in a new way that was previously unseen.
Classification is one of main tasks of data mining. Classification means to analyze the pattern of data in a training set to find out an accurate description model of each category and generalize a known structure to apply it to new data. Classification procedure includes data acquisition, feature selection, model selection, training and evaluation. The data that is to be used for training and testing should be collected in advance. The feature selection is affected by previous feature description of data sets. The classifier should be trained to determine system parameters. Usually there will be some repetitions of former procedures based on previous evaluation results to create a better result [1].
In this paper we shall be investigating various classification methods. The remote sensed data that we shall be using in this paper is the Andhra Pradesh rainfall data set collected from the Indian Institute of Tropical Metrology portal. Over the last decade, advances in species predictive distribution modeling, have been paralleled by the evolution and the development of geographical information systems (GIS), remote sensing, statistical modeling and database management [2]. Statistical models to predict the occurrence or the distribution of species are becoming increasingly important tools in conservation planning and wildlife management[3].Marine species classification like the rainfall dataset classification we shall discuss in this paper is of interest to many disciplines, including physical, biological, and fisheries oceanography, marine geology, and coastal ecology, leading to a plethora of approaches[4][5].
2. PROPOSED ALGORITHM
Study pertaining to classification and prediction of rainfall has gained a lot of significance due to frequent recurrence of hurricanes and floods in the recent past. There is a large amount of data that has been accumulated pertaining to rainfall over a period of time. This huge voluminous data is tossing challenges to the research community in terms of processing and active analysis. Current methods and algorithms are insufficient to do effective analysis. Hence advanced data mining techniques like machine learning algorithms and their hybridization techniques are suitable for processing and effective analysis.
Classification is a data mining technique that is used to construct a model and allocate class labels to data instances. It is also used to predict class labels for unlabelled data. In this research work different classification techniques like Naive Baye’s, Decision Tree, KNearest Neighbor and Linear Kernel based Support Vector Machines are used for classifying spatial data.
1 Research Scholar, Department of ComputerScience, VS University,SPSRNellore,AP,INDIA. 2 Assistant Professor, Department of ComputerScience, VS University,SPSRNellore,AP,INDIA.
DOI: http://dx.doi.org/10.21172/1.103.13
e-ISSN:2278-621X
Abstract- The goal of this paper is to find the challenging pattern of Rain Fall Forecasting and Heart Diseases. The study dealt with two applications one is rainfall forecasting and another one is heart diseases prediction. SVM is good for predicting the Rain Fall Forecasting. Support vector machine (SVM) was applied for Rain Fall forecasting data using Linear kernel model. In this research by using SVM classification method to classify the rainfall datasets and shall be comparing its performance with Multi Layer Perceptron, Naïve Bayes, and Decision Tree classification methods.
In this research SVM classification method is also used to build a classification model for a TIFF dataset. The dataset used herein is of Andhra Pradesh rainfall map. The map comprises of Rain fall coverage for various districts. The methodology used classifies the map based on Rain fall coverage. The performance of SVM is calculated using kappa statistics and accuracy parameters and it is established that for the given data set SVM classifies the raster image dataset with great accuracy. Finally, A hybrid classification method encompasses the advantages of the individual classification approaches that it is built upon. In this research we will be examining few popular algorithms used for classifying medical diagnosis data with a hybrid of support vector machines and neural networks. After that we will discuss the performance of these algorithms depending on different parameters and comparing their correct rate in different categories.
SVM based classification is very good for the variety of datasets used.
A novel approach to classify remote sensed data using a Hybrid SVM classifier is proposed. Support Vector machines and bagging methodologies are used to construct the hybrid classifier for effective spatial data analysis. This method is evaluated and the results compared with that of Support Vector machine classifiers and neural network classification methods. The proposed hybrid method when applied to classify the rainfall data in a region in India and it is found that it gives better results when compared to traditional neural network and support vector machine classification methods used individually without any compromise in classification accuracy.
3. BACKGROUND KNOWLEDGE
3.1 Overview of SVM Classifier
Support vector machine (SVM) is a promising methodology which is used in various applications. They have a strong mathematical foundation. They are used to solve both two class and multi class classification problem [6] [7]. In a two class problem the input data has to be categorized as two diverse categories wherein each category is assigned a unique class label [8]. A multi class classification problem can be divided it into multiple two class classification problems and solved by aggregating the individual results to get the final result of the multi class problem.
Success of SVM depends on their strong mathematical foundation that conveys several significant properties:
Margin maximization: The classification boundary functions of SVMs maximize the margins, which leads to maximizing generalization performance.
Systematic nonlinear classification via kernel tricks: SVMs effectively handle non-linear classifications using kernel tricks. One of the major advantages of SVM is that feature selection is automatically taken care by it and one need not separately derive features.
3.2 Overview of Naive Bayes:
The Naïve Bayes method of classifying data is based on Bayes rule with an assumption that the attributes viz. X1,X2 . . .,Xn, given an attribute Y are all conditionally independent of the other. This notion shortens the depiction of P(X/Y) and the problem of appraising it from the training data set[9][10].
Given a data item X, the naïve bayes classifier predicts that data item X belongs to the class having utmost posterior probability conditioned on X. It predicts that tuple X belongs to class Ci only if Equation (7) mentioned below is satisfied.
P(Ci/X)>P(Cj/X) for 1<=j<=m,j≠i (1)
Maximize P(Ci|X): find the maximum posteriori hypothesis using equation (2).
P(Ci/X) = (2)
P(X) remains constant for all classes, thus, maximize P(X|Ci)P(Ci)
To maximize P(X|Ci)P(Ci), we need to know class prior probabilities. If the probabilities mentioned herein are not known, assume that
P(C1)=P(C2)=…=P(Cn) ⇒ maximize P(X|Ci) (3)
Class prior probabilities can be estimated by P(Ci)=|Ci,D|/|D|
Assume that there is Class Conditional Independence to reduce computational cost of P(X|Ci) given X(x1,…,xn), P(X|Ci) is:
P(X/Ci) =
= P(x1/Ci)xP(x2/Ci)...xP(xn/Ci) (4)
The probabilities P(x1|Ci), …P(xn|Ci) can be estimated from the training tuples [11][12].
3.3 Overview of MLP Classifier
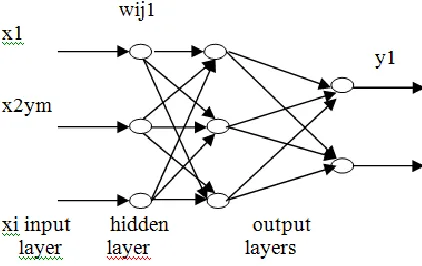
In this work we used Multi-Layer Perceptron (MLP) neural networks. The architecture for the said MLP neural networks is composed of a layered architecture of neurons, such that output from one layer feeds as an input to the subsequent neurons layer. This neural network assigns a pattern vector x to a class ωm if the mth output neuron achieves the highest value . The learning algorithm of MLP classifier uses the Euclidean norm in order to lessen the said error function defined on the learning set (xi, di)for i= 1,2,. . . ,Nasin Equation(5)
E(w) = (5)
where xi is an input vector with N dimensions for i=1,2...N, y is M-dimensional output signal vector, w is the vector with adapted weights, d is the desired M- dimensional desired output vector[13].
Fig 1: MLP network with one hidden layer.
Each input layer is calculated from the weighted sum of the previous layer. Let J-1 be the previous layer of J, such that each input IJj in Jis given by
IJj= (6)
and
OkJ-1=ϕ(I kJ-1) (7)
where j = 1,2, . . . ,NJ, being NJ and NK the amount of neurons at the layer J and J-1, respectively, and wjk stands for the weights that modify the kth output of layer J-1, i.e., OJ-1k[6].
In this paper we have used a 5-5-1 neural network with 36 weights.
c). Overview of Bagging: This technique processes samples in parallel is called bagging also known as bootstrap aggregating. It plans to advance the accuracy by constructing enhanced fused classifier, by aggregating the variety of learned classifier outputs into a solitary prediction. The pseudo-code is mentioned below [14-16].
Algorithm Bagging [14] I:- an inducer
N:-the number of iterations S:-the training set
Output: Ci; i = 1,……,N Step 1: i ← 1
Step 2: repeat
Step 3: Si ←Sample N instances from S with replacement. Step 4: Construct classifier Ci using I on Si
Step 5: ti+ + Step 6: until i > N
As sampling with replacement is used, a few original instances of S might come into view frequently in Si and few might not be incorporated at all. So Si are dissimilar from each other, however are surely not autonomous. To classify a novel instance, every classifier returns the class forecast for the unidentified instance. The compound bagged classifier, I1, returns the class which was forecasted frequently. The consequence is that this method generates a joint model which often fares superior to the solitary model constructed from the original data. It is true particularly for unsteady inducers as bagging can get rid of their unsteadiness.
In this research we shall be using hybrid model comprising SVM and neural network classification method supplemented by bagging to classify the Framingham datasets and shall be comparing its performance with individual SVM and neural network classification methods. The algorithm for the same is mentioned below:
Algorithm Hybrid SVM
Step 1: Train the SVM classifier for the data set under consideration
Step 2: Construct a new data set with the decision function of the SVM classification approach. Step 3: Train the ANN with the new data set and validate the same using the test set
Step 4: Repeat the above steps with different samples with replacement approach.
4. RESULTS PERFORMANCE ANALYSIS
4.1 Approach-I [Rain Fall forecasting- Text data set]
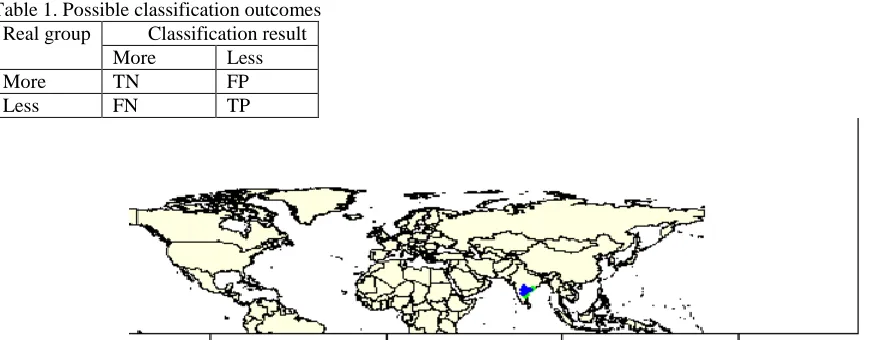
(FP), and False Negative (FN) where the outcomes of classification are demonstrated in Table-1. And the classified Rain Fall data into two different sets is demonstrated in Figure 2.
Table 1. Possible classification outcomes Real group Classification result
More Less
More TN FP
Less FN TP
Figure(2): Plot of Rainfall data with districts with more rainfall plotted with green and less with blue Evaluation metrics
It is observed that the most conventionally utilized evaluation metrics in classification are sensitivity, specificity, prevalence, detection rate and detection prevalence[8][9].The formulae for sensitivity, specificity, prevalence, detection rate and detection prevalence are provided by equations (8), (9), (10), (11) and (12)
Result Analysis: The performance of the proposed classifier SVM with linear kernel is analyzed and compared with Decision tree, MLP, Naïve bayes classifiers. Performance Measures using evaluation metrics are given in Table 2.
Table 2. Performance Measures
Classifier Sensitivity Specificity Prevalence Detection Rate Detection Prevalence
SVM 100 100 18.75 12.5 12.5
Decision tree classifier 100 100 18.75 18.75 18.75
MLP Classifier 0 100 18.75 0 0
Naïve bayes classifier 83.3 84.62 18.75 15.62 28.12
Hence, it is identified from the results and findings with the comparative evaluations that SVM approach is better than other classifiers.
4.2 Approach-II [Rain Fall forecasting- TIFF dataset]
Table.3. Environment Setting
Item Capacity
CPU Intel CPU @2 GHz processor
Memory 4GB RAM
OS Windows 7 32-bit
Tools Monteverdi tool
Performance of a Classification method can be measured using parameters of a confusion or error matrix view depending on whether the event is correctly classified or no event is correctly classified as shown in Table 4.
Table.4.Confusion / Error Matrix View Real group Classification result
No Event Event
No Event True Negative(TN) False Positive(FP) Event False Negative(FN) True Positive(TP)
In this paper the parameters used to evaluate the classification is Accuracy and kappa statistics. The formulae for accuracy, specificity, sensitivity and kappa statistics are provided by equations (13), (14), (15) and (16) [20] [21] [22]:
(13)
(14)
Sensitivity = x100 (15)
Kappa statistics=Sensitivity + Specificity – 1 (16)
The confusion matrix or error matrix view for SVM Classifier while classifying raster TIFF data set is given in Table 5. Table.5 Confusion Matrix for rater datasets
Prediction Reference
Excess Normal Deficient
Excess 14 0 0
Normal 0 16 0
Deficient 0 0 11
Performance Measures using evaluation metrics are specified in Table 6 which are calculated using equations (13), (14), (15) and (16).
Table.6 Performance measures for CSV and raster datasets
Data set type Accuracy Kappa Statistics
Raster TIFF data sets 100 100
4.3 Approach-III [Heart Diseases Data Set – Huge Volume data]
The first obvious step in any data mining procedure is data selection. The data being used in this paper is from Framingham heart study. This study began in Framingham with 5209 subjects. Much of the now commonly known heart attack symptoms have come from this study [23]. It consists Gender, age, education, smoker or not, BP status, Whether a person already suffered a heart stroke, Whether a person was diabetic or not, Cholesterol levels of a person, Body Mass index of a person, Heart beat rate of a person and Glucose levels of a person are the attributes. The model tries to predict based on the above mentioned attributes whether a person is prone to suffer a heart attack or not. The performance of the proposed classifier hybrid SVM with neural networks is examined and likened with SVM and neural network and the results are mentioned below.
Table. 7. Performance Measures
Classifier Accuracy Specificity Prevalence Detection Rate Detection Prevalence
SVM 86.03 100 98.7 84.7 84.7
Neural Networks 84.7 NA 100 84.7 84.7
Hybrid SVM 94 100 98.9 90.2 90.2
The research is related to the classification of rainfall data as belonging to various districts of Andhra Pradesh using SVM. Initially, to conduct the research, a methodology has been proposed consisting of several steps along with classification algorithms like SVM, decision tree, MLP and Naïve bayes methods. The research has concluded that the SVM approach of classification is more effective and efficient as compared to other methods because SVM provided higher values for sensitivity, specificity, prevalence, detection rate and detection prevalence. Thus, it can be said that the SVM technique is promising and reliable method of classification. SVM classification method is used to for a TIFF dataset. The dataset used herein is of Andhra Pradesh rainfall map. The methodology used classifies the map based on Rain fall coverage. The performance of SVM is calculated using kappa statistics and accuracy parameters and it is established that for the given data set SVM classifies the raster image dataset with great accuracy. The research is related to the classification of heart patient data from Framingham using hybrid SVM and neural networks. The same is compared with SVM and neural network methods.
Finally we conclude that the SVM is good for Rain fall forecasting, which is a very low volume of data. SVM is also good for predicting less volume of text data and image like TIFF dataset. The volume of dataset is increased the SVM single is not give the good results. So we applied here Hybrid algorithm for huge volume of Framingham heart data. The research has concluded that the hybrid SVM approach of classification is more effective and efficient.
6. REFERENCES
[1] Baoping Tang, Tao Song, Feng Li, Lei Deng, Fault diagnosis for a wind turbine transmission system based on manifold learning and Shannon wavelet
support vector machine, Renewable Energy, Volume 62, February 2014, Pages 1-9, ISSN 0960-1481, http://dx.doi.org/10.1016/j.renene.2013.06.025.
[2] A.D. Dileep, C. Chandra Sekhar, Class-specific GMM based intermediate matching kernel for classification of varying length patterns of long duration
speech using support vector machines, Speech Communication, Volume 57, February 2014, Pages 126-143, ISSN 0167-6393, http://dx.doi.org/10.1016/ j.specom.2013.09.010.
[3] Elias Zintzaras, Axel Kowald, Forest classification trees and forest support vector machines algorithms: Demonstration using microarray data,
Computers in Biology and Medicine, Volume40,Issue5, May2010, Pages 519-524, ISSN0010-4825, http://dx.doi.org/
10.1016/j.compbiomed.2010.03.006.
[4] Hsun-Jung Cho, Ming-TeTseng, A support vector machine approach to CMOS-based radar signal processing for vehicle classification and speed
estimation, Mathematical and Computer Modeling, Volume 58, Issues 1–2, July 2013, Pages 438-448 ,
ISSN0895-7177,http://dx.doi.org/10.1016/j.mcm.2012.11 .003
[5] Lam Hong Lee, Rajprasad Rajkumar, Lai Hung Lo, Chin Heng Wan, Dino Isa, Oil and gas pipeline failure prediction system using long range
ultrasonic transducers and Euclidean-Support Vector Machines classification approach, Expert Systems with Applications, Volume 40,Issue 6,May 2013, Pages 1925-1934,ISSN 0957-4174, http:// dx.doi.org/10.1016 /j.eswa.2012.10.006.
[6] Lam Hong Lee, Rajprasad Rajkumar, Lai Hung Lo, Chin Heng Wan, Dino Isa, Oil and gas pipeline failure prediction system using long range
ultrasonic transducers and Euclidean-Support Vector Machines classification approach, Expert Systems with Applications, Volume 40,Issue 6,May 2013, Pages 1925-1934,ISSN 0957-4174, http:// dx.doi.org/10.1016 /j.eswa.2012.10.006.
[7] Elias Zintzaras, Axel Kowald, Forest classification trees and forest support vector machines algorithms: Demonstration using microarray data,
Computers in Biology and Medicine, Volume40,Issue5, May2010, Pages 519-524, ISSN0010-4825, http://dx.doi.org/
10.1016/j.compbiomed.2010.03.006.
[8] Xinjun Peng, Yifei Wang, Dong Xu, Structural twin parametric-margin support vector machine for binary classification, Knowledge-Based Systems,
Volume 49, September2013,Pages63-72,ISSN0950-7051,http:// dx.doi.org/10.1016/j.knosys.2013.04.013.
[9] V.M. Mantas, Z. Liu, A.J.S.C. Pereira, A web service and android application for the distribution of rainfall estimates and Earth observation data, Computers & Geosciences, Volume 77, April 2015, Pages 66-76, ISSN 0098-3004, http://dx.doi.org/10.1016/j.cageo.2015.01.011.
[10] Borja Calvo, Pedro Larrañaga, José A. Lozano, Learning Bayesian classifiers from positive and unlabeled examples, Pattern Recognition Letters, Volume 28, Issue 16, 1 December 2007, Pages 2375-2384, ISSN 0167-8655,http://dx.doi.org/10.1016/j.patrec.2007.08. 003.
[11] Yubin Yang, Hui Lin, Zhongyang Guo, Jixi Jiang, A data mining approach for heavy rainfall forecasting based on satellite image sequence analysis,
Computers & Geosciences, Volume 33, Issue 1, January 2007, Pages 20-30, ISSN 0098-3004, http://dx.doi.org/10.1016/j.cageo.2006.05.010. [12] Rajasekhar, N.; Babu, S.J.; Rajinikanth, T.V., "Magnetic resonance brain images classification using linear kernel based Support Vector Machine,
"Engineering (NUiCONE), 2012 Nirma University International Conference on , vol., no pp.1,5, 6-8 Dec 2012 doi10.1109/NUICONE.2012.6493213.
[13] Xiaowei Yang, Qiaozhen Yu, Lifang He, Tengjiao Guo, The one-against-all partition based binary tree support vector machine algorithms for
multi-class multi-classification, Neuro computing, Volume 113, 3 August 2013, Pages 1-7, ISSN 0925-2312, http://dx.doi.org/10.1016j.neucom .2012.12.048.
[14] Hamid Parvin, MiresmaeilMirnabiBaboli, Hamid Alinejad-Rokny, Proposing a classifier ensemble framework based on classifier selection and
decision tree, Engineering Applications of Artificial Intelligence, Volume 37, January 2015, Pages 34-42, ISSN 0952-1976, https://doi.org/10.1016/j.engappai.2014.08.005.
[15] Om PrakashMahela, Abdul GafoorShaik, Recognition of power quality disturbances using S-transform based ruled decision tree and fuzzy C-means
clustering classifiers, Applied Soft Computing, Volume 59, October 2017, Pages 243-257, ISSN 1568-4946,
https://doi.org/10.1016/j.asoc.2017.05.061.
[16] https://en.wikipedia.org/wiki/Ensemble_learning.
[17] Liu ,Mingjun Wang, Jun Wang, Duo Li, Comparison of random forest, support vector machine and back propagation neural network for electronic
tongue data classification: Application to the recognition of orange beverage and Chinese vinegar, Sensors and Actuators B: Chemical, Volume 177, February 2013, Pages 970-980, ISSN0925-4005, http://dx.doi.org/10.1016/ j.snb.2012.11.071.
[18] {R Core Team}, R:A Language and Environment for Statistical Computing, R Foundation for Statistical
Computing,Vienna,Austria,2013,http://www.R-project.org
[20] Jennifer A. Taylor, Alicia V. Lacovara, Gordon S. Smith, Ravi Pandian, Mark Lehto, Near-miss narratives from the fire service: A Bayesian analysis, Accident Analysis & Prevention, Volume 62, January 2014, Pages 119-129, ISSN 0001-4575, http://dx.doi.org/10.1016/ j.aap.2013.09.012.
[21] David J. Rogers, Jonathan E. Suk, Jan C. Semenza, Using global maps to predict the risk of dengue in Europe, Acta Tropica, Volume 129, January
2014, Pages 1-14, ISSN 0001-706X,
[22] Rafael Pino-Mejías, María Dolores Cubiles-de-la-Vega, María Anaya-Romero, Antonio Pascual-Acosta, Antonio Jordán-López, Nicolás
Bellinfante-Crocci, Predicting the potential habitat of oaks with data mining models and the R system, Environmental Modelling & Software, Volume 25 ,Issue 7, July 2010, Pages 826-836, ISSN 1364-8152, http://dx.doi.org/10.1016/ j.envsoft.2010.01.004.
[23] Gangin Lee, Unil Yun, HeungmoRyang, An uncertainty-based approach: Frequent itemset mining from uncertain data with different item importance,
Knowledge-Based Systems, Volume 90, December 2015, Pages 239-256, ISSN 0950-7051, https://doi.org/10.1016/j.knosys.2015.08.018.
[24] TarekHamrouni, SarraSlimani, Faouzi Ben Charrada, A data mining correlated patterns-based periodic decentralized replication strategy for data grids,
Journal of Systems and Software, Volume 110, December 2015, Pages 10-27, ISSN 0164-1212, https://doi.org/10.1016/j.jss.2015.08.019.
[25] Jia Wu, Shirui Pan, Xingquan Zhu, ZhihuaCai, Peng Zhang, Chengqi Zhang, Self-adaptive attribute weighting for Naive Bayes classification, Expert
Systems with Applications, Volume 42, Issue 3, 15 February 2015, Pages 1487-1502, ISSN 0957-4174, https://doi.org/10.1016/j.eswa.2014.09.019.
[26] Liangxiao Jiang, Chaoqun Li, Shasha Wang, Lungan Zhang, Deep feature weighting for naive Bayes and its application to text classification,
Engineering Applications of Artificial Intelligence, Volume 52, June 2016, Pages 26-39, ISSN 0952-1976,
https://doi.org/10.1016/j.engappai.2016.02.002.
[27] P. Julian Benadit, F. Sagayaraj Francis, U. Muruganantham, Improving the Performance of a Proxy Cache Using Tree Augmented Naive Bayes
Classifier, Procedia Computer Science, Volume 46, 2015, Pages 184-193, ISSN 1877-0509, https://doi.org/10.1016/j.procs.2015.02.010.
[28] Md. Shafiqul Islam, M.A. Hannan, Hassan Basri, AiniHussain, Maher Arebey, Solid waste bin detection and classification using Dynamic Time
Warping and MLP classifier, Waste Management, Volume 34, Issue 2, February 2014, Pages 281-290, ISSN 0956-053X, http://dx.doi.org/10.1016/j.wasman.2013.10.030
[29] Hari Mohan Rai, AnuragTrivedi, ShailjaShukla, ECG signal processing for abnormalities detection using multi-resolution wavelet transform and
Artificial Neural Network classifier, Measurement, Volume 46, Issue 9, November 2013, Pages 3238-3246, ISSN 0263-2241,http: // dx.doi.org /10.1016/ j.measurement.2013.05.021..
[30] LokanathSarangi, Mihir Narayan Mohanty, SrikantaPattanayak, Design of MLP Based Model for Analysis of Patient Suffering from Influenza,
Procedia Computer Science, Volume 92, 2016, Pages 396-403, ISSN 1877-0509, http: //dx.doi.org/ 10.1016/ j.procs. 2016.07. 396.
BIOGRAPHIES
K.Venkata Nagendra, working as Assistant Professor in the Department of Computer Science Engineering at Geetanjali Institute of Science and Technology, Nellore, Andhra Pradesh, India. He has 6 years of experience in the field of teaching. He is a research scholar in Vikrama Simhapuri University. He did his M.Tech in ANU, Guntur. His areas of interests are Data warehousing and Data Mining and Cloud Computing.