ISSN (Online) 2249-6084 (Print) 2250-1029 www.eijppr.com
Validated RP-HPLC for Simultaneous Estimation of
Etoposide and Picroside-II in Patented
Pharmaceutical Formulation and the Bulk
Sachin Bhusari*, Gayatri Borse, Mahesh Rindhe, Pravin Wakte
University Department of Chemical Technology, Dr. Babasaheb Ambedkar Marathwada University, Aurangabad, Maharashtra, India.
ABSTRACT
A novel, selective, precise, and accurate RP-HPLC method was developed and validated for simultaneous estimation of Etoposide and Picroside-II in bulk and the patented pharmaceutical formulation. The chromatographic analysis was performed on Agilent 1260 Infinity HPLC instrument using a Kromasil C-8 column (150 × 4.6 mm, particle size-5 um) and a mobile phase comprising 0.5% acetic acid in water: actonitrile (75:25 v/v). Flow rate of mobile phase was kept at 0.8 ml/min and the column eluent was monitored at 254 nm. The total run time was 15 min and the average retention time of Etoposide and Picroside-II was found to be 13.68 min and 3.62 min respectively. The calibration curves of Etoposide and Picroside-II were linear over the range of 1-10 ng/mL with R2 = 0.999. Average percentage recoveries of Etoposide and Picroside-II were
100.27±0.49 and 100.39±0.23 % respectively. The LOQ values of Etoposide and Picroside-II were 7.52 and 9.11 ng/mL respectively. Proposed method was found to be precise and reproducible as the RSD values of intra-day and inter-day precision studies were below 2%. Proposed method was successfully used for the quantitative analysis of Etoposide and Picroside-II in patented pharmaceutical formulation wherein the assay content of Etoposide and Picroside-II was found to be 100.27 and 99.92% respectively.
Key Words: RP-HPLC, Etoposide, Picroside-II.
eIJPPR 2019; 9(2):83-90 HOW TO CITE THIS ARTICLE: Sachin Bhusari, Gayatri Borse, Mahesh Rindhe, Pravin Wakte (2019). “Validated RP-HPLC for Simultaneous Estimation of Etoposide and Picroside-II in Patented Pharmaceutical Formulation and the Bulk”, International Journal of
Pharmaceutical and Phytopharmacological Research, 9(2), pp.83-90.
INTRODUCTION
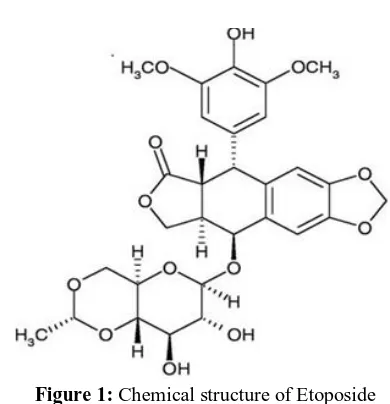
Etoposide (ETOPO) [Fig.1] chemically designated as 40-demethylepipod- ophyllotoxin-9-(4,6-O-ethylidene)-b-D-glucopyranoside, is an important antineoplastic agent currently in use extensively for the treatment of small cell
lung cancer, testicular cancer and lymphomas[1, 2]. Low
and erratic oral absorption of ETOPO has been attributed to drug precipitation in the gastrointestinal lumen due to poor aqueous solubility, pH-related degradation and
efflux byp-glycoprotein transporter [3-6]. ETOPO when
administered orally shows poor and variable
bioavailability which ranges from 25 to 75% [4-6].
Several attempts are being made by the researchers across the globe to achieve consistent and improvised oral
bioavailability of the ETOPO [7-15]. Recently, a plant
based oral bioavailability enhancer has been developed for the ETOPO by the Department of Chemical Technology, Dr. Babasaheb Ambedkar Marathwada University, Aurangabad. Briefly, Picroside-II (PK-II)
[Fig. 2] a phytochemical from rhizomes of Picrorrhiza
kurroa [16, 17], when administered with ETOPO, is
found to enhance oral bioavailability of ETOPO consistently by 35%. Based on the significant finding of ETOPO bioenhancement by PK-II, an Indian patent has been field & published for the prospective commercial
use[18]. Simultaneously a pharmacological composition
comprising ETOPO & PK-II was developed using QbD approach. Considering therapeutic and commercial importance of combination of ETOPO and PK-II, it was envisaged that development of HPLC method for simultaneous estimation of ETOPO and PK-II will be worth. It would be in routine analysis of ETOPO & PK-II
Corresponding author: Dr. Sachin Shivling Bhusari
Address:Assistant Professor,Pharmaceutical Technology Division,Department of Chemical Technology,Dr. Babasaheb Ambedkar
Marathwada University, Aurangabad - 431001, Maharashtra, India.
E-mail: chemtech.cdmpk@gmail.com
Relevant conflicts of interest/financial disclosures: The authors declare that the research was conducted in the absence of any
commercial or financial relationships that could be construed as a potential conflict of interest .
ISSN (Online) 2249-6084 (Print) 2250-1029 www.eijppr.com
84 composition in near future.
Figure 1: Chemical structure of Etoposide
Figure 2: Chemical structure of Picroside-II
MATERIALS AND METHODS
Chemicals and Reagent
ETOPO was obtained from TCI chemicals (India) Pvt. Ltd & PK-II (purity 98% by HPLC) was obtained as gift sample from Natural Products Chemistry Division of Indian Institute of Integrative Medicine (CSIR), Jammu. All chemicals and reagents used were of analytical grade. HPLC grade Acetonitrile (ACN) and water were used for the purposed study.
Instruments
Chromatographic analysis was performed using an Agilent HPLC system that consisted of a model G1311C quaternary HPLC pump (Agilent Technologies, Palo Alto, CA), G1329B auto sampler system (Agilent Technologies) and G1315F variable wavelength detector (Agilent Technologies). HPLC grade water was obtained from “Extrapure Water Purification System (Lablink). Mobile phase was degassed by using ultrasonicator (PCI Analytics). For weighing purpose, Vibra HT analytical balance (Essae) was used.
Preparation of Mobile Phase
0.5% Acetic acid in water was prepared by dissolving 5 mL of acetic acid in 1000 mL of water. The prepared mobile phase was filtered through 0.22µm filter and degassed by ultrasonication for 5 min. HPLC grade ACN was used in combination with 0.5% acetic acid as a mobile phase.
Preparation of standard stock solution
Stock solutions (1 mg/mL) of ETOPO and PK-II were separately prepared in HPLC grade ACN and filtered through 0.45 µm nylon membrane syringe filter.
Preparation of standard calibration curve
Calibration curve was prepared by diluting the stock-I solution to achieve the seven different calibration standards representing 1, 2, 3, 5, 7, 8, 10 ng/mL strength of ETOPO and PK-II. All these solutions were injected into HPLC column and the peak area of each solution was measured. The standard calibration curves of peak area Vs concentration (ng) were plotted.
Method Validation
The validation of pre-optimized chromatographic method was performed according to the Q2 (R1) guidelines of International Conference on Harmonization (ICH). Various analytical method validation parameters like system suitability, linearity, range, LOD, LOQ, accuracy, precision and stability were assessed [19, 20].
System Suitability
Before performing the main analysis, the system suitability test was carried out using freshly prepared standard working solutions of 1 ng/mL of ETOPO and PK-II. Standard working solution was repeatedly analyzed by using proposed HPLC conditions. During analysis, various parameters viz. retention time, peak area, and the number of theoretical plate were measured. Acceptable upper limit of % RSD for peak area and retention time was set at 2 whereas acceptable lower limit of number of theoretical plates was set at 2000. System was considered to be suitable only when obtained values were within the set limits.
Linearity & Range
Linearity of the proposed method was calculated by using seven different calibration standards of ETOPO and PK-II. The calibration curves were constructed using the Calibration Standards representing 1, 2, 3, 5, 7, 8, 10 ng/mL strength of ETOPO and PK-II. Concentration vs. peak areas were plotted, subjected to linear regression analysis and linearity in terms of R-squared values and respective range were reported.
Accuracy (% Recovery):
ISSN (Online) 2249-6084 (Print) 2250-1029 www.eijppr.com
85 added externally and the % recovery of both the drugs
was calculated.
Precision
The precision of the developed method was evaluated by performing Intra-day and Inter-day studies. Intra-day precision study was carried out by analyzing five replicates of three different concentrations (1, 5 and 10 ng/mL of ETOPO and PK-II) at morning, afternoon and evening time of the same day. Similarly, inter-day precision study was carried out by analyzing the samples on three consecutive days. Intra- and inter-day precision results were expressed in terms of % RSD.
Robustness
Robustness of the proposed HPLC method was evaluated by making slight, deliberate change in chromatographic parameters viz. column temperature, flow rate of mobile phase and the mobile phase composition. Modified chromatographic conditions for the assessment of
robustness were ±1oC deviation in column temperature,
±0.05 ml/min deviation in flow rate of mobile phase and ±1 unit deviation in volume of ACN. For the robustness study, a solution (5 ng/mL) was repeatedly (n=5) analyzed for retention time and peak area of ETOPO and PK-II using above-mentioned modified chromatographic conditions. Results of the robustness study were expressed in terms of % RSD. Proposed method was considered to be robust only when the % RSD values for both retention time and peak areas were below 2.
Limit of detection (LOD) and Limit of quantification (LOQ)
LOD is the lowest concentration in a sample that can be detected, but not necessarily quantified under the stated experimental conditions. LOQ is the lowest concentration of analyte that can be determined with acceptable accuracy and precision. LOD and LOQ were calculated using following formula:
LOD = 3.3 × SD/S LOQ = 10 × SD/S
where SD = standard deviation of response (peak area) and S = slope of the calibration curve.
Stability of Analytical Solutions
Stability of analytical solutions was evaluated by using proposed HPLC method. For the stability study, standard
solutions of ETOPO and PK-II (5 ng/mL) were stored at
two different temperatures viz. 4 and 25oC and the
solutions were analyzed using proposed HPLC method for the ETOPO and PK-II contents after 24 hrs. of storage. Results were expressed in terms of % contents and %RSD.
Estimation of ETOPO and PK-II content in pharmaceutical formulation
In-house pharmaceutical formulation of ETOPO & PK-II
was formulated using pharmaceutically accepted
excipients. About 20 mg ETOPO was dissolved in 0.1 ml dimethyl sulfoxide (Solution-A). Accurately weighed 0.5gm Polyethylene glycol 4000 was dissolved in 4.5 mL water and 0.5 ml propylene glycol was added into it (Solution-B). Solution-A was added to Solution-B and mixed well using vortex mixer to obtain an oral solution as comparative example in table 2. Similarly, about 20 mg ETOPO was dissolved in 0.1 mL dimethyl sulfoxide (Solution-C). Accurately weighed 0.5 gm Polyethylene glycol 4000 was dissolved in 4.5 ml water. 10 mg PK-II and 0.5 mL propylene glycol was added into water containing polyethylene glycol (Solution-D). Solution-C was added into Solution-D and mixed well using vortex mixer to obtain oral compositions. The solution was filtered using 0.45 µm filter. From the filtrate, 1 μL was injected in to the column under above-mentioned chromatographic conditions. Each sample solution was injected in triplicate. Content of ETOPO and PK-II in formulation was calculated by comparing mean peak area of sample with that of the standard.
RESULTS AND DISCUSSION
Optimization of RP-HPLC Method
While developing HPLC method for simultaneous estimation of ETOPO and PK-II, various mobile phase combinations and the stationary phases were tried. Selection of mobile phase composition and stationary phases was based on the solubility behavior, pKa values and the relative retention of ETOPO and PK-II.
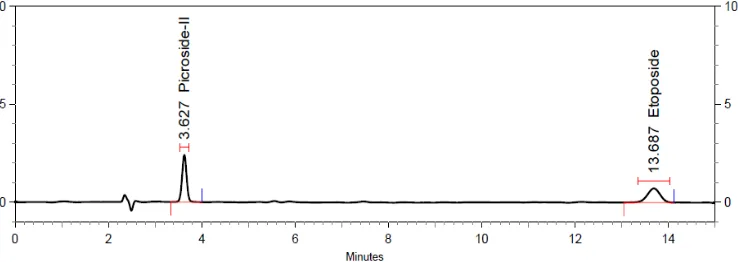
ETOPO and PK-II was optimally resolved (Figure 3) over C-8 HPLC column using combination of 0.5% acetic acid in water and ACN (75:25v/v) as a mobile phase. The details of optimized chromatographic conditions are shown in Table 1.
Table 1: The optimized chromatographic conditions.
Separation variable Optimized conditions
Chromatography Agilent HPLC system
Column C-8, 150 x 4.6, 5 um (Kromasil, Grace)
Mobile phase 0.5% Acetic acid in water: ACN (75:25 v/v)
Flow rate 0.8 mL/min
ISSN (Online) 2249-6084 (Print) 2250-1029 www.eijppr.com
86
Pressure 56-57 bars
Temperature 400C
Detection wavelength 254nm
Retention time ETOPO 13.68 min
Retention time PK-II 3.62 min
Figure 3: A typical RP-HPLC chromatogram of ETOPO and PK-II.
System suitability
System suitability test is carried out to ensure that resolution and reproducibility of the chromatographic system is adequate for the analysis to be performed. System suitability test when carried out using proposed HPLC method showed that %RSD for retention time and
peak area was less than 2 whereas numbers of theoretical plates were more than 2000 for both the analytes. On the basis of obtained results, it was found that system is suitable for the analysis. The details of system suitability results are summarized in Table 2.
Table 2: System suitability parameters for ETOPO and PK-II.
Sr.No. Parameter Acceptance criteria Result
ETOPO %RSD PK-II %RSD
1 Retention Time %RSD ≤ 2% 13.6868 0.0573 3.6266 0.0314
2 Area %RSD ≤ 2% 23475 0.8152 27500 0.0747
3 Theoretical plates ≥ 2000 2702 0.9253 3027 0.9780
Method validation Linearity and Range
Linearity and range are the important parameters of analytical method that demonstrates the limit within which the intended method is to be used for its optimum performance. Considering the prime importance of linearity and the range, seven-point calibration curve of ETOPO (1-10 ng/mL) and PK-II (1-10 ng/ mL) were constructed. Concentrations and the respective peak areas
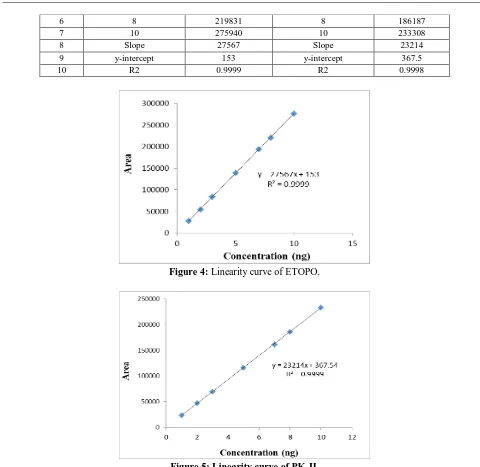
of both ETOPO and PK-II are depicted in Table 3. Calibration curve when subjected to least square regression analysis yielded an equation; y = 27567x + 153 for ETOPO and y = 23214x + 367.5 for PK-II with correlation coefficient 0.9999 (Fig. 4 and 5). From the linearity study, it was revealed that, there is a linear relationship between response (peak area) and amount of drug within the range 1-10 ng/mL for ETOPO and 1-10 ng/mL for PK-II.
Table 3: Linearity of ETOPO and PK-II.
Sr. No. ETOPO PK-II
Conc. (ng/mL) Peak Area Conc. (ng/mL) Peak Area
1 1 27490 1 23340
2 2 54400 2 47651
3 3 83700 3 69884
4 5 138950 5 116529
ISSN (Online) 2249-6084 (Print) 2250-1029 www.eijppr.com
87
6 8 219831 8 186187
7 10 275940 10 233308
8 Slope 27567 Slope 23214
9 y-intercept 153 y-intercept 367.5
10 R2 0.9999 R2 0.9998
Figure 4: Linearity curve of ETOPO.
Figure 5: Linearity curve of PK-II.
Accuracy (percentage Recovery)
Accuracy is the closeness of test results to the true value obtained by proposed method. The accuracy of an analytical method should be established over its calibration range so that at any point of determination, results obtained would be accurate. For ETOPO and PK-II, accuracy was determined using recovery studies. At
80, 100 and 120 % standard addition, mean recovery of ETOPO and PK-II was found to be 100.15 and 100.55 % respectively. The relative standard deviation (% RSD) was found to be less than 2 (Table 4). From the results of accuracy studies, it was concluded that the proposed method is accurate.
Table 4: Recovery studies of ETOPO and PK-II.
Sr.
No. Sample
Spiked level
Theoretical Concentration (ng/mL)
Practical Concentration (ng/mL)
% Recovery
Mean %
Recovery % RSD
1 ETOPO
80% 4 4.032 100.81
100.27±0.49 0.6365±0.19
100% 5 4.99 99.83
120% 6 6.01 100.19
2 PK-II
80% 4 4.01 100.30
100.39±0.23 0.1953±0.08
100% 5 5.03 100.1
ISSN (Online) 2249-6084 (Print) 2250-1029 www.eijppr.com
88
Precision
Precision is the degree of repeatability of an analytical method under normal operational conditions. Precision of the method was established by performing an intra- and inter-day studies.
Intra-day precision
Intra-day precision of proposed method was established by analyzing three different standard solutions (1, 5 and 10 ng/mL of ETOPO and PK-II) on three different time intervals of the same day. It was found that % RSD values of estimated concentrations were less than 2. Results of intra-day precision studies are shown in Table 5.
Table 5: Intra-day precision data for ETOPO and PK-II.
Sr. No.
ETOPO PK-II
Nominal Conc. (ng/mL)
Estimated Conc.
(ng/mL) % Assay % RSD
Nominal Con. (ng/mL)
Estimated Conc.
(ng/mL) % Assay
% RSD
1 1 1.0202 101.62 1.16 1 0.6609 100.01 0.22
2 5 5.0076 99.55 0.15 5 5.0261 99.92 0.16
3 10 10.040 100.35 0.06 10 10.011 100.06 0.20
Mean 100.50 0.4566 Mean 99.99 0.19
Inter-day precision
Intra-day precision studies were repeated on three consecutive days and the obtained data was used for estimation of inter-day precision of proposed method. The
% RSD values were well below the upper limit of acceptance. Results of inter-day precision studies are shown in Table 6.
Table 6: Inter-day precision data for ETOPO and PK-II.
Sr. No.
ETOPO PK-II
Nominal Conc. (ng/mL)
Estimated Conc.
(ng/mL) % Assay % RSD
Nominal Conc. (ng/mL)
Estimated
Conc. (ng/mL) % Assay % RSD
1 1 1.0230 101.49 1.77 1 0.8824 100.08 0.227
2 5 5.0076 99.55 0.22 5 5.0257 99.91 0.188
3 10 10.043 100.38 0.11 10 8.3552 100.16 0.514
Mean 100.47 0.70 Mean 100.05 0.309
From the results of intra- and inter-day precision studies, it was found that proposed method is precise and reproducible.
Robustness
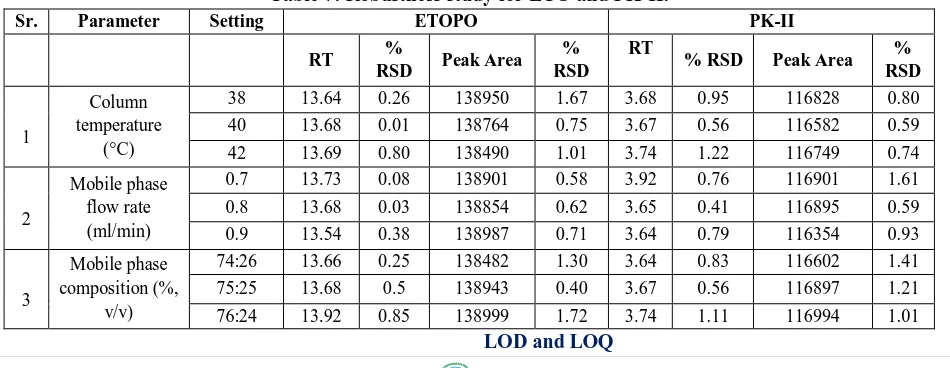
An analytical method is considered to be robust when the small, internal changes in method parameters did not alter the final results significantly. Robustness of the proposed method was established by slightly changing the column
temperature, mobile phase flow rate and mobile phase composition. It was found that, slight change in internal method parameters did not alter the final result (retention time and peak area) significantly. The % RSD values were found to be less than 2 (Table 7). Thus, proposed method was found to be robust.
Table 7: Robustness study for ETO and PK-II.
Sr. Parameter Setting ETOPO PK-II
RT %
RSD Peak Area
% RSD
RT
% RSD Peak Area %
RSD
1
Column temperature
(°C)
38 13.64 0.26 138950 1.67 3.68 0.95 116828 0.80
40 13.68 0.01 138764 0.75 3.67 0.56 116582 0.59
42 13.69 0.80 138490 1.01 3.74 1.22 116749 0.74
2
Mobile phase flow rate (ml/min)
0.7 13.73 0.08 138901 0.58 3.92 0.76 116901 1.61
0.8 13.68 0.03 138854 0.62 3.65 0.41 116895 0.59
0.9 13.54 0.38 138987 0.71 3.64 0.79 116354 0.93
3
Mobile phase composition (%,
v/v)
74:26 13.66 0.25 138482 1.30 3.64 0.83 116602 1.41
75:25 13.68 0.5 138943 0.40 3.67 0.56 116897 1.21
76:24 13.92 0.85 138999 1.72 3.74 1.11 116994 1.01
ISSN (Online) 2249-6084 (Print) 2250-1029 www.eijppr.com
89 The LOD and LOQ of proposed method were determined
from linearity curve method using slope and standard deviation of precision. The LOD and LOQ for ETOPO and PK-II are depicted in Table 8.
Table 8: LOD, LOQ data of ETOPO and PK-II.
Sr. No. Sample LOD LOQ
1 ETOPO 2.48 ng/mL 9.11 ng/mL
2 PK-II 3.98 ng/mL 7.52 ng/mL
Stability of Analytical solutions
Stability of analytical solutions and or samples is a major concern during the analysis. It is necessary that samples to be analyzed should be stable over the period of analysis. During validation of proposed method, stability of ETOPO and PK-II was assessed by analyzing the standard analytical solutions. After 24 hrs of storage, % recovery of ETOPO was found to be in the range of 99.80 to 101.66 whereas that of PK-II was in the range of 99.80 to 100.66 (Table 9). It was found that analytical solutions comprising ETOPO and PK-II were stable over the period of 24 hrs.
Table 9: Stability data of ETOPO and PK-II Solutions.
Estimation of ETOPO and PK-II content in pharmaceutical formulation
Proposed validated analytical method was successfully applied for the determination of ETOPO and PK-II content in its liquid formulation. Figure 6 depicts HPLC chromatogram obtained after the analysis of liquid formulation by proposed method. By proposed HPLC
method, average ETOPO and PK-II content of the pharmaceutical formulation was found to be 100.27 and 99.92% respectively. Further, it was found that proposed HPLC method is specific for the ETOPO and PK-II. No interference of the excipients of pharmaceutical formulation was observed during the HPLC analysis.
Figure 6: A typical RP-HPLC chromatogram of Sample.
CONCLUSION
An accurate, precise, sensitive yet robust RP-HPLC method was developed and validated for the simultaneous determination of ETOPO and PK-II in bulk and formulation. Proposed HPLC method was found to be specific for ETOPO and PK-II and was free from any interference of formulation excipients. Proposed HPLC method can be used for routine analysis of ETOPO and PK-II in bulk as well as formulation.
REFERENCES
[1] Government of India. Ministry of Health and
family welfare. Indian PharmacopoeiaVol I. Indian Pharmacopoeial Commission, New Delhi; 2010: 1322 – 1324.
[2] Alessandra M., Francesca Z. and Giuseppe B.,
2015. Molecular Mechanisms of Etoposide.
Experimental and Clinical Sciences Journal,
14:95-108.
[3] Maanen J.M.S., Retel J., Vries J. and Pinedo H.M.,
1988. Mechanism of Action of Antitumor Drug
Sr. ETOPO PK-II
1. Storage Temperature (oC) 4 25 4 25
2. Time of Analysis (hrs.) 0 24 0 24 0 24 0 24
3. Estimated Concentration (ng/ml) 5.08 5.02 4.99 4.99 5.03 5.02 4.99 4.99
4. % Recovery 101.66 100.40 99.80 99.80 100.66 100.40 99.80 99.80
ISSN (Online) 2249-6084 (Print) 2250-1029 www.eijppr.com
90
Etoposide: A Review, Journal of the National
Cancer Institute, 80(19):1526-1533.
[4] Ancona C., Caff A., Giovanni M.A. and Stefano
C., 2016. Merkel Cell Carcinoma Responsive to Etoposide: A Case Report And Brief Literature
Review. Journal Of Cancer
Metastasis And Treatment, 2(3):10-2.
[5] Akhtar N., Ahad A., Khar P.K. and Jaggi M. et.al,
2011. P-glycoproteinInhibitors in Drug Delivery: A Patent Review, Expert Opinian Therapeutics patents, 21 (4): 561-576.
[6] Najar I.A. and Johri R.K., 2014. Pharmaceutical
and Pharmacological Approaches for
Bioavailability Enhancement of Etoposide.
Journal of Biosciences, 39(1):139-144.
[7] Xiuguo L. and Choi J.S., 2009. Effects Of
Quercetin on the Pharmacokinetics of Etoposide After Oral or Intravenous Administration of
Etoposide in Rats. Anticancer Research, 29:
1411-1416.
[8] Bansal T., Akhtar N., Jaggi M., Khar R.K.and
Talegaonkar S., 2009. Novel Formulation
Approaches for Optimising Delivery of Anticancer
Drugs Based on P-Glycoprotein Modulation. Drug
Discovery Today, 14: 1067-1074.
[9] Peter I.C. and Maurice L.S., 1987. The Clinical
Pharmacology of Etoposide and Teniposide.
Clinical pharmacokinetics, 12(4):223-252.
[10] Harvey V.J., Slevin M.L., Joel S.P., Smythe M.M., Johnstons A.and Wrigley P.F.M., 1985. Variable Bioavailability Following Repeated Oral Doses of
Etoposide. European Journal of
Cancer and Clinical Oncology, 21(2):1315-1319.
[11]Desmond N. and Carney M.D., 1991. The
Pharmacology of Intravenous and Oral Etoposide.
Cancer, 67(1): 299-302.
[12]Ahmad I. and Johri R.K., 2014. Pharmaceutical
and Pharmacological Approaches for
Bioavailability Enhancement of Etoposide.
Journal of Biosciences, 39(1): 139-144.
[13]Ayyapan T., Shanmugham S. and Vetrichelvan
T.,2018. Response Design Optimized Polymeric Nanoparticles of Etoposide for Improved Oral
Bioavailability in Albino Rats. Research Journal
of Pharmacy and Pharmacology, 11(6):
2538-2540.
[14] Kumar P., Wasim L., Chopra M. and Chhikara A.,
2018. Co-delivery of Vorinostat and
Etoposide Via Disulfide Cross-Linked
Biodegradable Polymeric Nanogels: Synthesis, Characterization, Biodegradation, and Anticancer
Activity. American Association of Pharmaceutical
Scientists PharmSciTech, 19(2):634-647.
[15]Maheshbhai R., Dave R., Patel K. and Patel J.K.,
2012.RP-HPLC Method Development and
Validation of Etoposide. Journal of Pharmacy
Research, 5(7):3618-3620.
[16]Wakte P., Patil A., Bhusari S., Quazi M., Jabde S.
and Shinde D., 2014. Optimization of microwave-assisted extraction for picroside I and picroside II
from Picrorrhizakurroa using Box-Behnken
experimental design. Frontiers of chemical science
and engineering, 8(4): 445–453.
[17]Francis A.O., Adebanjo J.A.and Cyprian O.O.,
2018. Appraisal of Bioenhancers in Improving Oral Bioavailability: Applications to Herbal
Medicinal Products. Journal of Pharmaceutical
Research International, 24(4): 1-23.
[18]Bhusari S.S, Pharmaceutical Composition for
Enhancing Bioavailability or Biefficacy of A Drug. IND, Patent 201721000684.2017.
[19]Note for guidance on validation of analytical
procedures: text and methodology. European Medicines Agency: 1995; 1-15.
[20]Validation of analytical procedures: text and