Abstract—Despite the consequent development of solar thermal systems in many countries, there are many difficulties which to a large extent hamper the implementation of these products. The summary of discussions of the R & D seminar organized by ADEME1 in Sophia Antipolis (27 – 28 April 2004)
about "the need for innovation in solar thermal", states that solar thermal systems currently available in the market are added to the building without real integration. The problems, both technical and aesthetic, are the obvious obstacles to the development of this type of systems. For these reasons, in the frame of the present work, a new flat plate solar collector with high building integration and a prototype of this collector were developed. A numerical thermal model, developed in Matlab® environment by using a finite difference model was validated. Then, a modelling of the solar system was realized and the performance of the proposed system was optimized for various solar collector configurations.
Index Terms—Solar system, building integration, solar thermal collector.
I. INTRODUCTION
The solar industry is relatively mature, the cost of these products is stabilized and it is likely to evolve quite slightly over the upcoming years: other than a scale effect resulting from rapid growth markets, only a technological breakthrough in the act of conception, could significantly change the economic level.
The following barriers are identified (in order of importance): financial, technical and psychological (the psychological barriers are related with the aesthetics and the rigidity of the architectural codes [1]).
Installations using solar energy (or wind energy) have negative visual impact and this discourages some potential users. Photovoltaic systems already provide to users and designers, in terms of aesthetics, a flexibility of application in particular through the small cell size and flexibility of electrical wiring, unlike hydraulic lines. This greatly increases their potential for building integration [2], [3].
However, in some countries such as France, the law remains rigid and promotes the appearance of a home to its energy aspect. Although there is a recent release, the conditions are strict, and tend, at the same time that financial aid at a maximum integration of energy components.
Manuscript received July 30, 2013; revised September 4, 2013. Chr. Cristofari, G. Notton, and J. L. Canaletti are with the University of Corsica, Georges Peri Laboratory, Vignola, UMR CNRS 6134- Sanguinaires road- F20000 Ajaccio, France (e-mail: [email protected], [email protected], [email protected]).
Chr. Lamnatou is with the University of Lleida, Applied Physics Section of the Environmental Science Department, c/Pere Cabrera s/n, 25001 Lleida, Spain (e-mail: [email protected])
1 Agence de l’Environement et de la Maitrise de l’Energie
Government guidelines are also reaffirming the priority given to the solar technologies integration into the building in order to promote friendly aesthetic solutions landscape and architecture, and position the industrial sector and artisans on a higher value added [4].
Nowadays, urban solar energy systems change the design and the functions of buildings. This is because solar installations can be elements of building envelope and (at the same time) energy producers.The building integration of solar thermal systems currently is possible since most of these systems can be considered as technical elements and they are confined to the roof where solar radiation is most important, but also where poor integration will be less visible [5]-[7]. Off-roof integrations (very rare), offer a great opportunity in terms of the available surface, but also greatly increase the visibility of the facilities.
Munari Probst and Roecker [8] conducted a study based on a questionnaire sent to more than 1,500 architects, engineers and façade designers across Europe. The idea was to ask the professionals what they thought of the different integration solutions proposed in the questionnaire. According to the respondents (11%-170), it is clear the need for the development of new collectors as part of energy and multifunctional building.
On the other hand, the color of the solar absorber could be an important argument in terms of architectural quality. Anderson et al. [9] studied the thermal performance of solar collectors of different colors, unknown concept a few years ago. The study concluded that new technologies of colored solar absorbers, manufactured by depositing thin layers, allow obtaining an acceptable performance. Their lack of performance compared to a black absorber (or dark blue for some selective surfaces) could be offset by their better architectural integration and thus justify a growing interest in the future [10].
Hassan et al. [11] studied the performance of a solar flat plate collector in-roof and fitted horizontally, replacing the hip. The typically ridge tile is then "truncated" and the rear face of the collector corresponds to the frame housing. The authors announced an annual solar fraction of 85% for a family with 4 persons and an installation of 4 m².
De Beijer [12] introduced an integrated collector, also replacing the hip. The collector was composed of two glass tubes, one inside the other. The space formed by the two tubes was vacuum space in order to limit the losses by convection. The inner tube served as storage container for water. The outer tube was coated with a selective solar absorber on its outer face. The heat was transferred from the outer tube to the inner tube by evaporation and condensation of the fluid. The author did not provide any information on its performance or its cost.
Identification of the Optimum Flow Rate for a Patented
High Building Integration Solar Collector
Huang et al. [13] introduced a collector acting parapet and could be considered as a building component. This dual function of solar collector and building materials could greatly reduce costs, but such a facility involves a very high angle collector near the vertical, which favors winter efficiency. The outer glass was colored to satisfy the architectural needs. The author said, without too much detail, a daily efficiency between 34 and 39% for a 75° titled and for different colors of glass.
Thus, in the frame of the present work, a solar collector with high building integration was developed and evaluated. In this way, the present work fills the gap in the field of solar thermal systems which are really integrated into the building while the proposed system provides advantages from technical as well as from aesthetic point of view.
II. PRESENTATION OF THE SOLAR COLLECTOR AND OF THE
THERMAL EXPERIMENT
A. The Water Solar Thermal Collector
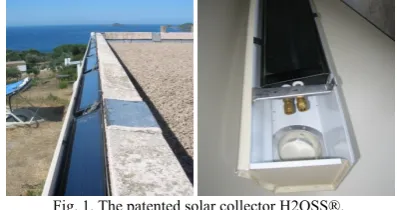
The patented solar water collector H2OSS® presents a high building integration without any visual impact from the ground because it is inserted within a drainpipe (Fig. 1) which conserves its rainwater evacuation role. It can be used both on east, west or south oriented walls (the collector being oriented south into the drainpipe). A north orientation is excluded due to important shading effects. The canalizations connecting the house to the heating collector are hidden in the vertical drainpipe. An installation consists in several connected modules. One module is about 1 m length and 0.1 m in width (individual houses), larger modules can be developed for buildings. The number of modules depends on the drainpipe length.
Fig. 1. The patented solar collector H2OSS®.
The structure of the H2OSS® solar collector is composed by a glass, an air layer, a highly selective absorber and an insulation layer (Fig. 2). The cold fluid flows from the tank through the inferior insulated tube and then in the upper tube in thermal contact with the absorber.
Fig. 2. The solar thermal module structure.
B. The Experimentation
The experimentation (Fig. 3) has as objectives to test the thermal behaviour, to validate the thermal model and to improve the performances by some parameter adjustments. It is located on the laboratory site situated in the gulf of Ajaccio (latitude: 41°55’ N; longitude: 8°55’ E) at about 200 m from the Mediterranean Sea and at an altitude of 70 m. This experimentation allows to operate closer to the European Standard EN 12975-1 [14]: 4 rows of 4 thermal modules (1.8 m²), connected in serial or parallel, are fixed on a solar tracker for a better control of the solar intensity and direction.
Fig. 3. The experiments: the solar tracker with H2OSS modules.
The solar modules are connected to a thermal loop which regulates the input fluid temperature heating the fluid if it is too cold and cooling it in the other cases using an air cooler. Every minute are collected: solar irradiance on the collector plane (measured by a Kipp & Zonen CM11 pyranometer), ambient temperature, humidity, wind speed and direction, fluid flow rate and input and output fluid temperatures (for each module).
This experiment allows to plot the performances of the new solar collector and to compare them with the performances of a conventional solar one (Buderus 3.0) measured on the same site for the same collector surface area. Fig. 4 shows the efficiency (η) in stationary conditions versus the reduced temperature Tr. [15] for the Buderus solar collector and the H2OSS in parallel and serial configurations. The efficiencies were calculated experimentally for various measured reduced temperatures and a linear regression is applied in order to determine the optical efficiency and the thermal losses according to equation (1) :
with / (1) where Φ is the solar irradiance, Tm is the average temperature,
Tamb is the ambient temperature, B is the optical efficiency (dimensionless) and K represents the thermal losses (W.m-2.K-1) [16].
Fig. 4. Efficiencies vs the reduced temperature for H2OSS and Buderus SKN. 3.0.
0.1 0.2 0.3 0.4 0.5 0.6 0.7 0.8 0.9
0 0.005 0.01 0.015 0.02 0.025 0.03 0.035 0.04 0.045 0.05
Reduced temperature (K.m2.W-1)
E
ff
ici
en
cy
The values of optical efficiency and thermal losses are given in Table I.
TABLE I: OPTICAL EFFICIENCY AND THERMAL LOSSES Buderus SKN
3.0.
H2OSS serial
H2OSS parallel
Optical Efficiency B 0.786 0.890 0.906
Thermal Losses K
(W.m-2.K-1) 4.31 13.50 8.99
If our optical efficiency is high, we note a bad coefficient relative to the thermal losses. This difference is due to the geometry of the H2OSS® modules. The thermal losses on the sides of the modules are more important and so the performances decrease rapidly when the reduced temperature increases. The performances of the H2OSS collector are better with a low reduced temperature and it woks better when the temperature of the input water is low; consequently, it seems more interesting to use a water storage tank with a thermal stratification inducing to work at low flow rate; thus, the water coming from the tank to the solar collector will be colder.
In Fig. 5 thermal performances for the two solar collectors for two days with similar meteorological conditions are illustrated. The input water temperature is 60°C corresponding to a high reduced temperature unfavourable to the H2OSS collector; the meteorological data, the water temperatures and the useful thermal power per m² are plotted in Fig. 4.
Fig. 5. Comparison of the two solar collectors performances.
We note that, around the solar zenith, the gap between the two useful powers is about 100 W.m-2. This period is
unfavourable to the H2OSS collector because the reduced temperature is high. In decreasing this temperature, the gap will be reduced and reversed when the reduced temperature will reach about 0.013 K.m²/W as it can be seen in Fig. 4. Consequently, the thermal performances of the H2OSS collector are good for low reduced temperatures and the thermal losses are greater than it is observed in conventional solar collector with simple cover and selective absorber. Thanks to the use of a numerical study, it will be possible to test various new configurations of the solar system using the H2OSS collector and to find some improvements.
III. THE THERMAL MODEL
A brief description of the model for the thermal behaviour
of the solar domestic hot water system described in Fig. 6. (and detailed in two previous papers [17-18]) is presented; it consists in two main models :
- a thermal model of the H2OSS module which calculates various temperatures into the solar collector [17].
- a thermal model of the hydraulic loop comprising the water storage and the water distribution circuit developed by
A. The H2OSS Solar Collector
The particular geometry of the solar thermal collector which has lateral faces much wider than a conventional collector relatively to its collecting surface, generates a specific thermal behaviour.
We developed a bi-dimensional model with thermal transfer composed of a serial assembling of one-dimensional elementary models. The domain is broken up into elementary isotherm volumes and for each node (97 nodes) we write a thermal balance equation using an electrical analogy. All the parameters of this model (such as module length, number of modules, physical properties of materials, geometry, convective coefficients, contact resistances, etc) can be easily changed in such a way that we can estimate the influence of future changes on the thermal performance of the solar module.
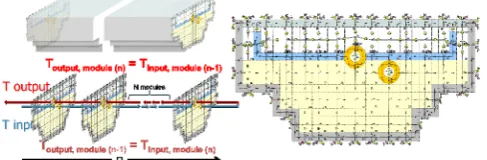
The solar collectors can be connected in serial or parallel; in the first case, in the flow direction, the output fluid temperature of the first module becomes the input fluid temperature of the next one (see Fig. 7); in the second case, the output temperature is the same for all the lines of modules and the total water flow rate is the sum of the flow rates of each line. We obtain a system of 97 differential equations solved using an iterative method (each differential equation is solved by using the implicit Euler method). The input variables for this model are: the solar irradiance Φ, the ambient temperature Tamb, the air speed v, the sky temperature
Tsky, the cold fluid temperature for the first module and the gutter temperature Tgutter.
Fig. 7. Electrical analogy of the solar thermal collector and serial connexion. 20
30 40 50 60 70
11:00 11:29 11:58 12:27 12:56 13:24 13:53
Time
Tempe
ratur
e (
°C)
0 200 400 600 800 1000
Sola
r I
rr
adia
n
ce -
U
seful
Power
per
m² (W/m
²)
Tamb Buderus Tinput Buderus
Toutput Buderus Tamb H2OSS
Tinput H2OSS Toutput H2OSS
Solar Irradiance Buderus Pu/S Buderus
Solar Irradiance H2OSS Pu/S H2OSS
Haillot et al.[18].
This thermal model was implemented and validated from experimental data. A solar module was specially instrumented with 9 thermal sensors measuring the surface temperature in 9 specific points spread over the glass, the blade, the absorber, the insulation and the two faces [17]. The water output and input temperatures were also recorded. The experimental validation shows that the developed model has a good accuracy with the measured data : the relative root mean square errors are around 5% for the water temperatures and from 4.6 % to 10% for the internal ones [17].
B. The Hydraulic Loop
During the experimental phase, we noted that one of the essential problems with our solar collector is the hydraulic resistance due to the linear structure of our collector. Consequently, it would be wise the fact that this solar system works in low flow rate conditions. By reducing the hydraulic losses, the low rate regime has also other advantages as [19]. Thermal stratification : using low flow operation results in an increased outlet temperature from the solar collector and consequently induces a higher degree of thermal stratification inside the heat storage; moreover, the temperature at the top of the storage will be closer to the desired load temperature. Therefore, the auxiliary energy consumption will be decreased which increases the solar fraction. Further, with highly stratified heat storage the return temperature to the solar collector will be lowered and the working periods for the solar collector will be longer, which implies in an
– Piping in the solar collector loop: with low flow systems it is possible to use smaller pipes, in this way first less material is used for pipes and insulation and secondly the heat losses are reduced.
– Pump: The energy consumption of the circulation pump is decreased which is very important in our case.
The thermal loop behaviour is simulated by using a divided in 19 nodes : 7 for the fluid circulation, 10 for the storage tank (optimal number of nodes in order to take into account optimally the thermal stratification [19]) and 2 for the water inlet and outlet in the storage (see Fig. 8). The temperature of the water at the outlet of the solar collector and the average temperature of the solar absorber are obtained from the modelling of the solar collector, keeping in mind that the 97 temperatures in the solar collector must be computed for determining these two temperatures.
Fig. 8. Model nodes definitions [18].
The energy balance, in 1-D, is applied and an iterative method is used to solve the first order differential equations. A reversion-elimination mixing algorithm based on a thermal mix of some storage tank nodes to obtain a correction factor in order to have a positive temperature gradient from the bottom to the top of the tank [23,24] is used to simulate the thermal stratification in the tank. The tubes between the tank and the solar collector are 20 meters long for half inside (the ambient temperature is then the temperature of the interior of the building) and for half outside of the building and the thermal losses are taken into account. The coil heat exchanger is modelled by 5 nodes and the thermal power between the heating fluid and the water into the tank is calculated by using the NTU method [25].
The domestic hot water is extracted according to a given daily water consumption profile seen in Fig. 9 from the top of the tank (Node ST10), then used at temperature THW and in the same time an equivalent amount of fresh water at temperature TCW (depending on the month and the site) is introduced into the tank in the node ST1. The thermal losses between the water distribution network and the tank, and between the storage tank and the water network of the building are taken into account.
Fig. 9. End-user daily load profile [26].
The French Scientific and Technical Centre of Building (CSTB) analysed the performances of 120 solar thermal systems working in real conditions and recommends giving to the user water at 50°C [27]. This temperature allows to reduce the energy consumption but the risk of legionella development exists, thus for avoiding this, it is necessary to use a thermal flash at 70°C [27-28]. The auxiliary heating is activated when the temperature in the node ST8 falls under 50°C and stopped when it reaches 55°C.
Generally, in conventional solar system, the pump is switch on or off in comparing the temperature in the bottom of the tank with the output temperature of the solar collector; however, in a conventional system, the collector is inclined and the hot fluid climbs by natural convection to the temperature sensor situated on the top of the collector when the pump is stopped. In our case, the input and the output of the thermal fluid are at the same level that annihilate the natural fluid movement and does not allow to measure the increase of the temperature. Thus, we chose another mode of regulation: the pump is activated when the difference between the absorber and the ST1 node exceeds the following threshold dON defined by :
0 10 20 30 40 50 60
0:00 2:00 4:00 6:00 8:00 10:00 12:00 14:00 16:00 18:00 20:00 22:00 0:00
Hours
W
a
te
r c
ons
um
pt
ion (
L.
h
-1)
increased output energy from the solar collector [20], [ 21].
0,16 20 9 (2) The pump is switch-on when:
9 17
and (3)
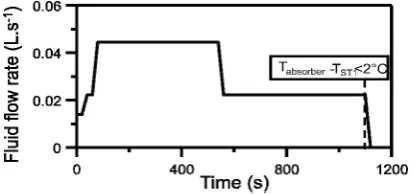
Then the flow rate is regulated as seen in Fig. 10. After a rapid increase of the flow rate, the pump runs at peak power and then continues at half capacity and it is stopped when
(Tabsorber-TST1) is less than 2°C.
Fig. 10. Flow rate variation of the pump.
This regulation method is used by some solar thermal collector manufacturer such as Wagner & Co [29] and Buderus [30]. The model described for the thermal loop was tested and validated by Haillot et al. [18] from measured data in year 2008. The comparison between experimental and computed data conduced to a relative root mean square error of 8.6% for the yearly average solar fraction; these results allow to consider that this thermal loop model is validated. In order to illustrate the thermal behaviour of the storage, we plotted in Fig. 11. the evolution of the temperatures ST1 to ST10 into the tank and we see clearly the stratification phenomenon that occurs.
Fig. 11. a) Illustration of the thermal stratification into the storage tank.
Fig. 11. b) Meteorological conditions.
The two models have a good accuracy and can be coupled to simulate the thermal behaviour of the total solar system. The solar collector model will calculate 97 temperatures but only the output water temperature and the absorber temperature will be introduced in the thermal loop model.
IV. OPTIMISATION OF THE SOLAR COLLECTOR STRUCTURE
Our objective is to improve the performances of our solar collector in optimizing with the working conditions as the fluid flow rate. This optimization is realized through several simulations by using the two coupled models described previously in varying the configuration of the system.
A.
In order to choose the optimal configuration, we calculate during each simulation the following data :
y the working time of the pump and its electrical energy consumed;
y the working time of the electrical auxiliary heater and its electrical energy consumed;
y the thermal energy drawn to the storage tank i.e. useful for the user;
y the thermal energy produced by the solar system (solar and electrical);
y the part of the thermal energy produced by the solar resource.
V. THE THERMAL LOSSES BY THE STORAGE TANK AND THE
DISTRIBUTION WATER NETWORK.
From these data, we defined three solar fractions : • SF : the conventional Solar Fraction which is the ratio of
the total Solar energy delivered to the tank EThermal,Solar (kWh) and the total energy delivered to the tank EThermal (kWh). EThermal is the sum of the solar energy delivered to the tank and the auxiliary energy delivered to the tank EElectrical ,AuxHeat .
, /
, / , ,
(4) • SF+: we noted during the experiment that important
hydraulic losses occur in the solar collector due to the serial connexion of the thermal modules. These hydraulic losses induce the necessity to use an electrical pump with a high peak power and consequently to a high electrical consumption for the fluid circulation.
Consequently, it seems necessary to take into account the supplementary electrical energy due to the pump working in the calculation of the solar fraction and we added the electrical energy consumed by the pump EElectrical, pump to the electrical energy used for the auxiliary heating :
,
, , ,
(5) • SF++: the value of electric power and thermal energy
differs due to the form of energy. Electricity is a high-grade form of energy since it is converted generally
5 15 25 35 45 55 65 75
180 220 260 300
Time (min)
T
em
per
atu
res
(
°C)
0.E+00 2.E-05 4.E-05 6.E-05 8.E-05 1.E-04
F
lo
w
rat
e (L
/s
) - Au
xi
lia
ry
H
ea
ter (
YES o
r N
O
)
T ST1 T ST2 T ST3 T ST4 T ST5 T ST6 T ST7 T ST8 T ST9 T ST10
Auxiliary Heater (YES or NO) Pump Flow rate (L/s) Water flow rate by user (L/s)
YE
NO
0 200 400 600 800 1000
180 200 220 240 260 280 300
Time (min)
Sola
r Ir
radi
ance
(W
.m
-²
)
-5 0 5 10 15 20 25 30
Tem
per
atur
e (
°C
)
Wind Spee
d (
m
/s)
Solar Irradiance Ambient Temperature Wind Speed
from thermal energy. To take into account this consideration, Huang et al. [31] suggest using the energy-saving efficiency also called overall thermal efficiency [32-34]. In this efficiency the thermal energy is converted into electrical energy via an electric power generation efficiency ηTher-Elec considering a
conventional power plant. ηTher-Elec is taken equal to 0.38
[31-34]. This formulation suggests energy equivalence between electricity and thermal energy with an electrical to thermal ratio equal to 2.63 (1/0.38). To take into account this difference of quality of energy, we introduced the solar fraction SF++ converting the electrical energy in thermal one:
, /
, , , (6)
We saw during the experiment (see paragraph 1.2.) that an important problem for our collector is the heat losses due to the particular shape of the H2OSS collector. The objective being to reduce the temperature of the absorber, we wanted to test, after preliminary studies, a new configuration of the H2OSS collector called New Version (see Fig. 12).
Fig. 12. The two versions of the solar collector H2OSS used for the optimization.
Our optimisation study is realized from the variation of the three solar fractions for a solar thermal system used by a family of 4 persons living in Corsica and composed by 35 serial connected modules H2OSS (4 m²) and a storage tank of 200 L.
First, we verified that the utilization of 35 serial solar modules does not conduce to a saturation of the temperature i.e. that the water temperature continue to increase. Fig 13 shows, in steady-state, the evolution of the water temperature versus the number of solar thermal modules (for a solar irradiance = 750 W.m-2, an ambient temperature = 25°C, a
wind speed equal to 1m.s-1 and a flow rate = 60 L.h-1) for the
two versions of the solar collectors.
Fig. 13. Evolution of the water temperature versus the number of the solar thermal modules for a) the current version
Fig. 13. Evolution of the water temperature versus the number of the solar thermal modules for b) the new version of solar collector.
We clearly note a more rapid phenomenon of saturation for the new version of solar collector but we can conclude that it is possible to install in serial efficiently 50 solar thermal modules i.e. 50 meters of gutter (rarely available in a conventional house). We used a pump for the fluid circulation with an electrical power calculated proportionally to the flow rate between 30 W for 15 L.h-1 to 250 W for 200
L.h-1.
Our calculations are realized for a winter month (January) and a summer one (July) from meteorological data collected on the site of your laboratory in Ajaccio, Corsica.
We successively varied the fluid flow rate, the air thickness between cover and absorber (reduction of convective losses by the front face), the insulation thickness (decrease of back and lateral thermal losses) and the cover emissivity (decrease of front radiative losses).
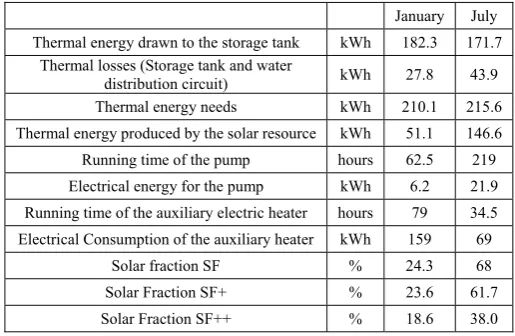
The domain of variation of these parameters must be realistic for two reasons: the dimensions of the solar collector must stay in the commercial standards and the gutter must continue to evacuate the rainwater (limits of the thermal insulation). In order to illustrate the calculations realized for each configuration of the solar collector, we show in Table 2, the various monthly energies (January and July) previously presented for the current configuration.
TABLE II: EXAMPLE OF CALCULATION OF THE SOLAR FRACTIONS FOR THE CURRENT CONFIGURATION OF THE SOLAR COLLECTOR IN JANUARY AND
JULY
January July
Thermal energy drawn to the storage tank kWh 182.3 171.7 Thermal losses (Storage tank and water
distribution circuit) kWh 27.8 43.9
Thermal energy needs kWh 210.1 215.6 Thermal energy produced by the solar resource kWh 51.1 146.6 Running time of the pump hours 62.5 219 Electrical energy for the pump kWh 6.2 21.9 Running time of the auxiliary electric heater hours 79 34.5 Electrical Consumption of the auxiliary heater kWh 159 69
Solar fraction SF % 24.3 68
Solar Fraction SF+ % 23.6 61.7
Solar Fraction SF++ % 18.6 38.0
We note that the monthly energy needs in winter and summer are slightly different (2%) because in summer the mean temperature of the storage tank is slightly higher than in winter. We also note that the values of the three solar
30 35 40 45 50 55
10 20 30 40 50 60 70 80 90 100
Number of thermal solar modules
W
ate
r te
m
per
atu
re
(°C
)
30°C 35°C 40°C 45°C 50°C 55°C Input water temperature
30 35 40 45 50 55
10 20 30 40 50 60 70 80 90 100
Number of solar thermal modules
W
ater
t
em
pera
tur
e (°
C
)
fractions are very different particularly during summer because the running time of the electrical pump is greater in this period of the year. We can therefore expect different results in the optimization phase according to the chosen solar fraction.
A.
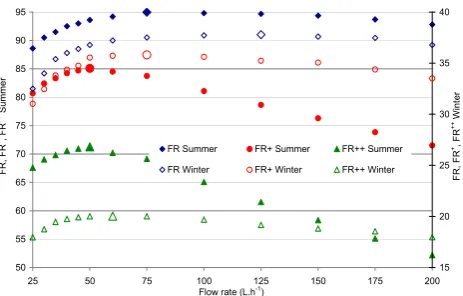
Fig. 14. The various solar fractions versus the water flow rate for a) the current version
Fig. 15. The various solar fractions versus the water flow rate for b) the new version of the solar collector.
Firstly, we see in Fig. 14 but also in Fig. 15 that the performances of the new version of the solar collector are better than the performances of the current version. Thus, in the following optimization, we will only consider the new version of our solar thermal collector.
The presence of an optimum flow rate is more obvious using SF+ and SF++ because the electrical consumption of the water pump is taken into account and these two parameters are a better indication of the performance level of our system. It appears that the optimal flow rates are respectively 50 L.h-1 and 75 L:h-1 for summer and winter,
respectively, for the new configuration and for the current version.
For the winter period, the performances gap between a flow rate equal to 50 L.h-1 or 75 L:h-1 is lower than in the
summer period, thus, the optimum water flow rate for our new system is taken equal to 50 L.h-1 and the following
optimization calculations will be realized for this flow rate; which is considered as a low flow rate, in fact we consider as a low flow rate, a value between 7 and 15 L.h-1.m-2 [36] i.e.
for our 4 m² between 28 and 60 L.h-1.
VI. CONCLUSIONS
The numerical models developed in this work allowed to propose new configurations for the H2OSS thermal solar collector on the basis of experimental findings. The solar collector was optimized numerically for a conventional installation for an individual housing in the South of France. The new positioning of the cold water tube, into the absorber, and no more in the insulation, has shown much better performance than with the actual prototype (the annual fraction passes from 41% for the current version to 76% for the new optimized version). The influence of the water flow rate was very high due to the particular conception of this new solar collector.
This new configuration of the H2OSS concept will be implemented soon in the form of a prototype and it will be able to experimentally validate the numerical results.
REFERENCES
[1] S. Intrachooto, “Technological innovation in architecture: effective practices for energy efficient implementation,” Massachusetts Institute of Technology, Dept. of Architecture, 2002.
[2] I. B. Hagemann, Gebäudeintegrierte Photovoltaik. 2002.
[3] T. Reijenga, What do architect need?, Switzerland, IEA-PVPS 7-03:2000, 2000.
[7] R. Krippner, “Solar Technology - from innovative building skin to energy efficient renovation, Birkhauser,” Solar architecture, pp. 27-37, 2003.
[8] M. M. Probst and C. Roecker, “Towards an improved architectural quality of building integrated solar thermal systems (BIST),” Solar Energy, vol. 81, no. 9, pp. 1104-1116, 2007.
[9] T. N. Anderson, M. Duke, and J. K. Carson, “The effect of colour on the thermal performance of building integrated solar collectors,” Solar Energy Materials and Solar Cells, vol. 94, no. 2, p. 350-354, 2010. [10] W. Weiss and I. Stadler, “Facade integration - a new and promising
opportunity for thermal solar collectors,” Workshop of the IEA Solar Heating and cooling programme, 2001.
[11] M. M. Hassan and Y. Beliveau, “Design, construction and performance prediction of integrated solar roof collectors using finite element analysis,” Construction and Building Materials, vol. 21, no. 5, pp. 1069-1078, 2007.
[12] H. De Beijer, “Product development in solar water heating,” Renewable Energy, vol. 15, no. 1-4, pp. 201-204, 1998.
[13] B. J. Huang, Y. H. Lin, W. Z. Ton, T. F. Hou, and Y. H. Chuang, “Building integrated solar collector,” presented at the World renewable energy congress, Sweden, 2011.
[14] European Standard EN 12975-1. Thermal solar systems and components — Solar collectors — Part 1: General requirements. March 2006.
[15] J. A. Duffie and W. A. Beckman, Solar engineering on thermal process. John Wiley & Sons Ed, 2006.
[16] F P. Incropera, D. P. DeWitt, T. L. Bergman, and A. S. Lavine, Fundamentals of Heat and Mass Transfer, 6th ed., John Wiley, ISBN 978-0-471-45728-2; 2007.
30 35 40 45 50 55 60 65 70 75
25 50 75 100 125 150 175 200
Flow rate (L.h-1)
FR
, F
R
+, FR ++ Sum
m
er
7 9 11 13 15 17 19 21 23
FR
, F
R
+, F
R
++ W
int
er
FR Summer FR+ Summer FR++Summer
FR Winter FR+Winter FR++Winter
50 55 60 65 70 75 80 85 90 95
25 50 75 100 125 150 175 200
Flow rate (L.h-1)
FR
, F
R
+, F
R
++ Su
mme
r
15 20 25 30 35 40
FR
, FR
+, FR ++ W
int
er
FR Summer FR+ Summer FR++ Summer
FR Winter FR+ Winter FR++ Winter
Influence of the Flow Rate
Using a low flow rate allows a thermal stratification of the storage, a reduction of the hydraulic losses and consequently a small pump power and tube diameter [20], [21]. Hollands and Lightstone [35] calculated an annual energy gain of 38% compared with a solar system with high flow rate and Cristofari and al. [19] an annual gain of 5.25%. As we noted previously, the hydraulic losses are high and consequently, to take into account the electrical consumption of the pump in FR+ and FR++ should modify the optimization results compared with the use of FR.
[4] Ministry of Ecology, Environment, Transport and Housing, Energy
Policy - Ministry of Sustainable Development. (2012). [Online]. Available:http//:www.developpement-durable.gouv.fr/Politique-energ etique.html.
[5] T. Herzog, ―Solar Design,‖Birkhauser, vol. 3, 1999.
[6] R. Krippner and T. Herzog, ―Architectural aspects of solar techniques
[17] F. Motte, C. Cristofari, G. Notton, and J. L. Canaletti, “Numerical studies of a an innovative patented solar drainpipe,” International Journal of Environmental Science and Develp (IJESD), vol. 2, no. 3, pp. 228-232, ISSN : 2010-0264, 2011.
[18] D. Haillot, F. Nepveu, V. Goetz, X. Py, and M. Benabdelkarim, “High performance storage composite for the enhancement of solar domestic hot water systems Part 2: Numerical system analysis,” Solar Energy, pp. 64-77, 2012.
[19] C. Cristofari, G. Notton, P. Poggi, and A. Louche, “Influence of the flow rate and the tank stratification degree on the performances of a solar flat-plate collector,” Int. J. of Thermal Sciences, vol. 42, no. 5, pp. 455-469, 2003.
[20] L. J. Shah, “Investigation and modeling of thermal conditions in low flow SDHW systems,” Department of Buildings and Energy Technical University of Denmark Report R-034, 1999.
[21] S. Furbo, “Optimum design of small DHW low flow solar heating systems,” ISES Solar World Congress Budapest Report 93-24, 1993. [22] D. Haillot, “PCM for optimization of solar thermal collector: materials
and process,” phD dissertation, University of Perpignan, France, 2009 (in french).
[23] D. Mather, K. G. Hollands, and J. Wright, “Single- and multi-tank energy storage for solar heating systems: fundamentals,” Solar Energy, vol. 73, pp. 3-13, 2002.
[24] F. Nepveu, “Décentralized electricity and heat production by using Parabole/Stirling: Application au système EURODISH,” phD dissertation, University of Perpignan, 2008.
[25] K. Shah and A. C. Mueller, “Heat Exchangers,” Handbook of Heat Transfer Applications. W. M. Rohsenow, J. P. Hartnett, E. N. Ganic Editors. Mc Graw Hill, 1985.
[26] NF EN 13203-1, Domestic appliances producing hot water using gaseous fuels, appliances less than or equal to 70 kW and a storage capacity of less heat input equal to 300 liters, Part 1 Evaluation of the performance fetching hot water, European standard, 2006.
[27] Buscarlet C and Caccavelli D, Energy monitoring and evaluation plan sun - domestic solar water heaters. Report CSTB DD/ENR-05.035RS, July 2006.
[28] ADEME, Réduction of energy consumption, Technical Sheet, 03/01/2006.
Pr. Christian Cristofari was born in Ajaccio. He studied at the National Polytechnic Institute of Toulouse (INPT) and received Dr. degree in 2000 and Research Agreement in 2006 from the same university His field of interest includes renewable energy systems, thermal conversion and renewable sources. He is today Professor and Director of the Corsican Institute of Technology. He is the head of the Research Centre of Vignola, University of Corsica, UMR CNRS 6134, Georges Peri Laboratory, F20000 Ajaccio, France- he is in the Management Committee of the Action TU1205 « Building Integration of Solar Thermal Systems (BISTS) » Represents France in European COST action.
Publications: more than 45 international publications and 100 conferences
Gilles Notton was born in Saint Avold, France, on January 23rd, 1964. He studied at the University of Corsica and received Dr. degree in 1992 and Research Agreement in 2002 from the same university His field of interest includes renewable energy systems and renewable sources. He is today assistant professor and responsible of the French Research ADEME network between France and Oriental and Central European Countries. He works in the Research Centre of Vignola, University of Corsica, UMR CNRS 6134, Georges Peri Laboratory, F20000 Ajaccio, France- and he is in the Management Committee of the Action TU1205 « Building Integration of Solar Thermal Systems (BISTS) » Represents France in European COST action.
Publications: more than 35 international publications and 120 conferences
Jean-Louis Canaletti was born in Palaiseau, France on February 1st, 1964. He studied at the University of Corsica and received Dr. degree in 1998. His field of interest concerns integration of renewable energies in Building, solar energy study. He is today Assistant Professor in the Corsican Institute of Technology. He works in the Research Centre of Vignola, University of Corsica, UMR CNRS 6134, Georges Peri Laboratory, F20000 Ajaccio, France.
Publications: 4 international publications and 20 Conferences.
Chrysovalantou Lamnatou holds a PhD in
Mechanical Engineering (Aristotle University of Thessaloniki, 2010). She is currently working as assistant professor at the University of Lleida, in Spain (Applied Physics section of the Environmental Science dept., c/Pere Cabrera s/n, 25001 Lleida, Spain; e-mail: [email protected]), teaching environmental engineering technologies. In the past few years, her research has focused on: solar thermal systems for drying; fresnel lenses with CPV for greenhouses; numerical modelling of heat/mass transfer. Currently, she is conducting research in the field of life cycle analysis and green buildings with emphasis on PV-green roofs. She has 7 articles in international peer-reviewed journals, 8 articles in conferences and she is peer reviewer of 10 journals. She is participant from Spain in the European COST action TU1205 «Building Integration of Solar Thermal Systems (BISTS)». [29] Wagner & Co. (2011). Mounting system for roof TRICA for collector
EURO. [Online]. Available: www.wagner-solar.com.
[30] Buderus, SKN 3.0 Installation Manual - Flate Plate collectors,. 2007. [31] B. J. Huang, T. H. Lin, W. C. Hung, and F. S. Sun, ―Performance
evaluation of solar photovoltaic/thermal systems,‖Solar Energ, vol. 70,
pp. 443-448, 2001.
[32] A. Tiwari and M. S. Sodha, ―Performance evaluation of hybrid
PV/thermal water/air heating system: a parametric study,‖Renewable
Energy, vol. 31, pp. 2460-2474, 2006.
[33] A. Tiwari and M. S. Sodha, ―Performance evaluation of hybrid PV/thermal water/air heating system: an experimental validation,‖ Solar Energy, vol. 80, pp. 751-759, 2006.
[34] A. Tiwari and M. S. Sodha, ―Parametric study of various configurations of hybrid PV/thermal air collector: experimental
validation of theoretical model,‖Solar Energy Materials and Solar
Cell, vol. 91, pp. 17-28, 2007.
[35] K. G. T. Hollands and M. F. Lightstone, ―A review of low flow,
stratified-tank solar water heating systems,‖Solar Energy, vol. 43, no.
2, pp. 97-105, 1989.
[36] L. Kenjo, C. Inard, and D. Caccavelli, ―Experimental and numerical study of thermal stratification in a mantle tank of a solar domestic hot
water system,‖Applied Thermal Engineering, vol. 27, no. 11, pp.
![Fig. 9. End-user daily load profile [26].](https://thumb-us.123doks.com/thumbv2/123dok_us/1384563.1649220/4.595.68.269.633.775/fig-end-user-daily-load-profile.webp)