Abstract—Environmental design and quality has been known to have strong influence toward productivity and behavior. This research aims to discover the effect of Indoor Environmental Quality (IEQ) to human performance and discover the optimal combination of the IEQ aspects. This research also aims to examine human preference towards atmospheric cues to change their shopping behavior, in this case taking an example from airport shopping area. Combining both of these studies will draw a clear picture of the environmental design effect towards performance and behavior – which in this case is shopping behavior. Based on the research it’s found that temperature of 23.5oC, lighting of 500 lux and blue room color is the optimum combination in working environment, and store with in-store visibility, cool colors on window display, floors, wall and ceiling, and bright lighting for airport hallway is the preferred option in shopping area.
Index Terms—Choice-based conjoint, human performance, indoor environment quality, purchase intention.
I. INTRODUCTION
One of the basic human needs at work is a working environment that enable employee to work optimally and supported with comfortable conditions [1].
Indoor Environmental Quality (IEQ) can increase productivity from 0.5% to 5%. This estimation is considered through changes in performance related to the overall productivity and is usually in the form of direct actions such as speed and time needed to complete a task [2]. The IEQ factors that are considered affected productivity include room temperature, lighting condition and room color.
Another thing that environmental condition can affect is in the aspect of human behavior. Empirical studies support that atmosphere influence positive emotion then influence satisfaction and intention to purchase [3]. Satisfaction and intention to purchase are two of the human behavior examples that this research want to explore.
The term atmospheric was defined by Kotler as component of store image, including brightness and crowding [4]. Since then, research on consumer behavior was not only limited on how consumers respond to a product or service, but also on how consumers respond to environment. Atmospheric is one of the fields in environmental psychology which is often related to Stimulus-Organism-Response (S-O-R) model [5]. Stimulus is a trigger that affects organism. Once organism
Manuscript received October 11, 2016; revised February 14, 2017. The authors are with Universitas Indonesia, Indonesia (e-mail: [email protected], [email protected], [email protected], [email protected], [email protected], [email protected]).
captures the stimulus, they will process the stimulus which results to certain action or behavior. In S-O-R model, atmospheric is defined as a trigger factor (S) that may impact consumer (O) and their behavior (R).
This study will explore both the effect from environmental quality on human performance in their workplace and behavior – in this case on their intention to purchase. The purchase intention will be based on the passengers in Soekarno-Hatta International Airport, Indonesia.
II. METHODS
This study has different methods in pursuing the research’s goals. The study on human performance will be using Design of Experiments (DOE) with 3 factors and each factor has 2 levels of factors, therefore factorial design of 23 is used which will produce 8 treatment combined with 18 replications. The details of the 8 treatments can be found on Table I. Details on the factors and standard factors used were as follows:
1) Room temperature factor has two levels: the level of 23,5
o
C and 27,5 oC. 23,5 oC temperature selection is based on [6] mentioning 23,5 oC as the neutral temperature, proofing that participants gave better results than the higher temperatures in the research, which is 29,5 oC [6]. While the selection of 27,5 oC temperature taken from [7]. 2) Room lighting factor has two levels: the level of 300 lux
and 500 lux. Setting lighting to 300 lux and 500 lux is based on a review of literature that shows good lighting levels for an office job or in the room is 300 lux and 500 lux (e.g. [8]-[10]).
3) Room color factor had two levels: the level of green and blue. The color selection is based on previous research saying that cool color cause workers make fewer mistakes than the warm or neutral colors [11].
The dependent factor is human performance and will be affected by those 3 factors. Human performance measurement used a measuring instrument of verbal ability and numerical ability tests with accuracy or the numbers of correct answers and the speed of test execution as parameters. Verbal ability tests consists of 25 questions containing a set of problems of seeking synonym words, antonyms words, the analogy of the word, group of words, and comprehension of discourse. Numerical ability tests consist of 20 questions consisting type of sequence of numbers, basic math and word problems.
Besides through human performance, this study also measured subjectively the respondent's perspective. Subjective measurements include measuring the level of
Analysis of the Environmental Design and Quality to
Increase Human Performance and Behavior
comfort and satisfaction of the respondents as well as performance of each condition. Comfort and satisfaction of respondents were measured using a questionnaire modified from Indoor Background Survey Question.
TABLEI:DESIGN OF EXPERIMENT’S COMBINATION
Combination Temp. C Lighting (Lux) Room Color
Exam Type
1 23,5 500 Green A
2 23,5 300 Green B
3 27,5 300 Green C
4 27,5 500 Green D
5 23,5 500 Blue E
6 23,5 300 Blue F
7 27,5 500 Blue G
8 27,5 300 Blue H
While on purchase intention research, since its focus on atmospheric design, the research will use different method. Choice-Based Conjoint (CBC) analysis was conducted to analyze consumer preferences towards atmospheric design characteristics in SHIA terminal building. CBC is an application of discrete choice modelling used to analyze consumer decision-making [12]. CBC analysis also involves design of experiment, which is done to obtain combination of the attributes as well as choice sets that will be examined.
Experimental design is usually carried out using software, including a number of assumptions that must be fulfilled. The first assumption is that the experimental design must be orthogonal. In other words, correlation between attributes is minimum. The second assumption is about the maximum number of tasks that should be tested. The greater the tasks number, the lower the value of data reliability [12]. Therefore, a CBC questionnaire should consist of no more than 20 sets of questions.
A pilot study was conducted by interviewing experts, in order to design attributes and levels for each attribute. The interviewees were asked to categorize each atmospheric variable into two categories while also elaborate their answers, then they were asked to give rankings on the variables based on the importance levels.
There were eight variables that intersected to one another. They are window display, store signage, cleanliness, product display, store entrance, product signage, color scheme, and lighting. Based on the variables obtained, the Kendall’s W test was carried and the result was 0.51. That means, the variables can be used for the study.
Then, we use Friedman test to calculate the mean rank for each attribute. CBC analysis should only examine not more than six attributes. Based on this, the attributes obtained were window display, store signage, product display, store entrance, product signage and color schemes. After re-checking with the SHIA Managers, store signage, cleanliness and product signage were not included in airport authority, thus were replaced by lighting variable.
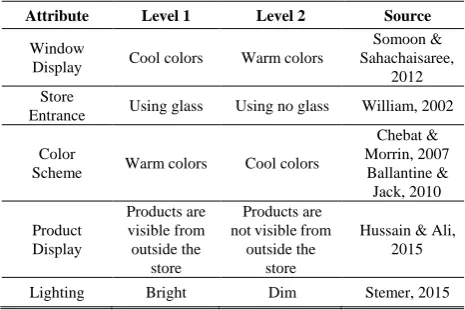
Literature study was done to determine the level of each attribute. The levels were limited to two levels for each variable. The breakdown of the attributes can be found on Table II.
The research used fractional factorial design to prevent the excessive profiles and choice sets that can cause fatigue to
respondents which lead to data inconsistency. The CBC questionnaires should consist of no more than 20 question sets [12]. The number of profiles would be 25 = 32 profiles but with fractional factorial design the number of profiles obtained was 8 profiles with 16 choice sets. The minimum sample was 399.96 ≈ 400 respondents based on the population size.
TABLEII:ATTRIBUTES AND LEVELS AS APPLIED IN THE QUESTIONNAIRE
Attribute Level 1 Level 2 Source
Window
Display Cool colors Warm colors
Somoon & Sahachaisaree,
2012 Store
Entrance Using glass Using no glass William, 2002
Color
Scheme Warm colors Cool colors
Chebat & Morrin, 2007
Ballantine & Jack, 2010
Product Display
Products are visible from outside the
store
Products are not visible from
outside the store
Hussain & Ali, 2015
Lighting Bright Dim Stemer, 2015
III. RESULT
In the research of the effect of environment towards human performance, the ANOVA method was used in processing factorial design. The calculation was done with Minitab 16 software. The ANOVA processing of verbal accuracy showed that the three factors which are room temperature, room light and room color have significant effect on the accuracy of verbal matter. This is also applied to ANOVA processing of numeric accuracy, processing time of verbal matter and processing time of numeric matter.
The perception of respondents’ satisfaction towards both temperature 23.5°C and 27.5°C were dominated with “satisfied” response with 60% and 30% respectively. The perception of satisfaction of respondents to the light of 300 lux is dominated by the response "Satisfied" with 36% and so does to the light of 500 lux with 50%. The perception of satisfaction of respondents to the room color of green dominated by the response "Satisfied" by 47% and to the room color of blue was also dominated by the response “Satisfied” by 47%.
The percentage of respondents’ satisfaction perception towards the combination of factors is displayed on Table III with SaTP = "Extremely Dissatisfied"; TP = "Not Satisfied"; SeTP = "Slightly Not Satisfied"; SeP = "Little Satisfied"; P = "Satisfied"; SaP = "Very Satisfied". Figures in parentheses are weighted value of each response. This table also shows the combination sequence with the highest score to lowest. The percentage of the respondents’ satisfaction perception to the response "Very Satisfied" with the highest value is in combination 5 with temperature of 23.5°C, 500 lux lighting, and blue color room. While the combination with the lowest weight value is combination 3 with temperature of 27.5°C, 300 lux light, and green color room.
for 38%. With the light of 300 lux, the comfort perception of respondents is dominated by the response of "Light" as much as 33% while with the light of 500 lux is dominated by “Light” with 65%. The comfort perception of respondents to green color for the room color was dominated by the response “Comfortable” with 58% while to blue color was dominated by the response “Comfortable” with 50%.
TABLEIII:SUMMARY OF RESPONDENT’S SATISFACTION
Combi nation
Answer
Total Value SaTP
(1) TP (2)
SeTP (3)
SeP (4)
P (5)
SaP (6)
5 0 0 0 5 8 5 90
1 1 0 1 3 10 3 84
4 0 0 3 5 8 2 81
2 0 1 2 5 9 1 79
6 0 0 4 5 7 2 79
7 0 1 3 6 7 1 76
8 0 1 5 9 2 1 69
3 0 2 6 5 5 0 67
The percentage of respondents’ comfort perception towards the combination of factors is displayed on Table IV with SaTN = "Strongly Comfortable"; TN = "Not Comfortable"; SeTN = "Slightly Not Comfortable"; SeN = "Slightly Comfortable"; N = "Comfortable"; SaN = "Very Comfortable". Figures in parentheses are weighted value of each response. This table also shows the combination sequence with the highest to the lowest score.
TABLEIV:SUMMARY OF RESPONDENT’S COMFORT
Combi Nation
Answer
Total Value SaTN
(1) TN (2)
SeTN (3)
SeN (4)
N (5)
SaN (6)
5 0 0 0 6 8 4 88
1 1 0 1 4 10 2 82
2 0 1 3 4 9 1 78
6 0 0 4 6 6 2 78
4 0 2 3 6 6 1 73
7 0 2 2 8 5 1 73
8 0 3 4 6 4 1 68
3 0 4 4 5 4 1 66
For the other research, the data obtained from questionnaires were processed using XLSTAT software. The first analysis explained the respondents’ preferences toward the attributes, displayed on Table V. The higher value implies respondents’ preferences.
IV. ANALYSIS
Based on the result, the respondents preferred window display design with cool colors, store entrance that uses glass, airport corridor design with cool colors, shopping area with products that are clearly visible from outside the store and the shopping area with high intensity light.
The next analysis is correlation analysis between atmospheric design and purchase intention. The analysis was performed with SPSS software using binomial logistic regression. This method was chosen since the dependent
variable, i.e. purchase intention, consists of two nominal categories, namely "interested in shopping" and "not interested in shopping." The result was that the atmospheric design has a significant influence on consumer purchase intention at the airport since the p value < 0.05.
TABLEV:UTILITY AND IMPORTANCE VALUES OF EACH ATTRIBUTES
Source Utilities Standard
deviation Importance
Window Display-Cool
colors 0,028 0,021
2,259 Window Display-Warm
colors -0,028 0,021
Store Entrance-Using glass 0,012 0,017
0,984 Store Entrance-Using no
glass -0,012 0,017
Color Scheme-Cool colors 0,094 0,019
7,691 Color Scheme-Warm colors -0,094 0,019
Product Display-Products are visible from outside the store
0,364 0,017
29,742 Product Display-Products
are not visible from outside the store
-0,364 0,017
Lighting-Dim -0,727 0,019
59,324 Lighting-Bright 0,727 0,019
TABLEVI:CONSUMER PREFERENCES BASED ON SOCIO-ECONOMIC STATUS
(SES)
SES
Preference
Attribute Level Picture
A+
Window
Display Warm colors Store
Entrance Using glass Color
Scheme Warm colors
Product Display
Products are visible from the outside
Lighting Bright
A, B, C
Window
Display Cool colors Store
Entrance Using glass Color
Scheme Cool colors
Product Display
Products are visible from the outside
Lighting Bright
D
Window
Display Warm colors Store
Entrance No glass Color
Scheme Cool colors
Product Display
Products are visible from the outside
Lighting Bright
Status (SES). The first class is SES D, with monthly expenditure of less than IDR 1,000,000. The second class is SES C, with total expenditure per month ranging between IDR 1,000,000–IDR 2,000,000. The third class is SES B, with monthly expenditure ranging between IDR 2,000,000–IDR 3,000,000. The fourth class is SES A, with monthly expenditures ranging between IDR 3,000,000–IDR 5,000,000. The fifth SES is A+, with monthly expenditure of more than IDR 5,000,000. The results are on Table VI.
V. DISCUSSION
Based on both researches that had been conducted, there is a positive effect from environmental design toward human performance and behavior. The environmental design can affect human’s feeling of comfort and satisfaction, while also can affect their behavior.
The three factors that are analysed in this research, which are temperature, lighting and room colour; has been discovered to have significant impact on human performance, measuring accuracy and speed using verbal and numerical questions. However, the interaction between each factor, has not been proven to have significant effect on human performance.
The optimal combination for verbal and numerical accuracy, as well as for verbal and speed is at temperature 23.5°C, lighting 500 lux and room colour blue. Meanwhile, the optimal combination for numerical speed is temperature 27.5°C, lighting 500 lux, and room colour blue. The optimal combination is also parallel with result of subjective measurement which is through the satisfaction level and comfort level of the respondent.
Passengers preferences on airport shopping area refer to atmospheric design with the following criteria: The colors used for the window display is cool colors, store entrance using transparent glass that allows passengers to see products from outside the store, the dominant colors used for floors, walls, and ceilings are cool colors, the products in the store are visible from outside the store, and high-intensity lighting (200 lx).
Comparing the results from both researches, there are similarities that can be found. First, how most of people prefer cool tone in the terms of indoor environment design. It’s shown by how blue room color is the preferred color to increase human performance, while it’s also chosen as the tone to increase human shopping behavior.
People also prefer the shopping area to be light, rather than dim and on human performance research it’s also found that the preference is on 500 lux light which is categorized as light. Both of these researches can also complement each other to give a better understanding about environment design that works better for human.
We can get general idea about what elements of design that are more preferred and work better. If the design is meant to attract attention, it’s best to put the room visible, covered with glass with enough light that can be considered as bright. To make the room has that cool-tone vibes, the light has to be white with cool color scheme for the walls, floors and ceilings like bluish white. If the room design was to improve
people’s work, it’s best to also give attention on temperature. The room should also have cool-tone like blue color with adequate light.
This research also suggests that socioeconomic class influences consumer preferences. Results from the second research shows that preferences between socioeconomic classes are slightly different to one another.
VI. CONCLUSION
From this research we can conclude that there are several similarities and difference in environmental design aspects in terms of what goals we want to achieve. If the goal is to increase productivity then aspects of room temperature, room color and room lighting are what should be focused on while if the goal is to increase the shopping tendencies them the product display, lighting and room tone are what should be focused on. This research provide insight for future references, so that the future indoor environmental design can apply the suitable design to attain the specific goal.
ACKNOWLEDGEMENT
We would like to give our sincerest gratitude to Direktorat Riset & Pengabdian Masyarakat (DRPM), Universitas Indonesia, for funding this study. Thus, this study can be properly carried out and produce such results. This research was also made possible by the support and assistance of a number of people. We would like to thank for their valuable and constructive opinions.
REFERENCES
[1] P. Roelofsen, “The impact of office environments on employee performance: The design of the workplace as a strategy for productivity enhancement,” Journal of Facilities Management, vol. 1, no. 3, pp. 247–264, 2002.
[2] W. J. Fisk, “Health and productivity gains from better indoor environments and their relationship with building energy efficiency,”
Annual Review of Energy and the Environment,vol. 25, no. 1, pp. 537-566, 2000.
[3] D. Tulipa, S. Gunawan, and V. H. Supit, “The influence of store atmosphere on emotional responses and re-purchase intention,”
Business Management and Strategy, vol. 5, no. 2, pp. 151-164, 2014. [4] P. Kotler, “Atmospherics as a marketing tool,” Journal of Retailing, vol.
49, no. 4, pp. 48–64, 1973.
[5] R. S. Woodworth, “Dynamic psychology,” in Psychologies of 1925, C. Murchison, Ed. Worcester, MA: Clark University Press, 1928. [6] J. Varjo, V. Hongisto, A. Haapakangas, H. Maula, H. Koskela, and J.
Hyönä, “Simultaneous effects of irrelevant speech, temperature and ventilation rate on performance and satisfaction in open-plan offices,”
Journal of Environmental Psychology, vol. 44, pp. 16–33, 2015. [7] The Minister of Manpower and Transmigration Republic of Indonesia
No. PER.13 / MEN / X, 2011.
[8] R. S. Bridger, Introduction to Ergonomics, 3rd ed. Boca Raton, U.S.: CRC Press, 2008.
[9] A. R. Musa, N. A. G. Abdullah, A. I. Che-Ani, N. M. Tawil, and M. M. Tahir, “Indoor environmental quality for UKM architecture studio: An analysis on lighting performance,” Procedia - Social and Behavioral Sciences, vol. 60, pp. 318–324, 2012.
[10] M. S. Sanders and E. J. McCormick, Human Factors in Engineering and Design, Singapore: McGraw-Hill, 1993.
[11] S. N. Kamaruzzaman and E. M. A. Zawawi, “Influence of employees’ perceptions of colour preferences on productivity in Malaysian office buildings,” Journal of Sustainable Development, vol. 3, no. 3, pp. 283–293, 2010.
AmaliaSuzianti holds a Ph.D in innovation system design from Technische Universitaet Berlin, Germany and University of Luxembourg (2010), the master of science in technology and innovation management from Brandenburgische Technische Universitaet Cottbus, Germany (2004), and a bachelor of engineering in industrial engineering from Universitas Indonesia (2000). One of her remarkable achievements is that she has been awarded with a Postgraduate Scholarship for Professionals by German Academic Exchange Services (DAAD) in 2002 and graduated with outstanding results.
Prior joining Universitas Indonesia in late 2010, she has acquired international academic and professional work experiences, mainly in Europe, Asia and Latin America. She has involved in various multinational projects in different industries such as automotive (Daimler Benz, Germany), consumer goods (Givaudan SA Europe, Unilever Europe), IT (Siemens Europe and Singapore) and energy (Total Germany). Her research interests lie in the fields of New Product and Service Development, Technology and Innovation Management, Technology Policy and Sustainable Innovation. She is also a member of Product Development and Management Association (PDMA) and Design Society (DS).
Jessica Suradi is a master graduate of the Department of Industrial
Engineering, Universitas Indonesia.
Hutami Nadya was a research associate in the Product Development and
Innovation Laboratory, Department of Industrial Engineering, Universitas Indonesia. She is also a graduate of Department of Industrial Engineering, Universitas Indonesia.
Felisa Fitriani is a research associate in the Product Development and Innovation Laboratory, Department of Industrial Engineering, Universitas Indonesia. She is currently pursuing her bachelor degree in the Department of Industrial Engineering, Universitas Indonesia.
Mhd Faiq Pradila is a research associate in the Product Development and
Innovation Laboratory, Department of Industrial Engineering, Universitas Indonesia. He is currently pursuing her bachelor degree in the Department of Industrial Engineering, Universitas Indonesia.
Nabila Priscandy Poetri was a research associate in the Product