Available at http://www.ijcsonline.com/
Measuring Sensitivity Secure Login Information Systems by using SPSS Software
(An application on Neelain university – SUDAN )
Dr. Mozamel M. Saeed
Associate professor, Department of Computer Science, Collage of Science Prince Sattam Bin Abdul-Aziz University, KSA
Abstract
Research conducted to measure the sensitivity of secure login information (username / password) in the field of electronic systems through three different electronic systems in nature (electronic tests, electronic banking accounts and personal sites for social networking),by using SPSS program. Application on the community of (Neelain university – SUDAN). Targeting a random sample of (80) respondents from the university (Students and teaching staff members – males and females). Research concluded that the three systems (electronic tests, electronic banking accounts and personal sites for social networking), differ statistically and significantly in the extent of their need to secure access to data entry (username / password). It concluded that the electronic banking system is more sensitive compared to the other systems. Followed by the electronic testing systems then the social networking systems. Research applied (T) Test and examined that there is a general interest in securing the login information (username / password) in the field of electronic systems.
Keywords: Sensitivity of information, Electronic systems, Information access, Neelain university, SPSS..
I. INTRODUCTION
The electronic communities were found since the emergence of the internet. They provided means for communication and exchange of information on specific topics of common interest to all people from all over the world, enabling numerous opportunities to share information between all network subscribers with possibilities of interactivity. There is disagreement with regard to the meaning of privacy and personal life as a result of this communication, where information is shared with others, even without request. Therefore there is a need of security protection for this information.
The process of protecting information systems depend primarily on its sensitivity. It is important that there should be a clear classification of the importance of information. Where, for example, it can be classified into five levels, ( normal , prohibited , secret , highly confidential and personal). It can also be more or less than these levels, depending on the nature of the information. The main objective of this classification is to provide the overall information protection, using different means according to its importance and sensitivity to preserve privacy. It is necessary to protect these species of information at all costs, and should be handled with caution and discretion, with particular emphasis on the protection of personal information through passwords and user name or any of the various methods and encryption tools.
This paper, will measure the sensitivity of the secure login information (username / password) through three different electronic systems in nature including the online tests, online banking accounts and social networks to determine the extent of awareness of the importance of ensuring access to such systems for users of our society.
II. HYPOTHESES
The researcher works through this paper to establish the basic premise and several secondary premises as follows: A. The major hypothesis
The three systems (Bank accounts, tests, and social networks) differ statistically and significantly in the extent of their need to secure access to data entry (username / password).
B. The subsidiary hypotheses
Males are more interested in the question of secure data entry, for others to enter their personal accounts. Faculty members are more interested than students to
the question of secure data entry, for others to enter their personal accounts.
There is a direct correlation between a person's educational level and the degree of interest in securing its data entry, for others to enter their personal accounts.
There is a direct correlation between the age of the person and the degree of interest in securing its data entry, for others to enter personal accounts.
III. METHODOLOGY & TOOLS
(Half are students and half are faculty members). The aim was to measure the sensitivity of secure login information in electronic systems.
IV. DATA ANALYSIS AND DISCUSSION
The multiplicity of the hypotheses of the study need multiple statistical tools, using (F) test to test the equality of several medians (the basic premise and the two subsidiary hypotheses 1 and 2 ), linear correlation coefficient (Pearson correlation) to test the link between relationship variables ( the two subsidiary hypotheses 3 and 4). And (T) test to test the difference between the arithmetic for independent suburban samples (the major hypothesis and the two subsidiary hypotheses 1 and 2).
Each hypothesis of the study will be addressed separately by following it on each axis and then collect all the paragraphs on each axis of the different resolution then comment on all relevant axes regarding the hypothesis and then public commenting on the hypothesis considering all the given parts together as follows:
The three systems (Bank accounts, tests, and social networks) differ statistically and significantly in the extent of their need to secure access to data entry (username / password).
The wording of this hypothesis is: H0 : µ1 = µ2 = µ3
H1 : µ1 ≠ µ2 ≠ µ3 Or
H1 : µ3 ˃µ1 ˃ µ2 Where
µ1 ≡ arithmetic for system testing
µ2 ≡ arithmetic mean for social networking system µ3 ≡ arithmetic system for bank accounts
(SPSS) program has given the table of variance analysis as follows:
Table No (1-A): ANOVA (Contrast table for averages of three systems)
Sum of Squares df
Mean
Square F Sig. Between
Groups 702.658 2 351.329 38.663 .000 Within
Groups 2153.638 237 9.087
Total 2856.296 239
From the above table No (1-A): We can note that the value of moral level (Sig) in the last column, is equaling ,000 . It is less than the value .50 that is representing the allowed error in the study. It means the refusal of the null hypothesis which states that there is no statistical and significant difference between the three electronic systems in the extent of their need to secure access to data entry (username / password). It is an indication to support with confidence amounting to 95% accepting the first part of the major hypothesis of the study. Which states that the three systems differ statistically and significantly in term of access to secure entry data.
For testing the second part of the hypothesis, it is necessary to use test (T), which has given the following tables:
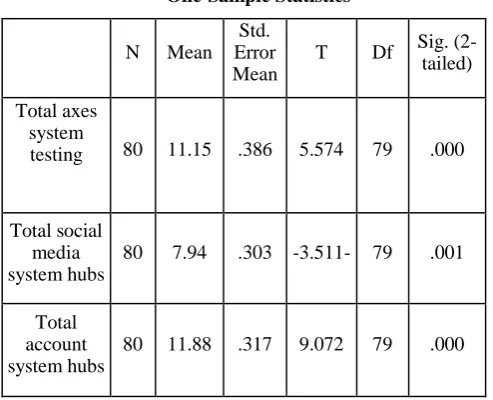
Table No (1-B): (T) Test (computational median for three systems)
One-Sample Statistics
N Mean Std. Error Mean
T Df Sig. (2-tailed) Total axes
system
testing 80 11.15 .386 5.574 79 .000
Total social media system hubs
80 7.94 .303 -3.511- 79 .001
Total account system hubs
80 11.88 .317 9.072 79 .000
It is clear from the above table No (1-B): Through its last column, that all values of moral level are less than the value .50 . All mathematical circles differ semantically from the arithmetic mean value which is equal to the 9 while the arithmetic mean for system testing which is equaling (11.15) and the arithmetic mean of the bank system is equaling (11.88) . They are higher than the mean of the default. The arithmetic of social networking system is equaling (7.94) which is less than the arithmetic mean of the default which means the weak interest of dealers with this secure access.
And from the same table, we note that the order of these systems in terms of the mathematical community values (the provided bank account system is the first one, followed by testing system and then social networking system). This can support with confidence amounting to 95% accepting the second part of the major hypothesis of the study.
Subsidiary hypothesis No (1) which states that: (Males are more interested in the question of secure data entry, for others to enter their personal accounts).
H0 : µ1 = µ2 H1 : µ1 ˃ µ2 Where
µ1 ≡ arithmetic of males µ2 ≡ arithmetic of females
The following table No(3) has been obtained:
Table No (3): (T) Test (the moral differences in mathematical circles for gender)
Gen der N Mea n Std. Error Mean
T Df Sig. (2-tailed) Total
axes system testing
male 40 9.63 .511
-4.387 78 .000 fema
le 40 12.68 .471 Total
social media system hubs
male 40 8.43 .375
1.628 78 .108 fema
le 40
7.45 .467
Total account
system hubs
male 40
10.43 .457
-5.303 78 .000 fema
le 40
13.33 .300
Total axes
male 40
28.47 1.16
-3.183 78 .002 fema
le 40
33.45 1.05
From the above table No (3): It is noted that as for system testing, the arithmetic mean, which equals 12.68 is greater than the arithmetic mean of the males which equals 9.63. The last column shows the difference between the two communities (males & females) in this system, and it is considered as a moral difference by zero value of moral level. And the same analysis applies to the system of bank accounts and total systems. As for the social networking system, the arithmetic mean of males is equaling 8.43 which is greater than the arithmetic mean of females, which is equaling 7.45. But considering the value of moral level return which equals .108 which is greater than the value .05 . It is an indication that no moral difference between the two the arithmetic means of default (males and females) in this system. It is worth mentioning that the arithmetic mean of default for the total systems is the total
sum of the arithmetic means for those systems which is equaling ( 9 + 9 + 9 = 27).
Since the results do not support the hypothesis on two of three systems in total, it is arguably an 95% degree of confidence not supporting the hypothesis number one (1) of the study that males more than females with respect to securing access to these regulations but which is supported by field studies that arithmetic for females and the degree of moral arithmetic of males which females were most interested in the question of secure login even if we found that the arithmetic mean for males is The largest – as is the case in the system of social networking – the difference between the two communities was not statistically difference.
Subsidiary hypothesis No (2): states that (faculty members are more interested than students in terms of securing data).
Statistical formulation of the hypothesis is: H0: µ1: = µ2
H1: µ1 ˃ µ2 Where
µ1 ≡ arithmetic faculty members µ2 ≡ arithmetic for students
The following table has been obtained:
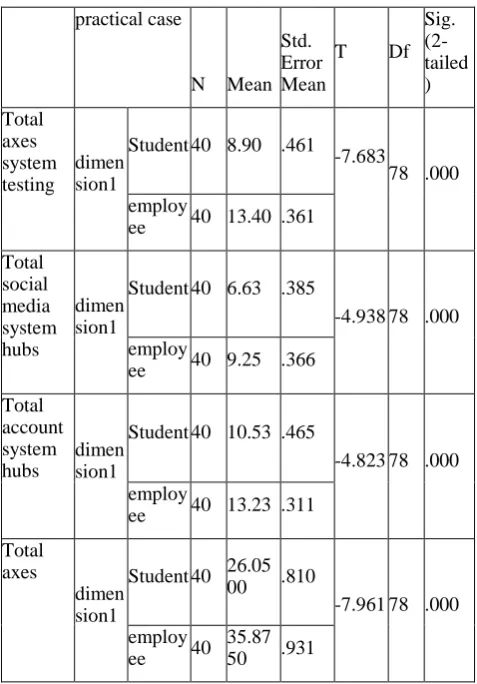
Table No (4): (T) Test (the moral differences in arithmetic means for the practical case)
practical case
N Mean Std. Error Mean
T Df
Sig. (2-tailed ) Total axes system testing dimen sion1
Student 40 8.90 .461
-7.683
78 .000 employ
ee 40 13.40 .361 Total social media system hubs dimen sion1
Student 40 6.63 .385
-4.938 78 .000 employ
ee 40 9.25 .366 Total account system hubs dimen sion1
Student 40 10.53 .465
-4.823 78 .000 employ
ee 40 13.23 .311 Total
axes
dimen sion1
Student 40 26.05 00 .810
-7.961 78 .000 employ
ee 40
Schedule No (4): It is noted that the arithmetic means for faculty members in all three systems and in total is greater than the arithmetic means for students. And the moral levels zero values in the last column in the table, indicates the moral differences between those arithmetic means. Now it can be reported with 95% degree of confidence the acceptance of the hypothesis of the study, which states that the faculty members are more interested than the students in terms of ensuring access to such systems.
Subsidiary hypothesis No (3): states that (there is a direct correlation between a person's educational level and the degree of interest in securing access).
Statistical formulation of the hypothesis is: H0 : R = 0
H1 : R ˃ 0
Where R ≡ linear correlation between level of education and degree of income security for the systems under study. And null hypothesis refers to a lack of correlation between two variables while the alternative hypothesis states that there is a correlation between two variables, but that the relationship is statistically significant relationship whereby any educational level is a direct correlation with the degree of insurance.
The following table has been obtained:
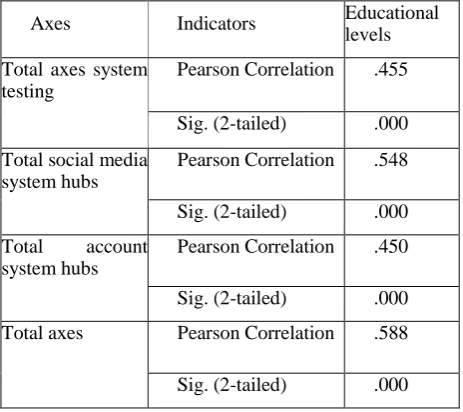
Table No (5): Correlations (Correlation between educational level and each system)
Axes Indicators Educational
levels Total axes system
testing
Pearson Correlation .455 Sig. (2-tailed) .000 Total social media
system hubs
Pearson Correlation .548 Sig. (2-tailed) .000 Total account
system hubs
Pearson Correlation .450 Sig. (2-tailed) .000 Total axes Pearson Correlation .588 Sig. (2-tailed) .000
Schedule No (5): It is noted that all the values corresponding to the correlation coefficients (Pearson Correlation) which are listed in the middle column, are all positive(they are greater than zero). It indicates that there is an existence of a positive correlation between the two variables. It is also noted that, the given values which are listed in the third column and corresponding the moral standards (Sig. (2-tailed)) in the middle column are all zero (which is smaller than the value .05 Which indicates the moral relationship for all systems and total systems axes). Thus we can confidently report with 95% the acceptance of
the third hypothesis of the study. Which states that there is a link between a person's educational level and the degree of interest in securing data access to accounts on all systems under study.
Subsidiary hypothesis No (4): states that (there is a direct correlation between the age of the person and the degree of interest in securing data).
Statistical formulation of the hypothesis is: H0 : R = 0
H1 : R ˃ 0 The following table has been obtained:
Table No (6): Correlations (correlation between age and each system)
Axes Indicators Age
Total axes system testing
Pearson Correlation .596 Sig. (2-tailed) .000 Total social media
system hubs
Pearson Correlation .556 Sig. (2-tailed) .000 Total account system
hubs
Pearson Correlation .463 Sig. (2-tailed) .000 Total axes Pearson Correlation .660 Sig. (2-tailed) .000 Schedule No (6): It is noted that all the values corresponding to the correlation coefficients (Pearson Correlation) that are listed in the middle column, are all positive (greater than zero). It indicates that there is an existence of a positive correlation between the two variables. It is also noted that, the given values that are listed in the third column and corresponding the moral standards (Sig. (2-tailed)) in the middle column, are all zero (Smaller than the value .05), it indicates the moral relationship for all systems and total systems axes. Thus we can confidently report with 95% the acceptance of the fourth hypothesis of the study. Which states that there is a link between the person and the degree of interest in securing data access to accounts on all systems under study.
V. RESULTS
Through the study, the following results were achieved: The three electronic systems vary in the extent of their
need to secure access to data entry (username and password). And the sensitivity of the electronic banking accounts systems is with greater range, followed by the electronic tests, then social systems. The degree of importance and sensitivity of the secure
login systems in females is higher than in males. Faculty members are more interested than students in
securing information access systems.
person the higher becomes his/ or her interest in securing login information).
The age of a person is an indicator of the extent of his interest in securing login information. (Whenever the age of a person increases, the extent of his interest in securing information also increases).
VI. CONCLUSION
In the light of the finding of the study, Research concluded that the SPSS program is an effective tool in measuring the sensitivity of securing login information access systems. The results showed that the three systems (Bank accounts, tests, and social networks) differ statistically and significantly in the extent of their need to secure access to data entry (username / password). It concluded that the electronic banking system is more sensitive compared to the other systems.( The electronic testing followed by the social networking systems). Research finally concluded that necessary attention is required to raising awareness of the importance and secrecy of the secure login information for all users of these systems, and especially e-banking accounts systems to preserve privacy and protects property.
REFERENCES
[1] C. Bennet and C. Raab, The Governance of privacy: policy Instruments in global perspective, 2nd edition-2006.
[2] C. Calvert, Voyeur Nation: Media, privacy, and peering in modern culture, New York, 2004.
[3] D.J. Solove, Understanding Privacy, 3rd edition, 2010.
[4] D. J. Solove, The future of Reputation: Gossip, Rumor, and privacy on the internet, New Haven, 2007
[5] G. lauri, Genetic privacy: A challenge to medico- legal Norms, Cam- bridge- Cambridge University press, 2002.
[6] H. Jenkins, Convergence culture: where old and new media collide, New York, 2008.
[7] H. Tornlinson, privacy and the media: the developing law, London, 2002.
[8] Institute for the study of privacy Issues(ISPI) http://www.privacy News .com
[9] J. Alan Fox, Randomized Response and Related Methods: Surveying Sensitive Data (Quantitative Applications in the Social Sciences), 2015.