Contents lists available at ScienceDirect
Finance Research Letters
journal homepage: www.elsevier.com/locate/frlCre
dit-implie
d forward volatility and volatility
expectations
Hans Byström
∗DepartmentofEconomics,LundUniversity,Box7082,22007Lund,Sweden
a
r
t
i
c
l
e
i
n
f
o
Articlehistory:
Received16September2015 Accepted26October2015 Availableonline31October2015 JELclassification: G1 G10 G17 G53 Keywords: CDS
Impliedvolatilitytermstructure Forwardvolatility
Forwardstartoptions
a
b
s
t
r
a
c
t
Weshowhowonecanbackoutimpliedforwardvolatilityterm struc-turesfromcreditdefaultswapspreads.Suchforwardstockvolatility termstructuresareusefulforinstanceinforwardstartoptionpricing. Wefindthetermstructuretobedownward-sloping,andthecredit market’svolatilityforecaststendtovarymoreacrosstimethanacross maturities.Long-termvolatilityexpectations,inturn,arefoundtobe lowandstablewhileshort-termexpectationsarehigherandmore volatile.Thevolatilityexpectation’smean-reversionrate,finally, in-dicatesthatthecreditmarketexpectsvolatilityshocksintheequity markettolastforseveralyears.
© 2015TheAuthors.PublishedbyElsevierInc. ThisisanopenaccessarticleundertheCCBY-NC-NDlicense (http://creativecommons.org/licenses/by-nc-nd/4.0/).
1. Introduction
WefollowByström(2013)andbackoutimpliedstockvolatilitiesfromcreditdefaultswapspreads. While Byström(2013)backsout ordinaryimplied volatilities,weinstead focusonso-calledforward volatilities,i.e.volatilitiesfortime-periodsthatstartinthefuture.Suchvolatilitiesareneededwhen pricingexoticderivativessuchasforwardstartoptions,cliquetsorforwardstarting“goldenhandcuff” employeestockoptions(Alford&Boatsman,1995;Glasserman&Wu,2011).Wethenproceedto estimat-ingvolatilityexpectations,forthefirsttime(webelieve)explicitlyestimatingthecreditmarket’s short-andlong-termequityvolatilityexpectations.
∗ Correspondingauthor.Tel:+462229478;fax:+462224118. E-mailaddress:hans.bystrom@nek.lu.se
http://dx.doi.org/10.1016/j.frl.2015.10.027
1544-6123/© 2015TheAuthors.PublishedbyElsevierInc.ThisisanopenaccessarticleundertheCCBY-NC-NDlicense (http://creativecommons.org/licenses/by-nc-nd/4.0/).
Inadditiontorepresentingthecreditmarket,ratherthantheequitymarket,thecreditdefaultswap (CDS)markethascertainfeaturesthatmakeitparticularlyusefulforthepurposeofforecastingforward volatilities.First,thematuritiesofcreditdefaultswapsaremuchlongerthanthoseofordinaryequity options.Thismakesitpossibletoforecaststockvolatilitiesstartingseveralyearsintothefuture.Second, theavailabilityofconstant-maturityCDScontractswitharangeofmaturities,n=1,2,3,… ,10years makeitpossibletobackoutforwardvolatilitiesforanycalendaryear1to10yearsintothefuture.This featuresetsthisstudy/marketapartfrompreviousstudies/marketsrelyingonbothfewerand/orchanging maturities.Third,theCDSmarkethasbecomeamaturemarketcoveringmanyregions,countriesand firms(Byström,2015).ThismakestheCDSmarketapromisingnewcandidateforanyonewhowantsto estimateimpliedforwardstockvolatilities.
Thereareseveralstudiesthatlookatthetermstructureofimpliedvolatilities.1 Inthispaperwebuild, firstandforemost,onByström(2013)backingoutimpliedstockvolatilitiesusingcreditdefaultswaps.We thenusethesevolatilitiestocalculateforwardvolatilitiesandshort-andlong-termvolatilityexpectations (inthecreditmarket)forthestocksintheDowJonesIndustrialAverage(DJIA)index.
2. Impliedvolatility
Impliedstockvolatilitiesaretypicallyinferredfromequityoptions.AsdescribedbyByström(2013, 2015),however,impliedstockvolatilitiescanalsobeinferredfromcreditdefaultswapsusingCDS pric-ingmodelssuchastheindustrybenchmarkCreditGradesmodel(CreditGrades,2002).InCreditGrades,a firmdefaultswhenitsassetvalue,Vt,fallsbelowitsstochasticdefaultthresholdLtD.Disthefirm’sdebt levelandLtistheglobalrecoveryrateonthefirm’sliabilities.TheCreditGradesCDSspreadforacertain maturity,T,isthen
spreadCDST =r
(
1−R)
1−P
(
0)
+erξ(
G(
T+ξ)
−G(ξ))
P
(
0)
−P(
T)
e−rT−erξ(
G(
T+ξ)
−G(ξ))
(1) wherethesurvivalprobabilityP(t)isP
(
t)
=N −At 2 + ln(
d)
At −dN −At 2 − ln(
d)
At and d= V0 LmeanD eλ2, At2=σ
2t+λ
2, G(
t)
=dz+1 2N −ln(
d)
σ
√t −zσ
√ t +d−z+1 2N −ln(
d)
σ
√t +zσ
√ t ,ξ
=λ
2σ
2, z= 1 4+ 2rσ
2.σ
istheassetvolatilityandσ
=(σ
EEt)/(Et+LmeanD)whereEtistheequityvalueandσ
Eisthestock volatility(thatwebackout).ristherisk-freeinterestrate,RistheCDS-specificrecoveryrateandLmean andλ
isthemeanandstandarddeviationoftheglobalrecoveryrate,Lt.WesetLmean=Randfollowthe recommendationsinCreditGrades(2002)choosingR=0.5andλ
=0.3.1Stein(1989)looksatthemean-revertingpropertiesofimpliedvolatility.XuandTaylor(1994)estimatesforwardvolatilities
andestimatesshort-andlong-termvolatilityexpectations.Heynenetal.(1994)testsrestrictionsontheimpliedvolatilityterm structureandCampaandChang(1995)teststheexpectationshypothesisintheimpliedvolatilitytermstructure.Mixon(2007)also testswhetherthetermstructureofimpliedvolatilitiesisconsistentwiththeexpectationshypothesisandEgelkrautetal.(2005) studiesforwardvolatilitiesandvolatilityprediction.
3. Impliedforwardvolatility
VolatilitiesimpliedbyoptionpricesorCDSspreadsareexpectationsofvolatilitiesovertime-periods startingtoday.Forcertainpurposes,such aspricingforwardstart optionsoremployee optionswith “goldenhandcuffs”,therequiredvolatilitiesareexpectedvolatilitiesacrosstime-periodsstartinginthe future.Thesevolatilitiesareknownasforwardvolatilitiesand,inoursetup,impliedforwardvolatilities (variances)fT,tforeachfutureyearT,2≤T≤10,canbecomputedattimetfromimpliedvolatilitiesyT,t (yT,t=
σ
E)withmaturitiesT,1≤T≤10,as:fT,t=Ty2T,t−
(
T−1)
y2T−1,t. (2) 4. AvolatilitytermstructuremodelInourvolatilitytermstructuremodel,whichissimilartothemodelbyXuandTaylor(1994),CDS mar-ketparticipantsformvolatilityexpectationsthatarefunctionsofthreeparameters;theshort-term ex-pectation
α
,thelong-termexpectationμ
andtherateofmeanreversion,φ
,whichdeterminesthespeed withwhichthevolatilityexpectationrevertstowardsμ
.XuandTaylor(1994)showsthattheexpected forwardvariancegT,tisalinearcombinationofα
2andμ
2:gT,t=
μ
2t +xT,tα
2 t −μ
2t (3) with xT,t=φ
T−1−φ
T 1−φ
, (4)assuming
φ
<1.ByminimizingthedifferencebetweenfT,tandgT,t,followingthethree-step regression-basedestimationproceduredescribedbyXuandTaylor(1994),wegetdailyα
t,μ
t andφ
ˆt estimates. ComparedtoXuandTaylor(1994)wehavetheadvantageof(i)havingconstantmaturitiesacrossthe sample,(ii)havingmaturitiesthatarecountedinyearsand(iii)eachdayhavingthesamenumberof maturities(10).5. Data
OurdatasetcontainsCDSspreads,stockpricesandleverageratiosforthefirmsintheDJIAindexfrom January1,2006toSeptember30,2010.2 ,3 TheCDSdataisavailableforconstantmaturitiesofnyearswith n=1,2,3,… ,10,andallCDScontractsareseniorUSDcontracts.Thestockpricesarealsodenominated inUSD,andasaproxyfortherisk-freeinterestrateweusetheaverageUS3monthTreasurybillrate.4 6. Results
Descriptivestatisticsonforecastedone-yeartonine-yearaheadforwardvolatilitiesispresentedin
Table1(year2startsoneyearfromnowandyear10startsnineyearsfromnowetc.).5 ,6 Thenear-term
volatilityforecastsareobviouslyhigherthanthedistant-termforecasts.Thenear-termforecastsarealso morevolatile.7 InFig.1weshowtheforwardvolatilitiesfortheaveragefirminthesampleanditisclear
2Onlynon-financialfirmsareincludedinthestudyandsincesomefirmslackavailabledataoursampleisreducedto22firms. 3Thestartdateisdictatedbydataavailability;before2006wedonotfindCDSdataforallthe(10)maturities.Theenddate,
inturn,isdictatedbytheneedforareasonablylongout-of-sampleperiodfortheforwardvolatilityforecasts(thecalendaryears 2011–2014).
4Leverageratiosaredownloadedfromtheweb-pageofA.DamodaranandtherestofthedataisdownloadedfromDatastream. 5Whileweonlyestimateone-yearforwardvolatilities,ourmethodanddataallowfortheestimationofn-year(n=2,3,…)
volatilitiesaswell.
6WeproxytheJanuary1,2011forecastwiththeSeptember30,2010forecast.
7Itshouldbenoted,though,thatalthoughthenineforwardvolatilityforecastsaremadesimultaneouslytheyareforecastsfor
differenttime-periods.Forexample,theone-yearaheadforecastsareforthecalendaryears2007to2012andthenine-yearahead forecastsareforthecalendaryears2015to2020.
Table1
Descriptivestatisticsforannualizedone-yeartonine-yearaheadcredit-implied forwardvolatilitiesaveragedacrossthe22non-financialDJIAfirmsforthe time-periodJanuary1,2006toSeptember30,2010.
Mean(%) Stdev(%) Skewness Kurtosis
Year2 41.4 5.7 –0.10 –1.22 Year3 38.8 4.6 0.41 –0.40 Year4 39.3 4.2 0.14 –1.13 Year5 38.0 3.7 0.54 –0.21 Year6 35.4 3.1 0.74 0.88 Year7 34.2 3.1 0.89 1.36 Year8 34.0 3.3 0.71 0.42 Year9 33.5 3.3 0.72 0.50 Year10 33.1 3.3 0.73 0.55
Fig.1. One-yeartonine-yearaheadcredit-impliedforwardvolatilitiesaveragedacrossthe22non-financialDJIAfirmsforthe time-periodJanuary1,2006toSeptember30,2010.
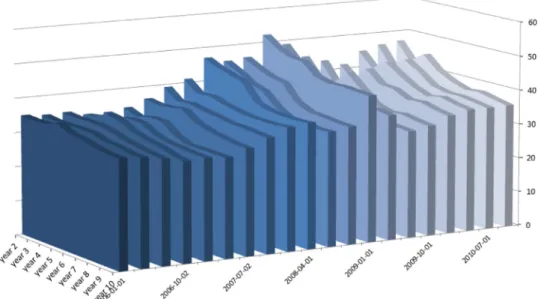
that,regardlessofhorizon,theforecastedvolatilityincreasesduringthecrisis.Fig.2showsa3D-plotof theforwardvolatilitytermstructuresampledonaquarterlybasisanditisclearnotonlythattheterm structureisdownward-slopingbutalsothatbothitslevelandslopevaryovertime.
Thefinancialcrisismakesitdifficulttoevaluatetheaccuracyofvolatilityforecastsandinthispaperwe thereforechooseadifferentpath.InFigs.3–4wepresentsnapshotsfromthesetofforecastsinFig.1.We limittheforecaststothoseforwardvolatilityforecaststhataredonethefirsttradingdayeachcalendar yearfrom2006to2011.Theresultingforwardvolatilityforecastsforthecalendaryears2007to2014are plottedbothinFig.3,withthedependentvariablebeingtheyear,
τ
,fortheforecast,andinFig.4,with thedependentvariableinsteadbeingtheyear,t,whentheforecastismade.Inanidealworld,wherethemarketalwayspredictsfuturevolatilitiescorrectly,thesevencurvesin
Fig.3shouldoverlap.Inreality,theforecastsdifferfromeachother,however;thecreditmarket over-estimatedtheforwardvolatilityfortheyearsafterthecrisisandunder-estimateditforthecrisisyears. ThecurvesinFig.4,inturn,shouldbehorizontalifthemarkethadperfectforesight.Instead,theactual
Fig.2. The(average)credit-impliedforwardvolatilitytermstructuresampledonaquarterlybasisoverthetime-periodJanuary1, 2006toSeptember30,2010.
Fig.3. Credit-impliedforwardvolatilityforecastsmadethefirsttradingdayinJanuaryeachyearfrom2006to2011.Thevariable onthex-axisistheyear,τ,fortheforecast(thecalendaryears2007to2014).
forecastsdemonstrateanupward-slopingpatternwheretheforecastoftheforwardvolatilityincreases overtimeregardlessoftheyear,
τ
,fortheforecast.Ingeneral,theforecastvariationissmalleramongthe variousτ
thanamongthevarioust;i.e.thecreditmarket’sequityvolatilityforecaststendtovarymore acrosstimethanacrossmaturities.Fig.4. Credit-impliedforwardvolatilityforecastsforthecalendaryears2007to2014.Thevariableonthex-axisistheyear,t,when theforecastismade(thefirsttradingdayinJanuaryeachyearfrom2006to2011).
Fig.5. Short-andlong-termvolatilityexpectations(αandμ)averagedacrossthe22non-financialDJIAfirmsforthetime-period January1,2006toSeptember30,2010.
Themodel-impliedshort-andlong-termvolatilityexpectations
α
andμ
arepresentedinFig.5(mean valuestogetherwith25%-and75%-percentiles).Thecreditmarket’slong-termexpectationsarequite stablearound30%whiletheshort-termexpectationsfluctuatebetween40and75%.Theaveragevolatility expectationmean-reversionrateφ
isfoundtobe0.9andvariesbetweenaround0.8in2006and0.95in 2010;i.e.,a“half-life” of3–13yearswithanaverageof7years(0.97≈0.5).4. Conclusion
Inthispaperweshowhowonecanbackout impliedforwardstockvolatilitiesfromCDSspreads andthenusethesevolatilitiestoestimateshort-andlong-termvolatilityexpectations.Wefindthe for-wardvolatilitytermstructuretobedownward-sloping,andthecreditmarket’svolatilityforecaststend tovarymoreacrosstimethanacrossmaturities.Thecreditmarket’slong-termvolatilityexpectationfor thestocksintheDJIAindexisaround30%whiletheshort-termexpectationfluctuatesbetween40and 75%.Meanwhile,theaveragemean-reversionrateinthevolatilityexpectationcorrespondstoa“half-life” ofaround7years.I.e.,volatilityshocksintheequitymarketareexpectedtolastforlong.Webelievethis tobethefirstattemptatestimatingthecreditmarket’sshort-andlong-termexpectationsaboutfuture stockvolatility.
Acknowledgment
Financial assistancefromTheMarianneandMarcusWallenberg Foundation[MMW2012.0019]is gratefullyacknowledged.
References
Alford,A.W.,Boatsman,J.R.,1995.Predictinglong-termstockreturnvolatility:implicationsforaccountingandvaluationofequity derivatives.TheAccount.Rev.70(4),599–618.
Byström,H.,2013.Stockpricesandstockreturnvolatilitiesimpliedbythecreditmarket.WorkingPaper2013,25LundUniversity. Byström,H.,2015.Credit-impliedequityvolatility– long-termforecastsandalternativefeargauges.J.FuturesMarkets35,753–775. Campa,J.M.,Chang,P.H.K.,1995.Testingtheexpectationshypothesisonthetermstructureofvolatilitiesinforeignexchangeoptions.
J.Finan.50,529–547.
CreditGrades,2002.CreditGrades.TechnicalDocument.RiskMetricsGroup.
Egelkraut,T.M.,Garcia,P.,Sherrick,B.J.,2005.Thetermstructureofimpliedforwardvolatility:recoveryandinformationalcontent inthecornoptionsmarket.AmericanJ.Agric.Econ.89,1–11.
Glasserman,P.,Wu,Q.,2011.Forwardandfutureimpliedvolatility.Int.J.Theor.Appl.Finan.14,407–432.
Heynen,R.,Kemna,A.,Vorst,T.,1994.Analysisofthetermstructureofimpliedvolatilities.J.Finan.Quant.Anal.29,31–56. Mixon,S.,2007.Theimpliedvolatilitytermstructureofstockindexoptions.J.Empir.Finan.14,333–354.
Stein,J.,1989.Overreactionintheoptionsmarket.J.Finan.44,1011–1023.