September 10-12, 2014
SCALING BUILDING ENERGY MODELING HORIZONTALLY
IN THE CLOUD WITH OPENSTUDIO
Nicholas L. Long
1, Brian L. Ball
1, Katherine A. Fleming
1, and Daniel L. Macumber
1 1National Renewable Energy Laboratory, Golden, CO
ABSTRACT
Although building energy modeling has been common for many years, large-scale analyses have more recently become achievable for more users with access to affordable and vast computing power in the cloud. Recently, the OpenStudio Parametric Analysis Tool was enhanced, allowing users to launch their own cloud resources to run a large number of simulations. This paper discusses the process used to dynamically provision the machine images used in the cloud repeatedly and consistently, to launch and configure instances of these images, and finally to run analyses using the clustered instances running in the cloud. Several open source libraries for performing these tasks were used and extended as needed to support building energy modeling needs. This paper also describes various use cases of the OpenStudio Cloud implementation and outlines future use cases that are possible once a large clustered environment is available.
INTRODUCTION
In September 2013, OpenStudio (NREL 2014a) released a version of its Parametric Analysis Tool (PAT), which enabled users to run a building energy modeling (BEM) analysis on the cloud using their own accounts (Macumber 2014). Two primary challenges were addressed to enable this new functionality: (1) designing a system architecture that would scale over a range of cloud resources; and (2) providing access to BEM software such as OpenStudio and EnergyPlus (Crawley et al. 2005) on cloud resources.
The following sections describe the system architecture—including the reasons for choosing various technologies, the analysis engine, the provisioning system, and the development/deployment methodology. In addition, a simple analysis leveraging the architecture stack to show the capabilities and advantages of a distributed analysis framework is described.
SYSTEM ARCHITECTURE
Early in the design of this project, it was decided that users of OpenStudio would be required to provision, run, and manage their own instances of the servers in the cloud. This allowed users to pay for their own computation time and required the OpenStudio team to architect a solution that could be easily (and continuously) updated and easily deployed. Based on the various requirements, it was decided to initially implement the solution with Amazon Web Services (AWS). The technologies chosen in the architecture will allow this project to be deployed in other hosting environments, as described in more detail later.
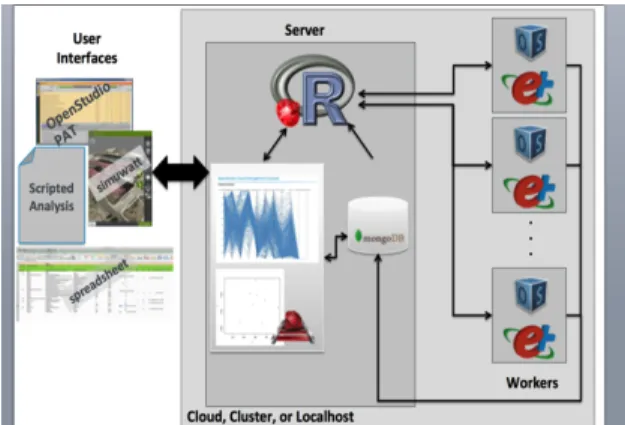
The system architecture consists of two pieces, the server and the worker. The server acts as the system providing communication between the user and the worker nodes. The server contains a much larger software stack because of both its role and its physical system resource requirements. The worker nodes are designed to take instructions from the server, generate the data point to run, run the data point, and then return the results to the server.
The system architecture is composed entirely of open source software and shown in Figure 1.
Figure 1 System Architecture Diagram
Each server and worker node is an individual Ubuntu 12.04 LTS Server operating system. Both the server and the worker use several frameworks to meet
requirements for a variety of applications. These frameworks include:
• Java 1.7
• Ruby (via rbenv)
• Python
The server node contains additional libraries and applications that provide specific functionality, including:
• Ruby on Rails: web application framework.
The “Web Application” section will be discussed this in more detail in the “Web Application” section.
• Apache HTTP Server: web server.
• Passenger: Rails web application server.
• R: See “Simulation Executive”.
• MongoDB-Server: Database to store analyses
and results.
The worker nodes contain libraries and applications specific to running the simulations, including:
• OpenStudio: Measure application and model
articulation.
• EnergyPlus: Whole Building Model
Simulation Engine.
• Radiance: Lighting/Daylighting Simulation
Engine.
• R: connection to “Simulation Executive”.
• MongoDB-Client: connection to
MongoDB-Server.
SYSTEM PROVISIONING
The Chef configuration management tool (http://opscode.com) was chosen to provision the server and worker machine images with all their required software in an easy and idempotent manner. These properties are important because OpenStudio builds are released every two weeks, and many more images are created in the meantime for testing and development. Chef is an open source, cross-platform, Ruby-based software package that abstracts out the software installation process into scripts representing cookbooks and recipes. Users can use already defined cookbooks or create their own cookbooks and provide them to the community. For this project, 45 cookbooks are used to install all software needed for the server and worker nodes. These cookbooks can be as simple as installing the “logrotate” utility, or more complicated such as installing Apache Web Server and Passenger. Chef handles dependency tracking and compiles the cookbooks before execution to ensure that all required cookbooks—and that the specified cookbook versions—are available and that all packages are installed in the correct order. The actual workflow of
Chef is very flexible and commonly used in more complex system configurations (Opscode 2014). The 45 cookbooks used for the OpenStudio server and worker nodes are hosted on Github at
https://github.com/NREL-cookbooks. There are two
competing philosophies on managing Chef cookbooks. The first is that a developer should never modify a community-provided cookbook directly; instead, the cookbook should be wrapped or monkey patched (using Chef-rewind) to extend its functionality. The second is to fork the cookbook and extend its functionality directly, as needed. The latter method was decided as the workflow, mostly because “newer” community-provided cookbooks have not been stress tested to handle various use cases. Moreover, the use case of running a large number of simulations using custom software dependencies, as considered in this paper, is not a common use case for Chef, whose focus has been on web application and database development.
During the development of this project, several new cookbooks were developed before the Chef community
had provided them. EnergyPlus
(https://github.com/NREL-cookbooks/energyplus) and OpenStudio (https://github.com/NREL-cookbooks/ openstudio) cookbooks were created to handle the installation of EnergyPlus and OpenStudio on Ubuntu, Red Hat Enterprise Linux, and CentOS based systems. Community cookbooks, when available, were chosen over those developed in-house, and extended according to the philosophy described above, as needed.
Cookbooks are typically designed to be compatible with multiple flavors of Linux and, less commonly, with Windows and Mac OSX. To install software via scripts, all software must be accessible and passwordless. For this reason, EnergyPlus Linux build passwords were removed. OpenStudio builds and EnergyPlus builds were placed on web servers that allow downloading via wget/curl.
WEB APPLICATION
The web application uses the Ruby on Rails framework with a Representational State Transfer (REST) Application Programming Interface (API). The objective of the web application is to manage analyses, which entails queuing analyses (not simulations), ensuring worker nodes have the data needed to run an analysis, downloading results, and holding the Simulation Executive process.
The website allows users to quickly see the state of the simulations, view basic results, and download data of interest for client-based evaluation. The web application has simple high-level navigation to traverse projects, analyses, measures, variables, and data points
(i.e., simulations). The web application also contains basic visualizations, implemented using D3 (http://d3js.org/), allowing users to navigate the parameter space.
The web server receives instructions via the RESTful API in JavaScript Object Notation (JSON). Some of the more important API resources and their functionality are the following:
• POST /project.json – high-level project data
including name and description.
• POST /{pid}/analysis.json – analysis input
arguments and workflow of analysis to be run.
• POST /{aid}/upload.json – upload of zip file
containing seed model, weather files, and measures. All content in zip file is sent to worker node.
• POST /{aid}/data_point.json – a specific data
point to be run, with variables set to specific values.
• POST /{aid}/data_points/batch_upload.json –
list of specific data points to be run.
• POST /{aid}/action.json – message sent to the
analysis to do an action (e.g., start, stop).
• GET /analysis/{aid}/status.json – list of all
data points and the run status.
• GET /data_point/{did}/download – download
the data point ZIP file with all results from simulation.
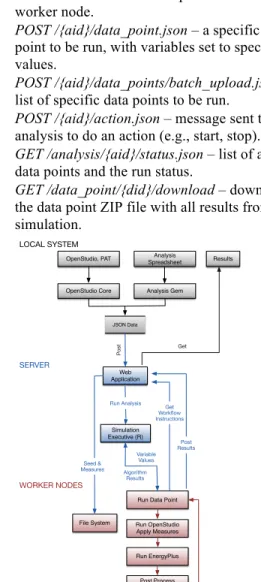
Figure 2 Data Flow for OpenStudio Server
The expected JSON formats will be outlined later in the paper. Figure 2 shows the flow of data for the OpenStudio Server. The analysis JSON file can be
generated from either OpenStudio’s PAT or from a custom spreadsheet (and required Ruby gem). Once the server receives the JSON file and uploaded zip file, it awaits instruction to start via a simple JSON POST to the action endpoint. The received action will start the analysis which consists of first sending the uploaded zip file to the worker nodes, then handing off instruction and algorithm information to the Simulation Executive (R).
Another important characteristic of the web application is its ability to start child processes for each analysis, referred to as watchers. These watchers will asynchronously download results from worker nodes to the server node, allowing users to download the detailed results for each data point simulation from the API or the website. The watchers also have the ability to pull out specific data needed for visualization (e.g., objective function values).
The Ruby on Rails application uses several Ruby gems (http://rubygems.org/) to provide specific functionality. The following list contains the more important gems and their functionality
• Mongoid – Object Document Map for Rails
Models and MongoDB.
• Rserve and Rserve-Simpler – TCP/IP based
connection to R.
• Delayed Jobs – Asynchronous queuing
system. Allows multiple analyses to be queued.
• Child Process – Execute and manage child
tasks.
• D3 – Open source visualization framework.
SIMULATION EXECUTIVE
The Simulation Executive is responsible for bridging the gap between the algorithms being applied to the energy models—such as optimization, calibration, and sampling—and the web server interface to the client computer. R and Rserve were chosen to fill this role because Rserve integrates seamlessly with Ruby (memory wise) and is open sourced and highly crowd sourced. R’s modularity and its various libraries and packages are also advantageous, because they facilitate the making of modules that can be reused by various algorithms.
Several R distributed computing packages were leveraged to create a highly parallelizable platform for running energy models. For any building model analysis, each energy model is independent from the other models being run, creating a large parallel problem to solve (1,000-500,000 simulations). In addition, each energy model typically takes at least several minutes to run; this processing time creates OpenStudio, PAT LOCAL SYSTEM Analysis Spreadsheet SERVER WORKER NODES
OpenStudio Core Analysis Gem
Web Application
Simulation Executive (R)
Run Data Point
File System Variable Values Seed & Measures Get Workflow Instructions Post Results Run Analysis Post Results Get Algorithm Results JSON Data Run OpenStudio Apply Measures Run EnergyPlus Post Process Results
bottlenecks in large-scale analyses. To facilitate the parallel running of energy models, a socket-based cluster is created through the use of the R snow package.
Multi-objective optimization algorithms such as the Non-dominated Sorting Genetic Algorithm 2 (NSGA2) and the Strength Pareto Evolutionary Algorithm 2 (SPEA2) as well as other standard single objective optimization algorithms, widely available through external R packages, have been integrated into the server.
R’s visualization capability and ability to easily incorporate those visualizations into the web framework were also driving factors in choosing R. The capability to fully visualize the distributed inputs of a parametric problem and troubleshoot any defects found before submitting a large computational problem can save the user time and money.
DEVELOPMENT AND DEPLOYMENT
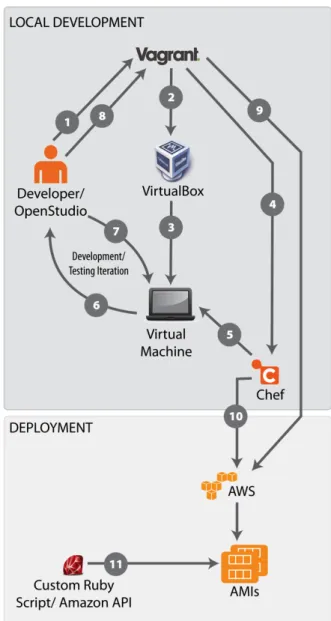
Vagrant (http://www.vagrantup.com) is used to easily and consistently create the server and worker instances with a quick iterative cycle. Vagrant is an open-source, cross-platform, desktop-based software tool that is used to create and configure local development environments using virtual machines (VMs). The advantage of Vagrant is its ability to download a base VM and then use Chef (and other provisioning systems) to repeatably provision the system. This allows multiple developers to have the same VMs running, thereby making development consistent. If a developer requires a new system dependency (for instance, ImageMagick or MySQL), they can simply add the cookbook or create a new cookbook to install the dependency. The other developers can then reprovision their local VMs to install the dependency. Also, the ability to destroy and recreate a system to a pristine state allows developers to test new libraries without worrying about breaking their native systems.Figure 3 shows the development workflow using Chef and Vagrant (Phalip 2012) with customized AWS integration. Vagrant enables developers to work locally using their Integrated Development Environment of choice. The changes are instantaneous on the VMs, because the source code is mounted directly on the VMs and most of the code is not compiled. Also, if a developer needs to debug the server or worker machine, they are able to log into the VM and update the required code or peruse logs. Once the developer has a stable version ready for release, the same development scripts are used to provision the production instances on AWS. A custom Ruby script uses the AWS RUBY API gem (Amazon 2014) to convert the running AWS instances into Amazon Machine Images (AMIs) (Amazon 2014).
Jenkins (http://jenkins-ci.org) is a continuous integration tool that is used to manage the automated development of the AMIs.
Figure 3. Steps of the Development Workflow
EXAMPLE ANALYSIS WORKFLOW
This section describes the workflow of an example analysis, including the APIs and the data flow. First, the analysis cluster is started via OpenStudio’s PAT application or by a custom Ruby gem(http://rubygems.org/gems/openstudio-aws). Currently,
the size of the cluster is defined before the analysis is launched. The ability to add more worker nodes to the cluster is available via a custom R library; however, the functionality has not yet been enabled. In general, the design of OpenStudio server is structured around the
exchange of data files in JSON format. The API methods and data formats are described in more detail below.
Input Data
An example analysis was defined using the OpenStudio Analysis Spreadsheet project (NREL 2014b). A custom Ruby gem is used to translate the spreadsheet configuration to an analysis.json format, which the server understands.
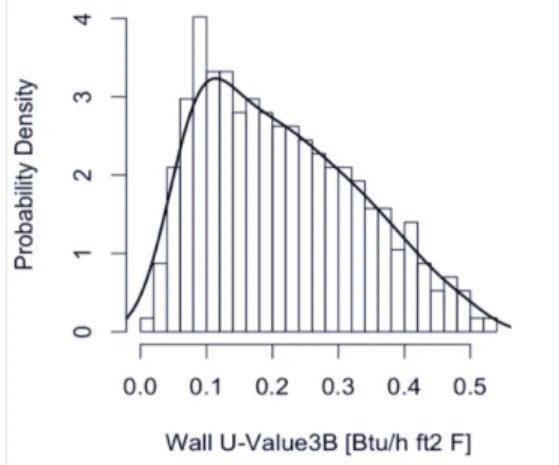
The building in this example was a large office building with 21 input variables ranging from infiltration to plug loads to system efficiencies to envelope performance. The outputs of interest were heating energy and cooling energy. The inputs ranges and distributions for each input variable were entered into the spreadsheet and submitted to the OpenStudio Server. The server converts the input ranges of each variable into samples based on the parameters and the server plots the samples as a histogram via R (see Figure 4). These sample values are used in various algorithms if needed.
Figure 4. Example Input Distribution Analysis Workflow
The configuration of the analysis workflow consists of two parts: the payload and the workflow description. As described earlier, the payload is an uploaded zip file containing the seed model, weather files, and measures. The workflow description is in the parameters and body of the API POST and contains all the data needed to execute the workflow on the model.
The workflow is an ordered list of measures to apply to the seed model. The measures include descriptions on which of the measure arguments are static and which are input variables (see Figure 5). The input variables are handed over to the Simulation Executive to control. In the case of a sampling problem, the Simulation Executive uses the chosen algorithm along with each
variable’s distribution to determine which value to set when running the workflow.
Figure 5. Example Workflow JSON Problem Formulation
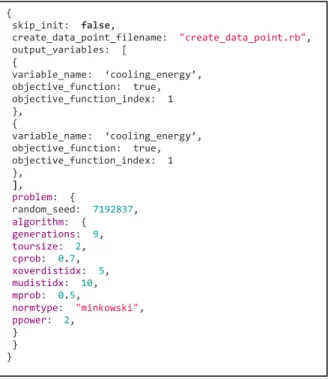
An example of a simple multi-variate multi-objective optimization using R’s NSGA2 algorithm (Deb 2002) was run with the described example building. Figure 6 shows the problem formulation JSON file. This JSON file allows for algorithm arguments to be defaulted and overridden as needed. For example, if the user decides to change the number of generations, they simply update the value in the JSON and submit it to the OpenStudio Server API; conversely, if the user does not specify the number of generations (i.e., removes the line), it is defaulted to the value given by the author of the algorithm. "workflow": [ { "arguments": [ … ] "bcl_measure_directory": "./measures/reduce_lighting_loads_by_percentage", "measure_definition_class_name": "ReduceLightingLoadsByPercentage", "bcl_measure_uuid": "3ec7d1f0-‐7016-‐0131-‐6caa-‐00ffc0914e0d", "bcl_measure_version_uuid": "3ec8bc50-‐7016-‐0131-‐6cae-‐00ffc0914e0d", "measure_type": "RubyMeasure", "name": "reduce_lighting_loads_by_percentage", "display_name": "Reduce Lighting Loads by Percentage", "variables": [
{
"argument": {
"display_name": "Lighting Power Reduction", "machine_name": "lighting_power_reduction", "name": "lighting_power_reduction_percent", },
"display_name": "Lighting Power Reduction", "machine_name": "lighting_power_reduction", "name": "lighting_power_reduction", "minimum": 0.0, "maximum": 50.0, "units": "", "variable": true, "variable_ADDME": true, "relation_to_output": "", "uncertainty_description": { "attributes": [ { "name": "modes", "value": 40.0 }, { "name": "lower_bounds", "value": 0.0 }, { "name": "upper_bounds", "value": 50.0 }, { "name": "stddev", "value": 8.333333333333334 } ], "type": "triangle_uncertain" }, } ], "workflow_index": 0, }, { ... "measure_definition_class_name": "ReduceSpaceInfiltrationByPercentage", ... "measure_definition_class_name": "RotateBuilding", ... "measure_definition_class_name": "SetWindowToWallRatioByFacade", ... "measure_definition_class_name": "SetWindowToWallRatioByFacade",
Figure 6. Problem Formulation Submission and Analysis
Once the user has uploaded the payload and POSTed the workflow and the problem definition, then the user submits an action POST to inform the server to start the analysis. Figure 7 shows an example of the POST parameters. These parameters are used to select which analysis (in the case below “optim”), the action to take on the analysis (e.g., start, stop), and selecting which scripts to run to create the data points/simulations. Required parameters are defaulted if no values are passed in.
Figure 7. Analysis Action JSON
The concept of POSTing analyses allows the server to chain analyses together. As an example, if the user wants to sample 100 variables with 10,000 samples and run the simulations with the samples, the user breaks up the request into two analyses. The user first submits an analysis to sample the parameter space using a specific algorithm, such as Latin Hypercube Sampling, then submits a second analysis to run all the data points generated. Breaking up the analysis allows the user (or the server) to view the results of the first analysis to inform the subsequent analysis. Another common
staged analysis is to run a subset of the parameter space to conduct a sensitivity analysis, then use the results of the analysis to determine which variables should be included in a calibration or optimization. The user does not have to wait until the first analysis is complete before submitting the subsequent analysis; they just have to submit them in the order they want them to run. In the case of an optimization, the submission is only one analysis because the optimization algorithm handles the generation of the data points.
Simulation Results
Once the user uploads all the required data, the server starts the analysis as a background task. The first step of the analysis is to configure the worker nodes by copying over the required files. The second step is to handover the process to the Simulation Executive. Because the analysis task is run in the background, the server is available to view the results on the fly or receive more analyses to be queued. As each data point/simulation finishes, the simulation results are pushed back to the server.
Figure 7 shows the output of the large office building optimized using the NSGA2 algorithm. The Pareto front is clearly visible.
Figure 8. Example Results of an Optimization
The last step of the analysis is a post-process or cleanup task. This task is defined in the algorithm and allows for data to be post-processed for various needs. The results of all the simulations are downloadable as either comma-separated value files or R data frames.
NEXT STEPS
The development and deployment of the OpenStudio Server and worker images are currently limited to Amazon AWS. Although the technologies and tools chosen for the development have the capability of provisioning instances other than Ubuntu and in environments other than Amazon, these have yet to be explored because of certain Amazon-specific APIs used
{ skip_init: false, create_data_point_filename: "create_data_point.rb", output_variables: [ { variable_name: ‘cooling_energy’, objective_function: true, objective_function_index: 1 }, { variable_name: ‘cooling_energy’, objective_function: true, objective_function_index: 1 }, ], problem: { random_seed: 7192837, algorithm: { generations: 9, toursize: 2, cprob: 0.7, xoverdistidx: 5, mudistidx: 10, mprob: 0.5, normtype: "minkowski", ppower: 2, } } } { "analysis_action":"start", "without_delay":false, "analysis_type":"optim", "allow_multiple_jobs":true, "use_server_as_worker":true, "simulate_data_point_filename":"simulate_dp.rb", "run_data_point_filename":"run_openstudio.rb" }
(e.g., Amazon’s Security Groups and AMIs) would need to be abstracted.
Adding a new analysis requires the addition of only one file in the lib directory of the web application; however, it requires rebuilding the AMIs to expose the new analysis. The desire to have a user upload a custom analysis script is simple but requires a security check on the systems.
Another next step is to develop the ability to persist the results into Amazon’s EBS or S3 data stores. This will allow users the ability to restart the instance again to see their results. In many cases the data created are too large to be stored on a local machine and the data download latency and costs are prohibitive.
Finally, users have asked for a local image that can be used to run a smaller analysis without having to spin-up instances on Amazon. Vagrant has the ability to package .box files that are snapshots of the VirtualBox image with associated metadata. These images could be downloaded and installed on a local machine to run the analysis. This workflow is similar to the developer’s workflow and requires the user’s machine to be large enough to handle at least one virtual machine with substantial data storage.
CONCLUSIONS
The ability to conduct large-scale BEM simulation studies is becoming more common with the user’s desire to explore larger parameter spaces with more complicated systems during the building design phases. OpenStudio, through both PAT and the OpenStudio Analysis Spreadsheet, has added the capability for users to use AWS to run a large number of simulations. This paper described the complexity and the tools used to consistently and repeatably create the instances to satisfy the quickly changing landscape of OpenStudio development.
An example analysis showed the API methods that are exposed to the user, including examples of the data formats used to describe the analysis. The workflow is designed around using OpenStudio’s measures to programmatically perturb the models.
ACKNOWLEDGMENT
The authors appreciate continued support from the U.S. Department of Energy’s Buildings Technology Office, which has produced the underlying OpenStudio platform.
REFERENCES
Amazon. 2014. AWS SDK Core Ruby Gem. https://github.com/aws/aws-sdk-core-ruby. Last Accessed: March 10, 2014.
Amazon. 2014b. Amazon Machine Images (AMI). http://docs.aws.amazon.com/AWSEC2/latest/User Guide/AMIs.html. Last Accessed: March 13, 2014.
Crawley, D. B., Hand, J. W., Kummert, M., & Griffith, B. T. (2005). Contrasting the Capabilities of Building Energy Performance. Building Simulation (pp. 231-238). Montreal.
Deb, K., Pratap, A., Agarwal, S., & Meyarivan, T. (2002). A Fast and Elitist Multiobjective Genetic Algorithm: NSGA-II. IEEE TRANSACTIONS ON
EVOLUTIONARY COMPUTATION (pp.
182-197). IEEE.
Macumber, D., Ball, B., Long, N. 2014. A Graphical Tool for Cloud Based Building Energy Simulation. Submitted EMC Simbuild 2014.
NREL. 2014a. OpenStudio Analysis Spreadsheet: Source Code. National Renewable Energy Laboratory.
https://github.com/NREL/OpenStudio-analysis-spreadsheet. Last Accessed: March 13, 2014. NREL. 2014b. OpenStudio. National Renewable
Energy Laboratory. http://openstudio.nrel.gov/. Last accessed: March 5, 2014.
Opscode. 2014. Chef Documents: About the Chef-Client Run. http://docs.opscode.com/essentials_ nodes_chef_run.html
Phalip, J. 2012. Chef: Boosting Teamwork with Vagrant. http://www.digitalforreallife.com/tag/ chef. Last accessed: March 5, 2014.