ERIM REPORT SERIES RESEARCH IN MANAGEMENT
ERIM Report Series reference number ERS-2000-51-LIS
Publication November 2000
Number of pages 24
Email address first author [email protected]
Address Erasmus Research Institute of Management (ERIM)
Rotterdam School of Management / Faculteit Bedrijfskunde Erasmus Universiteit Rotterdam
PoBox 1738
3000 DR Rotterdam, The Netherlands Phone: # 31-(0) 10-408 1182 Fax: # 31-(0) 10-408 9640 Email: [email protected] Internet: www.erim.eur.nl
Bibliographic data and classifications of all the ERIM reports are also available on the ERIM website: www.erim.eur.nl
E
XTENDEDF
UZZYC
LUSTERINGA
LGORITHMSU
ZAYK
AYMAK ANDM
AGNES
ETNESE
RASMUS
R
ESEARCH
I
NSTITUTE OF
M
ANAGEMENT
REPORT SERIES
RESEARCH IN MANAGEMENT
B
IBLIOGRAPHIC DATA AND CLASSIFICATIONSAbstract Fuzzy clustering is a widely applied method for obtaining fuzzy models from data. It has been applied successfully in various fields including finance and marketing. Despite the successful applications, there are a number of issues that must be dealt with in practical applications of fuzzy clustering algorithms. This technical report proposes two extensions to the objective function based fuzzy clustering for dealing with these issues. First, the (point) prototypes are extended to hypervolumes whose size is determined automatically from the data being clustered. These prototypes are shown to be less sensitive to a bias in the distribution of the data. Second, cluster merging by assessing the similarity among the clusters during optimization is introduced. Starting with an over-estimated number of clusters in the data, similar clusters are merged during clustering in order to obtain a suitable partitioning of the data. An adaptive threshold for merging is introduced. The proposed extensions are applied to Gustafson–Kessel and fuzzy c-means algorithms, and the resulting extended algorithms are given. The properties of the new algorithms are illustrated in various examples.
5001-6182 Business 5201-5982 Business Science Library of Congress
Classification
(LCC) Q 276-280 Mathamatical Statistics
M Business Administration and Business Economics M 11 R 4 Production Management Transportation Systems Journal of Economic Literature (JEL)
C 8 Data collection and data estimation methodology 85 A Business General
260 K 240 B
Logistics
Information Systems Management European Business Schools
Library Group (EBSLG)
250 B Fuzzy theory Gemeenschappelijke Onderwerpsontsluiting (GOO)
85.00 Bedrijfskunde, Organisatiekunde: algemeen 85.34
85.20
Logistiek management
Bestuurlijke informatie, informatieverzorging Classification GOO
31.80 Toepassingen van de wiskunde Bedrijfskunde / Bedrijfseconomie
Bedrijfsprocessen, logistiek, management informatiesystemen Keywords GOO
Gegevensverwerking, Data mining, Fuzzy theorie, en Algoritmen Free keywords Fuzzy clustering, cluster merging, volume prototypes, similarity.
Extended Fuzzy Clustering Algorithms
Uzay Kaymak
aMagne Setnes
ba
Erasmus University Rotterdam
Faculty of Economics, Department of Computer Science
P.O. Box 1738, 3000 DR Rotterdam, the Netherlands
E-mail: [email protected]
b
Heineken Technical Services, Research and Development
Burgemeester Smeetsweg 1, 3282 PH Zoetermeer, the Netherlands
E-mail: [email protected]
Abstract
Fuzzy clustering is a widely applied method for obtaining fuzzy models from data. It has been applied successfully in various fields including finance and marketing. Despite the successful applications, there are a number of issues that must be dealt with in practical applications of fuzzy clustering algorithms. This technical report proposes two extensions to the objective function based fuzzy clustering for dealing with these issues. First, the (point) prototypes are extended to hypervolumes whose size is determined automatically from the data being clustered. These prototypes are shown to be less sensitive to a bias in the distribution of the data. Second, cluster merging by assessing the similarity among the clusters during optimization is introduced. Starting with an over-estimated number of clusters in the data, similar clusters are merged during clustering in order to obtain a suitable partitioning of the data. An adaptive threshold for merging is introduced. The proposed extensions are applied to Gustafson–Kessel and fuzzy c-means algorithms, and the resulting extended algorithms are given. The properties of the new algorithms are illustrated in various examples.
Keywords
1
Introduction
Objective function based fuzzy clustering algorithms such as the fuzzy c-means (FCM) algo-rithm have been used extensively for different tasks such as pattern recognition, data mining, image processing and fuzzy modeling. Applications have been reported from different fields such as financial engineering [19], direct marketing [17] and systems modeling [8]. Fuzzy clus-tering algorithms partition the data set into overlapping groups such that the clusters describe an underlying structure within the data. In order to obtain a good performance from a fuzzy clustering algorithm, a number of issues must be considered. These concern the shape and the volume of the clusters, the initialization of the clustering algorithm, the distribution of the data patterns and the number of clusters in the data.
In algorithms with point prototypes, the shape of the clusters is determined by the distance measure that is used. The FCM algorithm, for instance, uses the Euclidian distance measure and is thus suitable for clusters with a spherical shape [3]. If a priori information is available regarding the cluster shape, the distance metric can be modified to the cluster shape. Alterna-tively, one can also adapt the distance metric to the data as done in the Gustafson–Kessel (GK) clustering algorithm [5]. Another way to influence the shape of the clusters is to select proto-types with a geometric structure. For example, fuzzy c-varieties (FCV) algorithm uses linear subspaces of the clustering space as prototypes [1], which is useful for detecting lines and other linear structures in the data. Since the shape of the clusters in the data is often not known, algorithms using adaptive distance metrics are more versatile in this respect.
It is well known that the fuzzy clustering algorithms are sensitive to the initialization. Often, the algorithms are initialized randomly multiple times, in the hope that one of the initializations leads to good clustering results. The sensitivity to initialization becomes acute when the distri-bution of the data patterns shows a large variance. When there are clusters with varying data density and with different volumes, a bad initialization can easily lead to sub-optimal clustering results. Moreover, the intuitively correct clustering results need not even correspond to a mini-mum of the objective function under these circumstances [12]. Hence, algorithms that are less sensitive to these variations are desired.
Perhaps the most important parameter that has to be selected in fuzzy clustering is the num-ber of clusters in the data. Objective function based fuzzy clustering algorithms partition the data in a specified number of clusters, no matter whether the clusters are meaningful or not.
The validity of the clusters must be evaluated separately, after the clustering takes place. The number of clusters should ideally correspond to the number of sub-structures naturally present in the data. Many methods have been proposed to determine the relevant number of clusters in a clustering problem. Typically, external cluster validity measures are used [4, 21] to as-sess the validity of a given partition considering criteria like the compactness of the clusters and the distance between them. Another approach to determine the number of clusters is using cluster merging, where the clustering starts with a large number of clusters and the compatible clusters are iteratively merged until the correct number of clusters are determined [7]. In addi-tion to the merging, it is also possible to remove unimportant clusters in a supervised fashion [13]. The merging approach offers a more automated and computationally less expensive way of determining the right partition.
In this report we propose an extension of objective function based fuzzy clustering algo-rithms with volume prototypes and similarity based cluster merging. The goal of this extension is to reduce the sensitivity of the clustering algorithms to bias in data distribution and to deter-mine the number of clusters automatically. Extended versions of the fuzzy c-means (E-FCM) and the Gustafson–Kessel (E-GK) algorithms are given, and their properties are studied. Real world applications of extended clustering algorithms are not considered in this report, but the interested reader is referred to [18] and [17] for a successful application of the E-FCM algorithm in direct marketing.
The outline of the report is as follows. Section 2 discusses the basics of objective function based fuzzy clustering and the issues considered in this report. Section 3 provides the general formulation of the extended fuzzy clustering proposed. The extended version of the Gustafson– Kessel algorithm is described in Section 4, while the extended fuzzy c-means algorithm is described in Section 5. It is chosen to describe the E-GK algorithm first, since it is a more general formulation than the E-FCM algorithm. Section 6 provides examples that illustrate the properties of the extended algorithms. Finally, conclusions are given in Section 7.
2
Background
Letfx 1 ;x 2 ;:::;x Ngbe a set of N data objects represented by n-dimensional feature vectors x k = [x 1k ;:::;x nk ] T 2 R n
matrix X = 2 6 6 4 x 11 x 12 x 1N .. . ... ... ... x n1 x n2 x nN 3 7 7 5 : (1)
A fuzzy clustering algorithm partitions the dataXintoM fuzzy clusters, forming a fuzzy parti-tion inX[1]. A fuzzy partition can be conveniently represented as a matrixU, whose elements u
ik
2[0;1]represent the membership degree ofx
kin cluster
i. Hence, theith row ofUcontains values of theith membership function in the fuzzy partition.
Objective function based fuzzy clustering algorithms minimize an objective function of the type J(X;U;V)= M X i=1 N X k=1 (u ik ) m d 2 (x k ;v i ) (2) where V = [v 1 ;v 2 ;:::;v M ];v i 2 R n
is a M-tuple of cluster prototypes which have to be determined, and m 2 (1;1) is a weighting exponent which determines the fuzziness of the clusters. In order to avoid the trivial solution, constraints must be imposed on U. Although algorithms with different constraints have been proposed as in [11], often the following are used: M X i=1 u ik = 1; 8k; (3) 0< N X k=1 u ik < N; 8i: (4)
These constraints imply that the sum of each column ofUis 1. Further, there may be no empty clusters, but the distribution of membership among theM fuzzy subsets is not constrained.
The prototypes are typically selected to be idealized geometric forms such as linear varieties (e.g. FCV algorithm) or points (e.g. GK or FCM algorithms). When point prototypes are used, the general form of the distance measure is given by
d 2 (x k ;v i )=(x k v i ) T A i (x k v i ); (5)
where the norm matrix A
i is a positive definite symmetric matrix. The FCM algorithm uses the Euclidian distance measure, i.e.A
i
= I 8i, while the GK algorithm uses the Mahalonibis distance, i.e.A i = P 1 i with P
i the covariance matrix of cluster
i, and the additional volume constraintjA
i j=
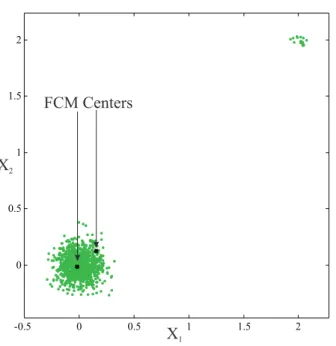
-0.5 0 0.5 1 1.5 2 0 0.5 1 1.5 2 X1 X2 FCM Centers
Figure 1: Cluster centers obtained with the FCM algorithm for data with two groups. The larger and the smaller groups have 1000 and 15 points, respectively.
The minimization of (2) subject to constraints (3) and (4) represents a nonlinear optimization problem, which is solved iteratively by a two-step process. Apart from the numberM of clusters used for partitioning, the optimization (2) is influenced by the distribution of the data objects x
k. Cluster centers tend to locate in regions with high concentrations of data points, and the sparsely populated regions may be disregarded, although they may be relevant. As a result of this behavior, the clustering algorithm may miss details as illustrated in Fig. 1. In this example, the FCM algorithm locates the centers in the neighborhood of the larger cluster, and misses the small, well-separated cluster.
One might argue that by carefully guiding the data collection process, one may attempt to obtain roughly the same data density in all interesting regions. Often, however, the analyst does not have control over the data collection process. For example, if the application area is target selection in direct marketing, there will be many customers in the data base with modal proper-ties, while the customers that the marketing department could be interested in will typically be present in small numbers. In direct marketing, for instance, the percentage of customers who respond to a personalized offer is very small compared to the percentage of customer who do not respond. Similarly, dynamic systems may generate more data in certain regions of the state
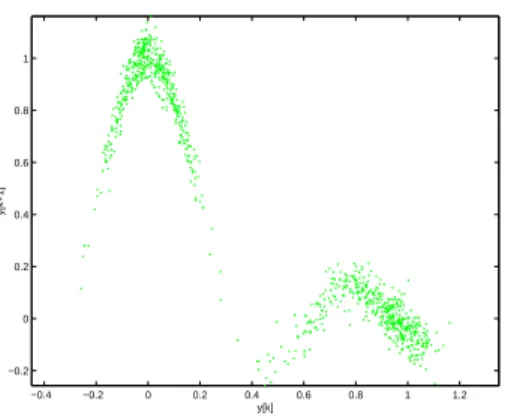
−0.4 −0.2 0 0.2 0.4 0.6 0.8 1 1.2 −0.2 0 0.2 0.4 0.6 0.8 1 y[k] y[k+1]
Figure 2: Data collected from a dynamic system may be sparse in some regions that describe the system function.
space than others. Consider, for example, the auto-regressive nonlinear system represented by
~ y k = y k +0:03e k y k+1 = sin(10~y k ) 10~y k +0:03e k ; (6) where e
k represents normally distributed random noise. Figure 2 depicts the distribution of 1000 points in the state space with y
0
= 0. Clearly, the sampling of the system function is not uniform. The next section proposes an extension of the fuzzy clustering algorithms with volume prototypes and cluster merging in order to deal with differences in data distribution and to determine the number of clusters.
3
Extended fuzzy clustering
In this section the extension of fuzzy clustering algorithms with volume prototypes and similar-ity based cluster merging is outlined. The idea of using volume prototypes in fuzzy clustering has been introduced in [16]. Volume prototypes extend the cluster prototypes from points to regions in the clustering space. The relation of the cluster volumes to the performance of the clustering algorithm has been recognized for a long time. Many cluster validity measures pro-posed are related to cluster volumes [4, 21]. Other authors have propro-posed adapting the volume of clusters [10]. Recently, a fuzzy clustering algorithm based on the minimization of the to-tal cluster volume has also been proposed [12]. This algorithm is closely related to the E-GK algorithm presented in this report.
The main advantage of using volume prototypes lies in the reduced sensitivity of the result-ing clusterresult-ing algorithm to the differences in cluster volumes and the distribution of the data patterns. This renders the clustering algorithms more robust. Further, volume prototypes are quite useful when generating fuzzy rules using fuzzy clustering, since the cores of the fuzzy sets in the rules need not be a single point, allowing the shape of the fuzzy sets to be determined by data rather than the properties of the selected clustering algorithm.
Similarity-driven simplification of fuzzy systems has been proposed in [14]. However, to our knowledge, similarity measures have not been applied for cluster merging before. In the proposed approach, cluster similarity is evaluated using a fuzzy similarity measure. Similar clusters are merged iteratively in order to determine a relevant number of clusters. Unlike the supervised fuzzy clustering (S-FC) approach proposed in [13], the fuzzy clustering algorithms proposed in this report do not require an additional optimization problem to be solved during clustering. Instead, a suitable similarity threshold must be selected for merging. It is proposed to use an adaptive threshold, which relates the threshold to the number of clusters. By initializing the clustering with an overestimated number of clusters there is also an increased possibility that all the important regions in the data are discovered, and that the dependency of the clustering result on the initialization is diminished.
3.1
Clustering with volume prototypes
Often, a number of data points close to a cluster center can be considered to belong fully to the cluster. This is especially the case when there are some clusters that are well separated from the others. It is then sensible to extend the core of a cluster from a single point to a region in the space. One then obtains volume prototypes defined as follows.
Definition: A volume prototypeV 2R n
is an-dimensional, convex and compact subspace of the clustering space.
Note that the volume prototype can have an arbitrary shape and size according to this definition. When the original cluster prototypes are points, it is straightforward to select the prototypes such that they extend a given distance in all directions. In the E-FCM algorithm, the volume cluster prototypes v~
i are then hyperspheres with center v
i and radius r
i. Similarly, the prototypes become hyperellipsoids in the E-GK algorithm.
The extended clustering algorithm measures the distance from the data points to the volume prototypes. The data pointsx
kthat fall within the hypersphere, i.e. d(x k ;v i )r i, are elements of the volume prototypev~
iand have by definition a membership of 1.0 in that particular cluster. The size of the volume prototypes are thus determined by the radiusr
i. With knowledge of the data, this radius can be defined by the user (fixed size prototypes), or it can be estimated from the data. The latter approach is followed below.
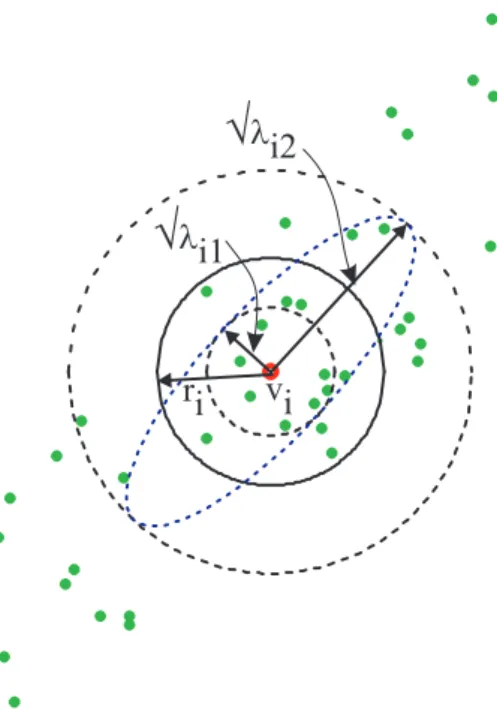
A natural way to determine the radii r i
; i = 1;:::;M is to relate them to the size of the clusters. This can be achieved by considering the fuzzy cluster covariance matrix
P i = P N k=1 u m ik (x k v i )(x k v i ) T P N k=1 u m ik : (7) The determinantjP i
jof the cluster covariance matrix gives the volume of the cluster. Because P
i is a positive definite and symmetric matrix, it can be decomposed such that P i = Q i i Q T i , where Q i is orthonormal and
i is diagonal with non-zero elements
i1 ;:::;
in. We let the volume prototypes extend a distance of
p
ij
;j = 1;2;:::;n along each eigenvector q ij. In the one dimensional case, this choice implies that the cluster prototype extends one standard deviation from the cluster center. In the multi-dimensional case, the size of the radius in each direction is determined by measuring the distances along the transformed coordinates according to p i Q T i A i Q i p i ; (8) where p
i represents a matrix whose elements are equal to the square root of the elements of
i.
When A
i induces a different norm than given by the covariance matrix,
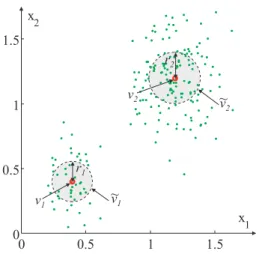
n different values will be obtained for the radius. In that case, a single value can be determined by averaging, as discussed in Section 5. The shape of the volume prototypes is the same as the shape of the clusters induced by the distance metric. When Euclidian distance measure is used as in the FCM algorithm, the volume prototypes are hyperspheres as shown in Fig. 3.
3.2
Distance measure
The distance measure used in the extended clustering algorithms is a modified version of the original distance measures. First, the distanced
ik is measured from a data point x
kto a cluster centerv
i. Then, the distance ~ d
ikto the volume prototype ~ v
0 0.5 1 1.5 0 0.5 1 1.5 x1 x2 v2 v1 r1 r2 ~ v2 v1 ~
Figure 3: Example of two E-FCM volume cluster prototypes,v~ 1 and
~ v
2, determined from data. The cluster centers, v
1 and v
2, and the radii, r
1 and r
2, determine the position and the size, respectively, of the hyperspheres.
radiusr i: ~ d ik =max(0;d ik r i ): (9)
Because the pointsx
kwithin a distance of r
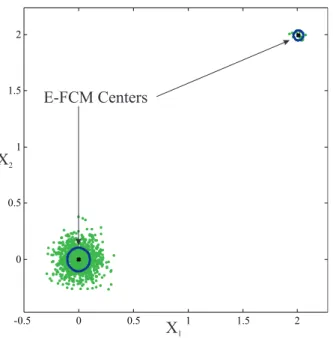
iare taken to belong fully to a single cluster, the influence of these points on the remaining clusters is removed, i.e. these points get a membership zero in the other clusters. This decreases the tendency of dense regions to attract other cluster centers. Figure 4 shows the centers computed by the E-FCM algorithm (Section 5) for the data of Fig. 1. Comparing the two figures, one observes that the influence of data points from the large group has decreased in the E-FCM algorithm, which allows the algorithm to detect the smaller cluster. It is possible, however, that the data points “claim” a cluster center during the two-step optimization and lead to a sub-optimal result. After all, when a number of data points are located within a cluster center, the objective function is decreased significantly due to the zero distance. This may prevent the separation of cluster centers, which normally happens in fuzzy clustering. This problem is dealt within the cluster merging scheme by bounding the total volume of the clusters, initially. The cluster radii are multiplied by a factor
(l ) =M (l ) , whereM (l )
is the number of clusters in the partition at iterationl of the clustering algorithm. The algorithm starts with
(0)
= 1. As cluster merging takes place, the size of the volume prototypes is allowed to increase by increasing the value of
(l ) ;
(l )
M
(l )
, to take full benefit of the properties of volume prototypes.
-0.5 0 0.5 1 1.5 2 0 0.5 1 1.5 2 X1 X2 E-FCM Centers
Figure 4: Cluster centers obtained with the E-FCM algorithm for data with two groups. The larger and the smaller groups have 1000 and 15 points, respectively.
3.3
Determining the number of clusters
The determination of the number of “natural” groups in the data is important for the success-ful application of fuzzy clustering methods. We propose a similarity based cluster merging approach for this purpose. The method is analogous to the similarity-driven rule base simpli-fication proposed in [14]. The method initializes the clustering algorithm with an estimated upper limit on the number of clusters. After evaluating the cluster similarity, similar clusters are merged. The similarity of clusters is assessed by considering the fuzzy clusters in the data space. If the similarity between clusters is higher than a threshold 2 [0;1], the clusters that are most similar are merged at each iteration of the algorithm.
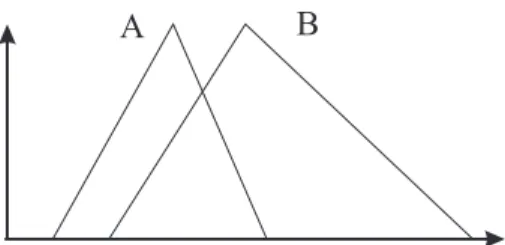
The Jaccard index used in [14] is a good measure of fuzzy set equality. In clustering, how-ever, the goal is to obtain well separated classes in the data. For this purpose, the inclusion
measure is a better similarity index. Consider Fig. 5 showing a fuzzy setAwhich is to a high degree included in a fuzzy setB. According to the Jaccard index, the two sets have a low de-gree of equality. For clustering, however, the setA can be considered quite similar to B as it is described to a large extent also byB. This quality is quantified by the fuzzy inclusion mea-sure. Given two fuzzy clusters,u
i (x k )andu j (x k
Figure 5: The degree of equality betweenAandBis low, but the degree of inclusion ofAinB is high. measure is defined as I ij = P N k=1 min(u ik ;u jk ) P N k=1 u ik : (10)
The inclusion measure represents the ratio of the cardinality of the intersection of the two fuzzy sets divided by the cardinality of one of them.
The inclusion measure is asymmetric and can be used to construct a symmetric similarity measure that assigns a similarity degreeS
ij 2[0;1], withS ij =1corresponding tou i (x k )fully included inu j (x k
), or vice versa, by letting
S ij =max(I ij ;I ji ): (11)
The threshold2[0;1]above which merging takes place depends on the characteristics of the data set (separation between groups, cluster density, cluster size, etc.) and the clustering pa-rameters such as the fuzzinessm. In general, the merging threshold is an additional user-defined parameter for the extended clustering algorithm. The degree of similarity for two clusters also depends on the other clusters in the partition. This is due to the fact that the sum of member-ship for a data object is constrained to one. For the case where the selection of the threshold is problematic, we propose to use an adaptive threshold depending on the number of clusters in the partition at any time. It has been observed empirically that the adaptive threshold works best when the expected number of clusters in the data is relatively small (less than 10).
We propose to use (l ) = 1 M (l ) 1 ; (12)
as the adaptive threshold. Clusters are merged when the change of maximum cluster similarity from iteration (l 1)to iteration (l) is below a predefined threshold , and the the similarity is above the threshold. Only the most similar pair of clusters is merged, and the number of clusters decreases at most by one at each merge. In case of ties regarding the similarity, they are
resolved arbitrarily. The algorithm terminates when the change in the elements of the partition matrix is below a defined threshold(termination criterion).
4
Extended GK algorithm
The E-GK algorithm with the adaptive threshold (12) is given in Algorithm 4.1. Gustafson and Kessel have proposed to restrict the determinant of the norm matrix to 1, i.e.jA
i
j= 1:0. Then the norm matrix is given by
A i =jP i j 1=n P 1 : (13)
Using (8), the size of the cluster prototypes is calculated as
R i = p i Q T i jP i j 1=n Q i 1 i Q T i Q i p i =jP i j 1=n I: (14)
Hence, the radius for the volume prototype is determined from the cluster volume as
r i = q jP i j 1=n : (15)
Algorithm 4.1 Extended Gustafson–Kessel algorithm.
Given the dataX, choose the initial number of clusters1<M (0)
<N, the fuzziness parameter m > 1 and the termination criterion > 0. Initialize U
(0)
(e.g. random) and letS (0) i j = 1, (0) =1. Repeat forl =1;2;:::
1. Compute pointwise cluster prototypes:
v (l ) i = P N k=1 (u (l 1) ik ) m x k P N k=1 (u (l 1) ik ) m ; 1iM (l 1) :
2. Compute radius of cluster prototypes from fuzzy covariance:
P i = N k=1 (u (l 1) ik ) m (x k v (l ) i )(x k v (l ) i ) T N k=1 (u (l 1) ik ) m ; 1iM (l 1) r i = (l 1) q jP i j 1=n =M (l 1) ; 1 iM (l 1) :
3. Compute the distances to the volume cluster prototypes:
d ik =max 0; q (jP i j 1=n )(x k v (l ) i ) T P 1 i (x k v (l ) i ) r i ; with1iM (l 1) and1k N.
4. Update the partition matrix: for1k N, let k =fijd ik =0g if k =;, u (l ) ik = 1 P M (l 1) j=1 (d ik =d jk ) 2=(m 1) ; 1iM (l 1) ; otherwise u (l ) ik = 8 < : 0 ifd ik >0 1=j k j ifd ik =0 1iM (l 1) :
5. Select the most similar cluster pair:
S (l ) ij = P N k=1 min(u (l ) ik ;u (l ) jk ) P N k=1 u (l ) ik ; 1i;j M (l 1) ; (i ;j ) = argmax (i;j) i6=j (S (l ) i;j ):
6. Merge the most similar clusters: IfjS (l ) i j S (l 1) i j j < let (l ) =1=(M (l 1) 1) ifS (l ) i j > (l ) u (l ) i k := (u (l ) i k +u (l ) j k ); 1k N; remove rowj fromU; M (l ) = M (l 1) 1
else enlarge volume prototype
(l ) =min(M (l 1) ; (l 1) +1): untilkU (l ) U (l 1) k<.
5
Extended FCM algorithm
The E-FCM algorithm with the adaptive threshold (12) is given in Algorithm 5.1. The norm matrix for the FCM algorithm is the identity matrix. Applying (8) for the size of the cluster prototypes one obtains
R = p Q T IQ p = : (16)
vi ri
Ö
li1Ö
li2Figure 6: The cluster volume and the E-FCM radius for a two-dimensional example. Hence, different values for the radius are obtained depending on the direction one selects. In general, a value between the minimal and the maximal diagonal elements of
i could be used as the radius. The selection of the mean radius thus corresponds to an averaging operation. The generalized averaging operator
D i (s)= 1 n ( n X j=1 s ij ) 1=s ; s 2R (17)
could be used for this purpose [6, 20]. Different averaging operators are obtained by selecting different values of sin (17), which controls the bias of the aggregation to the size of
ij. For s! 1, (17) reduces to the minimum operator, and hence the volume prototype becomes the largest hypersphere that can be enclosed within the cluster volume (hyperellipsoid) as shown in Fig. 6. For s ! 1, the maximum operator is obtained, and hence the volume prototype becomes the smallest hypersphere that encloses the cluster volume (hyperellipsoid). It is known that the unbiased aggregation for measurements in a metric space is obtained fors!0[9]. The averaging operator (17) then reduces to the geometric mean, so that the prototype radius is given by r i = v u u t n Y j=1 1=n ij = q jP i j 1=n : (18)
Hence, this selection for the radius leads to a spherical prototype that preserves the volume of the cluster.
Algorithm 5.1 Extended Fuzzy c-means algorithm.
Given the dataX, choose the initial number of clusters1<M (0)
<N, the fuzziness parameter m > 1and the termination criterion > 0. InitializeU
(0)
(e.g. random) and let S (0) i j = 1, (0) =1. Repeat forl =1;2;:::
1. Compute pointwise cluster prototypes:
v (l ) i = P N k=1 (u (l 1) ik ) m x k P N k=1 (u (l 1) ik ) m ; 1iM (l 1) :
2. Compute radius of cluster prototypes from fuzzy covariance:
P i = N k=1 (u (l 1) ik ) m (x k v (l ) i )(x k v (l ) i ) T N k=1 (u (l 1) ik ) m ; 1iM (l 1) r i = (l 1) q jP i j 1=n =M (l 1) ; 1 iM (l 1) :
3. Compute the distances to the volume cluster prototypes:
d ik =max 0; q (x k v (l ) i ) T (x k v (l ) i ) r i ; 1iM (l 1) ; 1kN:
4. Update the partition matrix: for1k N, let k =fijd ik =0g if k =;, u (l ) ik = 1 P M (l 1) j=1 (d ik =d jk ) 2=(m 1) ; 1iM (l 1) ; otherwise u (l ) ik = 8 < : 0 ifd ik >0 1=j k j ifd ik =0 1iM (l 1) :
5. Select the most similar cluster pair:
S (l ) ij = P N k=1 min(u (l ) ik ;u (l ) jk ) P N k=1 u (l ) ik ; 1i;j M (l 1) ; (i ;j ) = argmax (i;j) i6=j (S (l ) i;j ):
6. Merge the most similar clusters: IfjS (l ) i j S (l 1) i j j < let (l ) =1=(M (l 1) 1) ifS (l ) i j > (l ) u (l ) i k := (u (l ) i k +u (l ) j k ); 1k N; remove rowj fromU; M (l ) = M (l 1) 1
else enlarge volume prototype
(l ) =min(M (l 1) ; (l 1) +1): untilkU (l ) U (l 1) k<.
6
Examples
A real world application of the E-FCM algorithm to a data mining and modeling problem in database marketing has been described in [17]. In this section we consider the application of the extended clustering algorithms to artificially generated two-dimensional data. The examples illustrate various application areas and the properties of the extended algorithms described in Section 4 and Section 5. Unless stated otherwise, all examples have been calculated with a fuzziness parameterm=2and the adaptive threshold (12). The termination criterionis set to 0.001.
6.1
E-FCM vs cluster validity
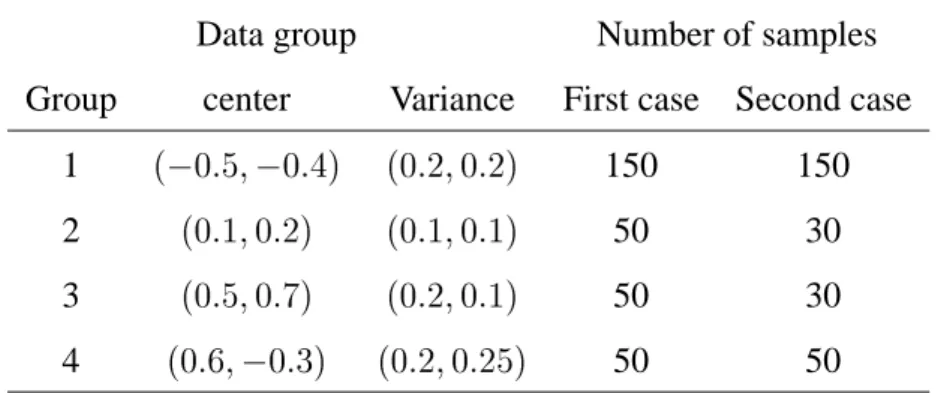
We want to compare the performance of an extended clustering algorithm against a cluster va-lidity approach for discovering the underlying data structure. Four groups of data are generated randomly from normal distributions around four centers with the standard deviations given in Table 1. Group 1 contains 150 data points and the three other groups contain 50 data points each. The goal is to automatically detect clusters in the data that reflect the underlying data structure. Since the clusters are roughly spherical, FCM and E-FCM algorithms are applied.
Table 1: Data group centers (x,y), variance ( 2 x
; 2
y) and sample size. Data group Number of samples Group center Variance First case Second case
1 ( 0:5; 0:4) (0:2;0:2) 150 150
2 (0:1;0:2) (0:1;0:1) 50 30
3 (0:5;0:7) (0:2;0:1) 50 30
4 (0:6; 0:3) (0:2;0:25) 50 50
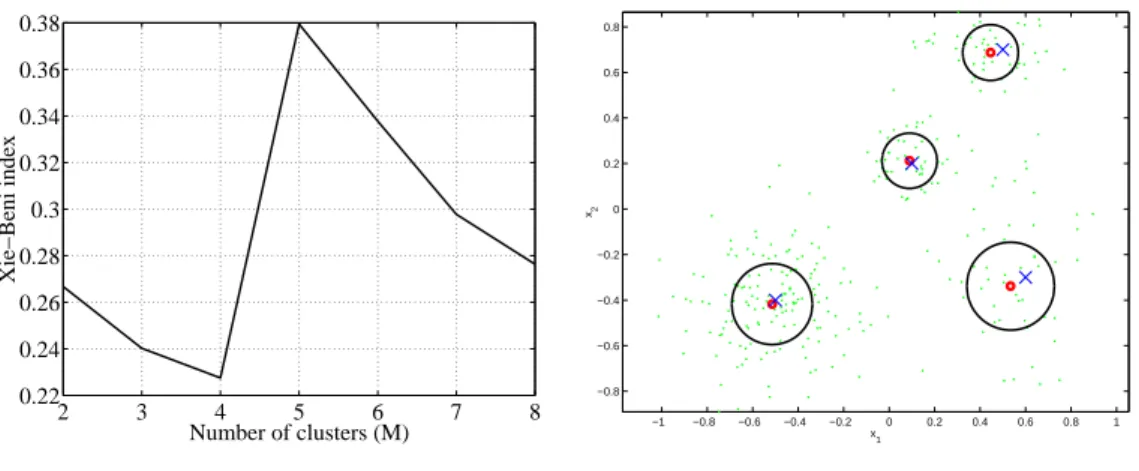
For the cluster validity approach, the FCM algorithm is applied to the data of case 1 sev-eral times with the number of clusters varying from two to eight. The resulting partitions are evaluated with the Xie-Beni cluster validity index [21], which is defined as
(U;V;X)= P M i=1 P N k=1 u m ik kx k v i k 2 N(min i;j i6=j fkv i v j kg 2 ) : (19)
The best partition is the one that minimizes the value of(U;V;X). The results of the analysis is shown in Fig. 7a. We observe that the Xie-Beni index detects the correct number of clusters in this case.
When the E-FCM algorithm is applied to the data in case 1 with a random initialization using 10 clusters, it detects successfully the four groups in the data without any user intervention. Figure 7b shows the final position of the cluster prototypes, where the volume cluster prototypes are indicated by the circles.
In case 2, same exercise as above is repeated with the number of data in the groups two and three reduced from 50 to 30 samples. The conventional approach, using the FCM algorithm and the cluster validity measure, now fails to determine the correct number of structures in the data, as shown in Fig. 8a. The E-FCM algorithm, however, is less sensitive to the distribution of the data due to the volume cluster prototypes. The E-FCM algorithm detects also this time automatically the four groups present in the data. The results are shown in Fig. 8b.
6.2
Influence of initialization
To study the influence of initialization on the extended clustering algorithms, the data for case 2 in Section 6.1 is clustered 1000 times both with the FCM and the E-FCM algorithms. The partitions have been initialized randomly each time. The FCM algorithm is set to partition the
2 3 4 5 6 7 8 0.22 0.24 0.26 0.28 0.3 0.32 0.34 0.36 0.38 Number of clusters (M) Xie−Beni index
(a) Validity measure for FCM.
−1 −0.8 −0.6 −0.4 −0.2 0 0.2 0.4 0.6 0.8 1 −0.8 −0.6 −0.4 −0.2 0 0.2 0.4 0.6 0.8 x 1 x2 (b) E-FCM result.
Figure 7: (a) Using FCM and cluster validity indicates that there are four groups in the data. (b) The E-FCM algorithm automatically detects the correct number of data structures. The data (), group centers (x) and E-FCM cluster centers (Æ) are shown.
2 3 4 5 6 7 8 0.2 0.25 0.3 0.35 0.4 Number of clusters (M) Xie − Beni index
(a) Validity measure for FCM.
−1 −0.8 −0.6 −0.4 −0.2 0 0.2 0.4 0.6 0.8 1 −0.8 −0.6 −0.4 −0.2 0 0.2 0.4 0.6 0.8 x 1 x2 (b) E-FCM result.
Figure 8: (a) Combination of FCM and cluster validity fails in determining the four groups in the reduced data set. (b) The E-FCM algorithm automatically detects the correct number of data structures in the reduced data set. The data (), group centers (x) and E-FCM cluster centers (Æ) are shown.
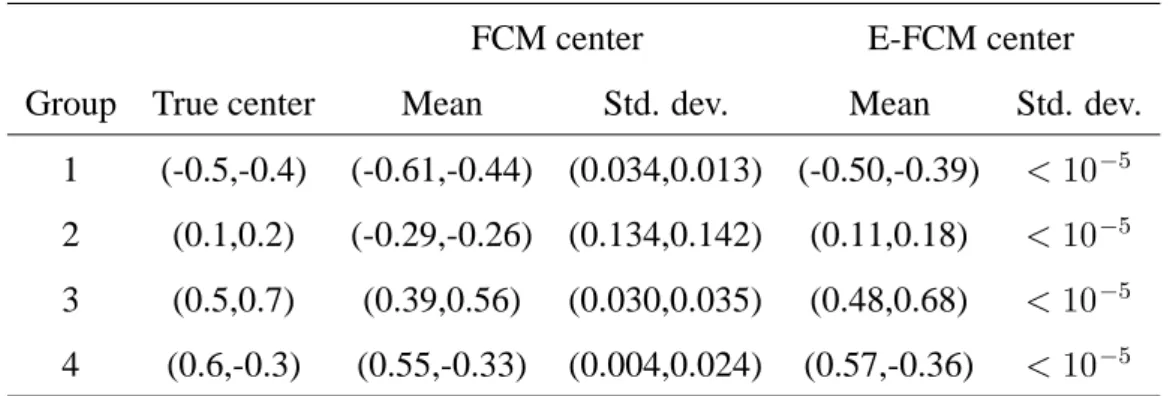
Table 2: Mean and standard deviation of cluster centers found by the FCM and E-FCM algo-rithms after 1000 experiments with random initialization.
FCM center E-FCM center Group True center Mean Std. dev. Mean Std. dev.
1 (-0.5,-0.4) (-0.61,-0.44) (0.034,0.013) (-0.50,-0.39) <10 5 2 (0.1,0.2) (-0.29,-0.26) (0.134,0.142) (0.11,0.18) <10 5 3 (0.5,0.7) (0.39,0.56) (0.030,0.035) (0.48,0.68) <10 5 4 (0.6,-0.3) (0.55,-0.33) (0.004,0.024) (0.57,-0.36) <10 5
data into four clusters, while the E-FCM algorithm is started with 10 clusters initially. After each run, the cluster centers are recorded. Table 6.2 shows the mean cluster centers and the standard deviation of the cluster center coordinates after 1000 experiments. It is observed that the cluster centers found by the E-FCM algorithm are closer to the true centers than the ones found by the FCM algorithm. Moreover, the standard deviation of the centers is much lower for the E-FCM algorithm. The FCM algorithm has especially difficulty with the small data group 2, which seems to be missed if the initialization is not good. Therefore, the mean cluster center is far away from any of the true cluster centers, and the standard deviation of the center coordinates is very large. The E-FCM algorithm has proven to be much more robust to the partition initialization. In fact, the similarity threshold has a larger impact on the algorithm than initialization. This is to be expected since merging too many or too few clusters would change the remaining center coordinates significantly.
6.3
Modeling dynamic systems
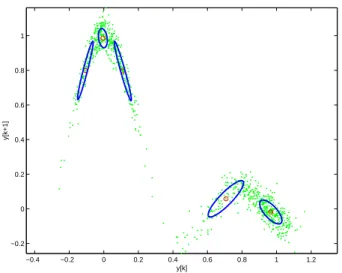
The generation of fuzzy models using the GK algorithm has been described in [7, 15]. In this example, we apply the E-GK algorithm on data generated by the dynamic system of (6). Only the clustering step is shown, although a full modeling of the system would require a considera-tion of rule base generaconsidera-tion, simplificaconsidera-tion, parameter estimaconsidera-tion and model validaconsidera-tion. These steps fall beyond the scope of this report.
The E-GK algorithm is applied on the data set shown in Fig. 2. The algorithm is initialized with 10 clusters. The clustering result and the location of the volume prototypes are depicted
−0.4 −0.2 0 0.2 0.4 0.6 0.8 1 1.2 −0.2 0 0.2 0.4 0.6 0.8 1 y[k] y[k+1]
Figure 9: E-GK cluster prototypes for an auto-regressive nonlinear dynamic system. in Fig. 9. The algorithm detects five clusters and positions them to reflect the general shape of the underlying function. A Takagi–Sugeno rule with a linear consequent could now be obtained from each cluster. The cluster centers are positioned in regions dense with data. The sparse regions, however, are also covered since the GK clusters extend a great deal from the cluster prototypes. One of the clusters in a dense region is relatively small. Model validation step would be required to assess the importance of this small cluster.
6.4
Line detection
The E-GK algorithm is capable of determining variously shaped clusters in the same data set. Figure 10 shows the application of the E-GK algorithm to a data set with five noisy linear data groups. The algorithm is initialized with 10 clusters. It automatically detects the five groups in the data. Note how the volume prototypes are adjusted to the various thickness of the lines.
A similar but more difficult example is given in Fig. 11. The data set consists of samples from four letters, each with three linear regions of different length, thickness and density. The E-GK algorithm is used starting with 20 clusters and a fixed similarity threshold of = 0:25. The algorithm automatically determines the intuitively correct result.
6.5
Iris data
Over the many years concerning research on fuzzy clustering, it has become difficult to imagine a publication on fuzzy clustering that does not refer to the iris data set [2]. We follow the same
0 0.2 0.4 0.6 0.8 1 1.2 0.1 0.2 0.3 0.4 0.5 0.6 0.7 0.8 0.9 1
Figure 10: The E-GK algorithm correctly identifies the five noisy lines in the data set. The algorithm is initialized with 10 clusters.
0.2 0.4 0.6 0.8 1 1.2 1.4 1.6 1.8 2 2.2 −0.2 0 0.2 0.4 0.6 0.8 1 1.2 1.4
Figure 11: The E-GK algorithm leads to the intuitively correct result of 12 clusters, each of which is situated in a linear region. The algorithm is initialized to 20 clusters with=0:25.
tradition. E-GK algorithm is applied to the iris data starting with 10 clusters. The algorithm determines three groups in the data, which leads to a mis-classification of 7 patterns in the unsupervized case.
7
Conclusions
Two extensions have been proposed to the objective function based fuzzy clustering algorithms in order to deal with some critical issues in fuzzy clustering. The extensions consist of the use of volume cluster prototypes and similarity-driven merging of clusters. The volume prototypes reduce the influence of the differences in distribution and density of the data on the clustering result, while the similarity-driven merging helps determine a suitable number of clusters, start-ing from an overestimated number of clusters. By initializstart-ing the clusterstart-ing algorithm with an overestimated number of clusters, the possibility increases for the algorithm to detect all the important regions of the data. This decreases the dependency of the clustering result on the (random) initialization.
Extended versions of the fuzzy c-means and the Gustafson–Kessel clustering algorithms are given. We have shown with examples that the proposed algorithms are capable of automatically determining a suitable partition of the data without additional input from the user. An adaptive similarity threshold has been proposed for this purpose.
References
[1] J. Bezdek. Pattern Recognition with Fuzzy Objective Function. Plenum Press, New York, 1981.
[2] J. C. Bezdek, J. M. Keller, R. Krishnapuram, L. I. Kuncheva, and N. R. Pal. Will the real Iris data please stand up? IEEE Transactions on Fuzzy Systems, 7(3):368–369, June 1999. [3] J. Dunn. A fuzzy relative of the isodata process and its use in detecting compact,
well-seperated clusters. Journal of Cybernetics, 3(3):32–57, 1973.
[4] I. Gath and A. B. Geva. Unsupervised optimal fuzzy clustering. IEEE Transactions on
[5] D. Gustafson and W. Kessel. Fuzzy clustering with a fuzzy covariance matrix. In Proc.
IEEE CDC, pages 761–766, San Diego, USA, 1979.
[6] G. H. Hardy, J. E. Littlewood, and G. Polya. Inequalities. Cambridge University Press, London, second edition, 1973.
[7] U. Kaymak and R. Babuˇska. Compatible cluster merging for fuzzy modelling. In
Pro-ceedings of the Fourth IEEE International Conference on Fuzzy Systems, volume 2, pages
897–904, Yokohama, Japan, Mar. 1995.
[8] U. Kaymak, R. Babuˇska, M. Setnes, H. B. Verbruggen, and H. R. van Nauta Lemke. Methods for simplification of fuzzy models. In D. Ruan, editor, Intelligent Hybrid Systems, pages 91–108. Kluwer Academic Publishers, Boston, 1997.
[9] U. Kaymak and H. R. van Nauta Lemke. A sensitivity analysis approach to introducing weight factors into decision functions in fuzzy multicriteria decision making. Fuzzy Sets
and Systems, 97(2):169–182, July 1998.
[10] A. Keller and F. Klawonn. Clustering with volume adaptation for rule learning. In
Pro-ceedings of Seventh European Congress on Intelligent Techniques and Soft Computing (EUFIT’99), Aachen, Germany, Sept. 1999.
[11] R. Krishnapuram. Generation of membership functions via possibilistic clustering. In
IEEE World Congress on Computational Intelligence, volume 2, pages 902–908, Orlando,
U.S.A., June 1994.
[12] R. Krishnapuram and J. Kim. Clustering algorithms based on volume criteria. IEEE
Transactions on Fuzzy Systems, 8(2):228–236, Apr. 2000.
[13] M. Setnes. Supervised fuzzy clustering for rule extraction. In Proceedings of
FUZZ-IEEE’99, pages 1270–1274, Seoul, Korea, Aug. 1999.
[14] M. Setnes, R. Babuˇska, U. Kaymak, and H. R. van Nauta Lemke. Similarity measures in fuzzy rule base simplification. IEEE Transactions on Systems, Man and Cybernetics, Part
[15] M. Setnes, R. Babuˇska, and H. B. Verbruggen. Rule-based modeling: precision and trans-parency. IEEE Transactions on Systems, Man and Cybernetics, Part C, 28(1):165–169, 1998.
[16] M. Setnes and U. Kaymak. Extended fuzzy c-means with volume prototypes and cluster merging. In Proceedings of Sixth European Congress on Intelligent Techniques and Soft
Computing, volume 2, pages 1360–1364. ELITE, Sept. 1998.
[17] M. Setnes and U. Kaymak. Fuzzy modeling of client preference from large data sets: an application to target selection in direct marketing. To appear in IEEE Transactions on Fuzzy Systems, 2001.
[18] M. Setnes, U. Kaymak, and H. R. van Nauta Lemke. Fuzzy target selection in direct marketing. In Proceedings of CIFEr’98, New York, Mar. 1998.
[19] M. Setnes and O. J. H. van Drempt. Fuzzy modeling in stock-market analysis. In
Pro-ceedings of IEEE/IAFE 1999 Conference on Computational Intelligence for Financial Engineering, pages 250–258, New York, Mar. 1999.
[20] H. R. van Nauta Lemke, J. G. Dijkman, H. van Haeringen, and M. Pleeging. A char-acteristic optimism factor in fuzzy decision-making. In Proc. IFAC Symp. on Fuzzy
In-formation, Knowledge Representation and Decision Analysis, pages 283–288, Marseille,
France, 1983.
[21] X. L. Xie and G. Beni. A validity measure for fuzzy clustering. IEEE Transactions on
E
RASMUS
R
ESEARCH
I
NSTITUTE OF
M
ANAGEMENT
REPORT SERIES
RESEARCH IN MANAGEMENT
Publications in the Report Series Research∗ in Management
Impact of the Employee Communication and Perceived External Prestige on Organizational Identification
Ale Smidts, Cees B.M. van Riel & Ad Th.H. Pruyn ERS-2000-01-MKT
Critical Complexities, from marginal paradigms to learning networks
Slawomir Magala ERS-2000-02-ORG
Forecasting Market Shares from Models for Sales
Dennis Fok & Philip Hans Franses ERS-2000-03-MKT
A Greedy Heuristic for a Three-Level Multi-Period Single-Sourcing Problem
H. Edwin Romeijn & Dolores Romero Morales ERS-2000-04-LIS
Integer Constraints for Train Series Connections
Rob A. Zuidwijk & Leo G. Kroon ERS-2000-05-LIS
Competitive Exception Learning Using Fuzzy Frequency Distribution
W-M. van den Bergh & J. van den Berg ERS-2000-06-LIS
Start-Up Capital: Differences Between Male and Female Entrepreneurs, ‘Does Gender Matter?’
Ingrid Verheul & Roy Thurik ERS-2000-07-STR
The Effect of Relational Constructs on Relationship Performance: Does Duration Matter?
Peter C. Verhoef, Philip Hans Franses & Janny C. Hoekstra ERS-2000-08-MKT
Marketing Cooperatives and Financial Structure: a Transaction Costs Economics Analysis
George W.J. Hendrikse & Cees P. Veerman ERS-2000-09-ORG
∗ ERIM Research Programs:
LIS Business Processes, Logistics and Information Systems ORG Organizing for Performance
MKT Decision Making in Marketing Management F&A Financial Decision Making and Accounting
A Marketing Co-operative as a System of Attributes: A case study of VTN/The Greenery International BV,
Jos Bijman, George Hendrikse & Cees Veerman ERS-2000-10-ORG
Evaluating Style Analysis
Frans A. De Roon, Theo E. Nijman & Jenke R. Ter Horst ERS-2000-11-F&A
From Skews to a Skewed-t: Modelling option-implied returns by a skewed Student-t
Cyriel de Jong & Ronald Huisman ERS-2000-12-F&A
Marketing Co-operatives: An Incomplete Contracting Perspective
George W.J. Hendrikse & Cees P. Veerman ERS-2000-13– ORG
Models and Algorithms for Integration of Vehicle and Crew Scheduling
Richard Freling, Dennis Huisman & Albert P.M. Wagelmans ERS-2000-14-LIS
Ownership Structure in Agrifood Chains: The Marketing Cooperative
George W.J. Hendrikse & W.J.J. (Jos) Bijman ERS-2000-15-ORG
Managing Knowledge in a Distributed Decision Making Context: The Way Forward for Decision Support Systems
Sajda Qureshi & Vlatka Hlupic ERS-2000-16-LIS
Organizational Change and Vested Interests
George W.J. Hendrikse ERS-2000-17-ORG
Strategies, Uncertainty and Performance of Small Business Startups
Marco van Gelderen, Michael Frese & Roy Thurik ERS-2000-18-STR
Creation of Managerial Capabilities through Managerial Knowledge Integration: a Competence-Based Perspective
Frans A.J. van den Bosch & Raymond van Wijk ERS-2000-19-STR
Adaptiveness in Virtual Teams: Organisational Challenges and Research Direction
Sajda Qureshi & Doug Vogel ERS-2000-20-LIS
Currency Hedging for International Stock Portfolios: A General Approach
Frans A. de Roon, Theo E. Nijman & Bas J.M. Werker ERS-2000-21-F&A
Transition Processes towards Internal Networks: Differential Paces of Change and Effects on Knowledge Flows at Rabobank Group
Raymond A. van Wijk & Frans A.J. van den Bosch ERS-2000-22-STR
Assessment of Sustainable Development: a Novel Approach using Fuzzy Set Theory
A.M.G. Cornelissen, J. van den Berg, W.J. Koops, M. Grossman & H.M.J. Udo ERS-2000-23-LIS
Creating the N-Form Corporation as a Managerial Competence
Raymond vanWijk & Frans A.J. van den Bosch ERS-2000-24-STR
Competition and Market Dynamics on the Russian Deposits Market
Piet-Hein Admiraal & Martin A. Carree ERS-2000-25-STR
Interest and Hazard Rates of Russian Saving Banks
Martin A. Carree ERS-2000-26-STR
The Evolution of the Russian Saving Bank Sector during the Transition Era
Martin A. Carree ERS-2000-27-STR
Is Polder-Type Governance Good for You? Laissez-Faire Intervention, Wage Restraint, And Dutch Steel
Hans Schenk ERS-2000-28-ORG
Foundations of a Theory of Social Forms
László Pólos, Michael T. Hannan & Glenn R. Carroll ERS-2000-29-ORG
Reasoning with partial Knowledge
László Pólos & Michael T. Hannan ERS-2000-30-ORG
Applying an Integrated Approach to Vehicle and Crew Scheduling in Practice
Richard Freling, Dennis Huisman & Albert P.M. Wagelmans ERS-2000-31-LIS
Informants in Organizational Marketing Research: How Many, Who, and How to Aggregate Response?
Gerrit H. van Bruggen, Gary L. Lilien & Manish Kacker ERS-2000-32-MKT
The Powerful Triangle of Marketing Data, Managerial Judgment, and Marketing Management Support Systems
Gerrit H. van Bruggen, Ale Smidts & Berend Wierenga ERS-2000-33-MKT
The Strawberry Growth Underneath the Nettle: The Emergence of Entrepreneurs in China
Barbara Krug & Lászlo Pólós ERS-2000-34-ORG
Consumer Perception and Evaluation of Waiting Time: A Field Experiment
Gerrit Antonides, Peter C. Verhoef & Marcel van Aalst ERS-2000-35-MKT
Trading Virtual Legacies
Slawomir Magala ERS-2000-36-ORG
Broker Positions in Task-Specific Knowledge Networks: Effects on Perceived Performance and Role Stressors in an Account Management System
David Dekker, Frans Stokman & Philip Hans Franses ERS-2000-37-MKT
An NPV and AC analysis of a stochastic inventory system with joint manufacturing and remanufacturing
Erwin van der Laan ERS-2000-38-LIS
Generalizing Refinement Operators to Learn Prenex Conjunctive Normal Forms
Shan-Hwei Nienhuys-Cheng, Wim Van Laer, Jan Ramon & Luc De Raedt ERS-2000-39-LIS
Classification and Target Group Selection bases upon Frequent Patterns
Wim Pijls & Rob Potharst ERS-2000-40-LIS
New Entrants versus Incumbents in the Emerging On-Line Financial Services Complex
Manuel Hensmans, Frans A.J. van den Bosch & Henk W. Volberda ERS-2000-41-STR
Modeling Unobserved Consideration Sets for Household Panel Data
Erjen van Nierop, Richard Paap, Bart Bronnenberg, Philip Hans Franses & Michel Wedel ERS-2000-42-MKT
The Interdependence between Political and Economic Entrepeneurship
ERS-2000-43-ORG Barbara Krug
Ties that bind: The Emergence of Entrepreneurs in China
Barbara Krug ERS-2000-44-ORG
What’s New about the New Economy? Sources of Growth in the Managed and Entrepreneurial Economies
David B. Audretsch and A. Roy Thurik ERS-2000-45-STR
Human Resource Management and Performance: Lessons from the Netherlands
Paul Boselie, Jaap Paauwe & Paul Jansen ERS-2000-46-ORG
Average Costs versus Net Present Value: a Comparison for Multi-Source Inventory Models
Erwin van der Laan & Ruud Teunter ERS-2000-47-LIS
A Managerial Perspective on the Logic of Increasing Returns
Erik den Hartigh, Fred Langerak & Harry Commandeur ERS-2000-48-MKT
Fuzzy Modeling of Client Preference in Data-Rich Marketing Environments
Magne Setnes & Uzay Kaymak ERS-2000-49-LIS
The Mediating Effect of NPD-Activities and NPD-Performance on the Relationship between Market Orientation and Organizational Performance
Fred Langerak, Erik Jan Hultink & Henry S.J. Robben ERS-2000-50-MKT