OUTSIDE ENTREPRENEURIAL CAPITAL
ESRC Centre for Business Research, University of Cambridge Working Paper No. 301
by
Andy Cosh University of Cambridge Centre for Business Research
Top Floor, The Judge Institute of Management Building Trumpington Street Cambridge CB2 1AG Tel: +44 (0)1223 335605 Fax: +44 (0)1223 335566 E-mail: [email protected] Web: http://www.cbr.cam.ac.uk/people/cosh.htm Douglas Cumming
School of Banking and Finance University of New South Wales
Sydney, NSW 2052 Australia Tel: +61 (0)2 9385 5709 Fax: +61 (0)2 9385 6347 Email: [email protected] Web: http://banking.web.unsw.edu.au/staff/profiles/dcumming/index.shtml Alan Hughes University of Cambridge Centre for Business Research
Top Floor, The Judge Institute of Management Building Trumpington Street Cambridge CB2 1AG Tel: +44 (0)1223 765320 Fax: +44 (0)1223 765338 E-mail: [email protected] Web: http://www.cbr.cam.ac.uk/people/hughes.htm March 2005
This Working Paper forms part of the CBR Research Programme on Enterprise and Innovation.
Abstract
This paper investigates the internal versus external financing decisions among 1900 early stage privately held UK firms in 1996-1997. We study the factors that affect rejection rates in applications for outside finance among the different types of investors, taking into account the non-randomness in a firm’s decision to seek outside finance. The data support the traditional pecking order theory; firms with greater capital expenditures / profits are more likely to seek finance and apply for more external finance. The data further indicate growth oriented firms are much more likely to apply for external finance. There are some differences in the internal versus external financing of female and male founder CEO firms, but these differences are largely attributable to growth orientation. Firms in industries with a greater proportion of larger competitors are less likely to obtain all of their desired outside capital. The data also indicate banks are less likely to finance completely new startups, while venture capital funds are more likely to finance innovative and growth orientated firms. Overall, the data do not indicate the presence of a capital gap in entrepreneurial finance; rather, firms seeking capital are able to secure their requisite financing from at least one of the many different available sources.
Keywords: Entrepreneurial Finance, Capital Gaps, Pecking Order, Adverse Selection, Gender
JEL Classification: G21, G22, G23, G24, G31, G32, G35
Further information about the Centre for Business Research can be found at the
1. Introduction
This paper engages two interrelated empirical questions. First, what are the characteristics of privately held entrepreneurial firms that seek external [‘outside’] finance, and what drives the request for capital from the different potential sources of external finance: banks, venture capitalists, private individuals, leasing, factoring, suppliers/customers, partners/working shareholders, among other sources? Second, what are the factors that lead to rejection or acceptance of requests for external finance, given this non-randomness in the types of firms that seek external finance (in the spirit of Heckman, 1976, 1979)?
It is widely recognized that the decision to seek external finance and the type of financing sought is related to information asymmetries faced by investors regarding the entrepreneurial firm’s quality (see, e.g., Jensen and Meckling,
1976).1 Where entrepreneurs have information that investors do not have,
external equity finance (which dilutes the entrepreneurs’ ownership share) is given unused debt capacity indicative of a low quality firm (Myers and Majluf, 1984; see also Myers, 2000). This stream of research has derived a standard pecking order theory, in that firms prefer to finance new projects with internal cash flows first, and then if necessary, thereafter seek external debt capital and lastly seek external equity capital. This rank ordering, however, might be distorted by the fact that external sources of capital could add value to their investee firms. For example, Garmaise (2000) shows that if investors are known to possess a greater ability to assess project quality relative to that of the entrepreneurial team, external equity finance is indicative of a high quality firm. Also De Meza and Webb (1987, 1992) argue that banks may not be ill informed relative to new firms and show that if we abandon the Stiglitz and Weiss (1981) assumption of mean preserving spreads of risk then their rationing results do not hold (see also De Meza and Webb, 1999, 2000). In our paper, we test these theoretical propositions by first taking into account for preliminary question of what drives the decision of a firm to seek external financing. We then empirically analyze the matching of different types of firms and investors, taking into account the non-randomness in the types of firms that sought outside capital.
Our analysis builds on an important but largely segmented literature in financial intermediation and entrepreneurial finance (briefly surveyed in section 2). Academic studies of the interaction between firms and their sources of capital focus, almost exclusively, on a single source of capital. Separate streams of literature have emerged in bank finance, lease finance, venture capital (VC) finance, angel investor finance, supplier finance, etc. In theoretical work, the
need to focus on one (or in exceptional cases, two) external capital sources is directly attributable to theoretical tractability (one cannot model everything). In empirical work, the focus on one or two capital sources is largely attributable to data availability, since datasets are typically derived from investors, particularly in the case of non-publicly traded businesses.
In building on this prior literature, the key component of our analysis is that we introduce a very large dataset derived from private entrepreneurial firms themselves, and not from their investors. This empirical approach facilitates a number of advantages for the purpose of addressing the three central research questions outlined above. Perhaps most importantly, because we observe firms that did and did not seek external finance, we avoid Heckman (1976, 1979) sample selection problems in analyzing the role of external investors in facilitating the development of entrepreneurial firms. Prior work on topic (see section 2) is typically derived from one type of investor and thereby fails to consider the non-random selection process among those entrepreneurial firms that seek external finance, and the non-random selection process among different types of potential investors.
A second key component of our analysis is that we have a very detailed and broad-based dataset from 1900 UK entrepreneurial firms in the period spanning 1996-1997 the majority of which were formed in the 1980s and early 1990s (specific details are provided in section 4). A number of firms in the sample sought external finance from a wide variety of potential outside investors, and some successfully obtained external finance. This diversity in the data is of interest, as it allows us to carry out unique analyses of the decision to seek external finance from a broad spectrum of different investors. By contrast, datasets derived from investors typically provide insights into only those firms that applied for external finance with that investors, and further, typically only those firms that were successful in obtaining finance. These limitations in all empirical prior work based on data from investors and not investees are overcome in our analysis of the new data introduced herein. We are therefore able to investigate issues that have been previously considered empirically intractable.
The data indicate the following primary key results. First, we identify factors that lead firms to seek external finance. We empirically show that firms which were started to avoid unemployment of the founding entrepreneurs are approximately 7% less likely to seek external finance. There is also evidence that firms founded by females are approximately 16% less likely to seek external finance; however, that evidence can be explained by the different characteristics exhibited by firms started by females, such as lower capital
expenditures, lower turnover, and a less pronounced growth orientation. Firms that do seek external finance have the following characteristics: they have higher turnover, higher capital expenditures, and higher capital expenditures / profits. It is noteworthy that, controlling for a large number of other factors, we find the most significant determinant of applications for external finance to be capital expenditures / profits. This indicates support for the traditional pecking order in which firms finance new projects internally before seeking external finance. It is also quite noteworthy that, on a ranking from 1-4 with 4 being the highest growth orientation, an increase in the ranking by 1 point tends to increase the probability of an application for external finance by approximately 10%.
Second, we show systematic characteristics drive the amount of external finance actually sought. Firms seek a greater amount of external finance when then have greater capital expenditures, profits, capital expenditures / profits, and when they recently developed a new innovation. Controlling for the non-randomness in the decision to seek external finance in the first place in the spirit of Heckman (1976, 1979), we find a significant relation between a firm’s capital expenditures / profits and the amount of external finance actually sought, which again supports the traditional pecking order.
In the third step of the analyses, we consider the percentage of external finance obtained. There is some evidence that a smaller percentage of capital is obtained when more is asked for by the firms, and evidence that a greater percentage of capital is obtained among older firms and firms with greater profit levels; however, those results are not robust to the particular econometric specification. There is also some evidence of a comparatively smaller percentage of finance obtained, relative to the amount asked for, among firms started by females; but again, that result is not robust to controls for other variables (suggesting firms started by females obtain less financing because of their other attributes, such as their innovativeness). The most robust result is that the percentage of external finance obtained is smaller among firms that face a greater number of larger competitors (in terms of asset size). Firms facing a 10% higher percentage of competitors that are larger direct competitors tend to face a 10% reduction in the percentage of finance that they are able to obtain from sources of capital, and the statistical and economic significance of this evidence is robust to selection effects in applications for external capital across all potential sources.
We further explore these three main steps in the analyses outlined above by considering the differences between banks and VC funds, as well as other sources of capital, including hire purchase or leasing firms, factoring / invoice
discounting firms, trade customers / suppliers, partners / working shareholders, private individuals and other sources. Among the approximately 38% of 1900 firms in our sample that did seek external finance in the 1996-1997 period considered, 554 approached banks, 355 approached leasing firms, 118 approached factoring / invoice discounting firms, 99 approached partners / working shareholders, 70 approached VC funds, 62 approached private individuals, and 38 approached trade customers / suppliers (and 46 approached other sources).2 It is of interest that outright rejection rates were highest among VC funds (49% rejection), and much higher than that for banks (19% outright rejection). The lowest rejection rate was among leasing firms (5%). Banks comprised the median and mean highest percentage of outside finance in terms of which type of source was approached and which type of source provided the finance.
Regarding banks and VC funds in particular, our multivariate analyses indicate there are some similarities, in that firms with higher capital expenditures and growth objectives are more likely to seek and obtain finance from both banks and VC funds. However, the data do indicate three main differences between banks and VC funds: (1) firms that recently developed an innovation are approximately 35% more likely to both seek and obtain capital from a VC fund; (2) firms that are brand new startups are approximately 30% less likely to obtain their desired finance from a bank, but not for want of trying to obtain capital from a bank; and (3) firms with higher capital expenditures / profits are more likely to obtain capital from a bank, but not a VC fund. The general flavor of these results pertaining to banks and VC funds are consistent with prior literature (e.g., Berger and Udell, 2002; Carpenter and Peterson, 2002; Cressy,
1996, 2002; Cressy and Toivanen, 2001; Manigart et al., 1996, 2000, 2002a,b,c;
Toivanen and Cressy, 2001; Wright and Lockett, 1999, 2001; Wright and Lockett, 2003), but add to the literature by providing estimates of the economic significance which uniquely considers the non-random selection process among those entrepreneurial firms that seek external finance.
The new data and statistics introduced in this paper provide completely new evidence on the importance of external capital for entrepreneurial firms, and the comparative importance of different sources of capital. It is noteworthy that, among the 38% of firms that made non-trivial efforts to obtain external finance in our sample, the mean percentage of finance obtained (relative to the amount sought) was 84.5%, and the median percentage was 100%. Overall, while rejection rates differ across different sources of external capital, only few firms face a problem in obtaining their external capital. This evidence is somewhat counter to the conventional wisdom that entrepreneurial firms face a
comparative dearth of capital, such that there is a capital gap in the small firm sector and a need for government intervention.
This paper is organized as follows. Section 2 briefly reviews the related literature. Section 3 introduces the data considered in this paper, and presents a number of new facts pertaining to entrepreneurial finance. The testable hypotheses within the context of our new data and the prior literature are outlined in section 4. Summary statistics and multivariate analyses are provided in section 5. Thereafter, limitations, alternative explanations and future research are discussed in section 6. Concluding remarks follow.
2. Related Literature
In this paper we study the choice between internal versus external entrepreneurial finance, with regard to a wide variety of sources of outside capital. Because we consider a number of different types of investors, our work is related to a plethora of papers along segmented streams of research in financial intermediation and entrepreneurial finance. While it is of course
beyond the scope of our paper to review the entire literature herein,3 we
nevertheless provide a brief perspective of the contribution of our analyses in the context of recent related prior work.
At the most generalizable level, a firm’s decision to seek external finance is related to information asymmetries faced by investors regarding the entrepreneurial firm’s quality (see Jensen and Meckling, 1976; Stiglitz and Weiss, 1981; De Meza and Webb, 1987, 1992; Cosh and Hughes, 1994; De Meza, 2002). Myers and Majluf (1984) and Myers (2000) have derived a pecking order that results from such information asymmetries between entrepreneurs and investors, whereby firms first finance new projects with internal cash flows, and obtain external finance only where necessary because external finance is more costly when investors face information asymmetries. External debt finance is preferred to external equity finance in the traditional pecking order since equity involves a dilution of the entrepreneur’s ownership share. Recent theoretical work, however, has shown this pecking order is reversed where investors have superior knowledge about the commercialization process of an entrepreneur’s invention, and/or add value to the entrepreneur’s project (Garmaise, 2000).
Pre-IPO outside entrepreneurial capital may be provided by banks, VCs, private individuals (‘angel’ investors), leasing, factoring, suppliers/customers, partners/working shareholders, among other sources. Different streams of the academic literature have become segmented by each of these different investor
types for reasons of theoretical tractability and data availability. Nevertheless, the fundamental questions considered in the segmented literature significantly overlap in two primary ways that are pertinent to our empirical analyses. First, there is a stream of literature on the ability of an investor to mitigate informational problems associated with small (and/or high-tech) businesses, and
this has been considered in the context of banks (e.g., Berger et al., 2001), VC
finance (e.g., Gompers and Lerner, 1999), angel finance (e.g., Wong, 2003), lease finance (e.g., Porter, 1995; Myers et al., 1976), supplier finance (e.g., Tamari, 1970), etc. Second, there is a stream of literature on the contribution of the investor to the development of the investee firm, which has been assessed in the context of banking (e.g., Berger and Udell, 1998), VC finance (e.g., Bergmann and Hege, 1998; Gompers and Lerner, 1999; Kortum and Lerner,
2000; Bascha and Walz, 2001; Davila et al., 2003; Mayer et al., 2004; Hege et
al., 2004; Neus and Walz, 2004), lease finance (e.g., Yusopova, 2002), etc.
While some of the issues we consider have been addressed in prior work that is segmented by investor type, there is comparatively less rigorous data and evidence about the comparative ability of different types of investors to mitigate informational problems associated with outside finance, and the comparative importance of different sources of capital to different types of entrepreneurial firms. Moreover, given the fact that there is a non-randomness associated with the types of firms seeking external capital (in the spirit of Heckman, 1976, 1979), it is difficult to assess the importance of different types of investors to entrepreneurial firms without a comparative sample of firms that did not seek any external finance, and without knowledge of alternative sources of external finance sought by the firms. We seek to overcome some of these limitations in our analysis. We also keep in mind areas in which we face limitations ourselves, and thereby point to avenues for future research (discussed in detail in section 6 below).
Our comparative focus is somewhat related to recent work that has made significant steps in comparing two types of financial intermediaries. The recent
literature has primarily been focused on comparing banks to VC funds.4
Theoretical contributions in this regard invariably conclude that VCs are more skilled than bank managers at screening potential investees, and providing greater value-added to their investee firms (Keuschnigg and Nielsen, 2004; Udea, 2004; Landlier, 2002). These propositions are consistent with the large literature that focuses on VC funds themselves (e.g., Gompers and Lerner, 1999, 2001a,b; Casamatta, 2003; Casamatta and Haritchabalet, 2003; Schmidt, 2003; Hsu, 2004; Kortum and Lerner, 2000; Kanniainen and Keuschnigg, 2003, 2004; Keuschnigg, 2003, 2004a,b). This work is also consistent with a literature comparing banks and VCs; however, that empirical work does not consider
other types of potential investors, and does not consider the non-random selection process among those entrepreneurial firms that have sought external finance, and the non-random selection process across different types of investors. In other words, that work is not immune from the Heckman (1976,
1979) sample selection bias.5 Our dataset enables these limitations to be
overcome, and enables a broader array of different types of investors to be considered, among other things described throughout the subsequent sections of this paper.
Finally, it is noteworthy that our empirical analysis of outside entrepreneurial capital is related to a very large theoretical and empirical literature on the decision of a privately held business to go public (see, e.g., Ritter and Welch, 2002, for a recent review of that literature). Our analysis significantly differs from the IPO literature in that we focus on the much earlier decision in the life-cycle of a private business to seek external private finance, long before it would be in a position to go public (and many firms might not want to go public). And as mentioned, our data are not constrained by consideration of only one or two types of potential investors; rather, all types of external sources of capital for early stage businesses are assessed. The data introduced in this paper are described in the next section.
3. Testable Hypotheses 3.1. Primary Hypotheses
Our empirical analysis focuses on three primary hypotheses which are outlined in this section. Our first hypothesis pertains to the pecking order theory of capital structure. In particular, we are interested in knowing whether entrepreneurial firms do in fact prefer to finance projects internally with their own profits prior to seeking external finance. Traditional pecking order theory (Myers and Majluf, 1984) is consistent with this prediction, since entrepreneurs have information that investors do not have, and therefore the information asymmetry faced my outside investors makes external finance more costly. By similar reasoning, external equity finance is more costly than external debt finance since equity involves the dilution of the entrepreneurs’ ownership interest in the firm, and offers of equity finance therefore signal low quality.
Hypothesis 1a [Pecking Order and Decision to Seek External Funds]: A more profitable firm is less likely to seek external finance, or at least will seek less external capital and use internal profits to fund projects. Among firms that do seek external finance, more profitable firms will seek debt finance prior to equity finance.
Hypothesis 1b [Pecking Order and Success with Obtaining External Funds Sought]: A more profitable firm is more likely to obtain the external finance sought.
Our second central hypothesis considers the decision to seek finance as a function of entrepreneurial firm as well as investor characteristics. The costs of seeking and obtaining external capital are higher where entrepreneurial firms exhibit greater informational asymmetries. That is, the search costs for capital, as well as the terms offered to the investor, are less favorable for firms for which investors have more difficulty mitigating information problems and expected agency costs. Among younger and innovative firms for which these costs are more pronounced (as generally viewed in the literature; see e.g., Noe and Rebello, 1996), firms will only be willing to incur these costs if they have significant growth objectives. Hence, growth orientated firms are naturally more attracted to external finance as a result of their willingness to incur search costs and bear the price of external capital.
Just as entrepreneurial firm characteristics matter in respect of external financing decisions, we might likewise expect differences across different sources of capital. It is widely regarded that investors such as venture capital (VC) funds with comparative advantage in mitigating information asymmetries and agency costs (relative to banks, for instance) will be more likely to finance businesses for which risks are more pronounced, but potential returns are higher (see, e.g., Berger and Udell, 1998).
Hypothesis 2a [Growth]: Firms for which growth is the most significant objective will be, all else being equal, more likely to seek external finance.
Hypothesis 2b [Banks versus VCs]: VC funds have a comparative advantage at mitigating information asymmetries and agency costs over banks, and will therefore be more likely to be approached than banks by riskier growth orientated and innovative firms.
Finally, our last hypothesis pertains to industry structure effects on financing decisions. In his popular work on industry structure, Porter (1998) identifies five categories of factors that can give rise to differences in risk-adjusted rates of return across industries. These factors include supplier power, buyer power, barriers to entry, threat of substitutes and the degree of rivalry. The economic importance of some of these factors has been identified in the literature on a firm’s financing decisions. In short, risk-adjusted rates of return tend to be lower in industries for which there is more competition, and a stronger presence of larger dominant competitors; therefore, it is less attractive for investors to
provide external capital to entrepreneurial firms in those industries, and the terms offered by investors will be less attractive.
Hypothesis 3 [Industry Competition]: Firms that face more competitors and a stronger presence of larger dominant competitors will be less likely to obtain the amount of external capital that they seek.
3.2. Control Variables
In considering the three primary hypotheses we control for a number of potentially relevant factors. First, we consider the innovativeness of the industry, as well as the innovativeness of the firm. Innovation is associated with asset intangibility, since high-tech firms are typically more innovative and have more intangible assets (Kortum and Lerner, 2000). Higher asset intangibility is is associated with more pronounced information asymmetries and agency costs, as well as potential hold-up costs, thereby increasing the costs of external finance (Gompers and Lerner, 1999). On one hand, therefore, we would expect the costs of obtaining external finance to be greater among more innovative firms. On the other hand, the potential benefits to external equity financiers are larger the more innovative the firm. This is particularly true among a smaller subset of investors that add value to their investees. This value added can come in a variety of forms, including but not limited to advice pertaining to strategy, marketing, financing, administrative and human resource policy, as well as facilitating a network of contacts for firms that includes, but is not limited to, accountants, suppliers, customers, lawyers, and investment bankers. For example, one recent theoretical paper (Garmaise, 2000) predicts the traditional pecking order is exactly reversed when investors do provide value added and have superior skills at assessing the value of the entrepreneurial
project.6 Hence, in our empirical analyses we consider differences in financing
obtained from banks and venture capitalists.
Second, we control for an oft-repeated conventional wisdom that entrepreneurial firms started by females face greater hurdles in seeking external capital. On one level, this could simply be unjustified or “actual” sex discrimination. On another level, there might be characteristics of firms started by females that are systematically different relative to firms started by males, such as the firm’s growth objectives, the professional qualifications of the firm’s directors, the firm’s innovative activities and industry sector, among numerous other systematic differences. If so, then information asymmetries faced by outside investors might systematically differ across firms started by males and females, thereby causing systematic differences in the costs and benefits of seeking external capital by female versus male led firms. We might
label this second perspective as “apparent” (not actual) sex discrimination whereby information problems and firm characteristics give rise to the appearance of discrimination between males versus females, but such discrimination is directly attributable to those characteristics and not independently related to the maleness or femaleness of the firm’s founding CEO. Either way, we do consider and control for these alternative theories in our empirical analyses.
Finally, in our empirical tests we also control for legal form (corporation, partnership or sole proprietorship), firm age, capital expenditures, and a variety of reasons why the entrepreneurial firm was established (including reasons ranging from a desire to avoid unemployment to running a business, implementing an invention and wealth ambitions). Each of these variables (among others discussed immediately below) are pertinent as control variables, since they directly relate to a firm’s need/desire for external capital for reasons discussed in prior literature summarized in section 2. The specifics in our data are outlined in detail immediately below in section 4. Empirical tests follow in section 5.
4. Data and Summary Statistics
Our data comprise very detailed survey data from 1900 UK entrepreneurial firms in the period spanning 1996-1997. The data were collected by the Center for Business Research at the University of Cambridge, as described in detail by Cosh and Hughes (1998). The median start-up year of the firms in the data herein was 1984, where 517 started in the 1990s, 645 started in 1980s, 685 started prior to 1980, and the remaining 53 had an unknown start year.
The sampling frame for the survey was all independent businesses in manufacturing and business services with less than 500 employees in Great Britain including businesses partnerships and sole proprietors. The achieved sample was 2484 firms based on size stratified approach to avoid swamping the sample with micro businesses. The unit response rate was 25%. A response bias analysis in terms of age employment turnover pre tax profit and legal status revealed that older manufacturing firms were somewhat less likely to respond. There was no response bias of any kind in service business responses, nor any bias in manufacturing firms responses in terms of age profitability or legal status. A spatial analysis revealed that the achieved sample was representative of the regional distribution of the small business population in Great Britain (complete details on survey design and sample selection issues are provided in Bullock and Hughes, 1998).
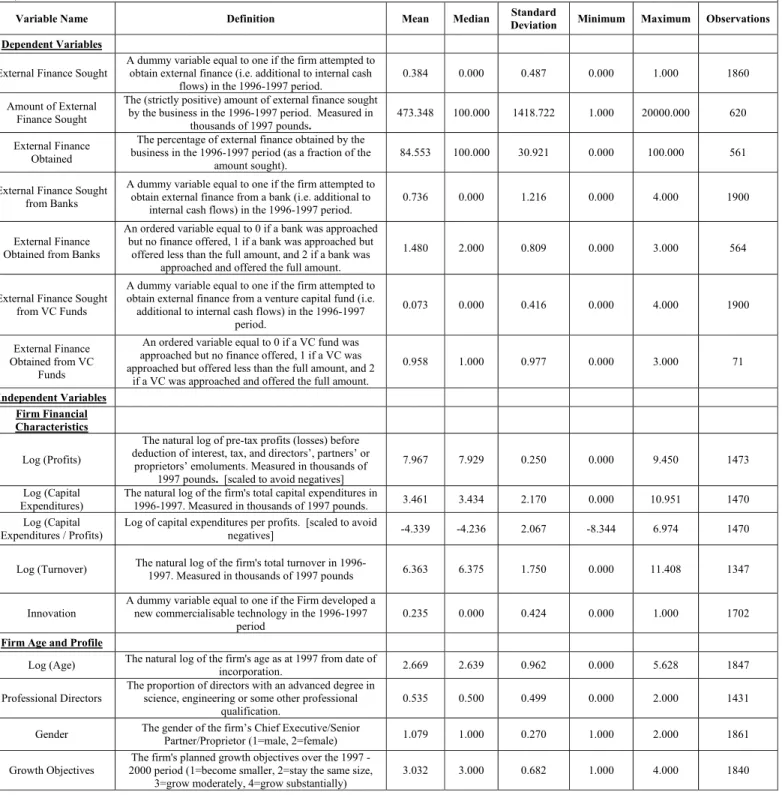
Summary statistics of the data, as well as correlations across different variables, are provided in Tables 1-4. There were 38% or (714 of 1860) firms in the data that did seek external finance in the 1996-1997 period, and 40 firms for which we were unable to ascertain whether or not external finance was sought (see Table 1). The average amount of external finance sought was £473,384, and the median amount sought was £100,000. The average amount obtained was almost 85% of that which was sought, and the median percentage obtained was 100%. Overall, therefore, the data do not suggest a shortage of external capital for firms that make more than a trivial effort in applying for capital.
Table 1. Variable Definitions and Summary Statistics
This table presents definitions of each of the variables, along with summary statistics. The total sample size is 1900 firms. The number of observations differs for each variable if the requested information from the firm was not available, or if the information requested applied only to a subset of the firms (e.g., the amount of external finance sought is a variable that only applies for those firms that actually sought external finance). These variables are used in the subsequent tables and regression analyses.
Variable Name Definition Mean Median Deviation Standard Minimum Maximum Observations
Dependent Variables
External Finance Sought
A dummy variable equal to one if the firm attempted to obtain external finance (i.e. additional to internal cash
flows) in the 1996-1997 period.
0.384 0.000 0.487 0.000 1.000 1860
Amount of External Finance Sought
The (strictly positive) amount of external finance sought by the business in the 1996-1997 period. Measured in
thousands of 1997 pounds.
473.348 100.000 1418.722 1.000 20000.000 620 External Finance
Obtained
The percentage of external finance obtained by the business in the 1996-1997 period (as a fraction of the
amount sought).
84.553 100.000 30.921 0.000 100.000 561
External Finance Sought from Banks
A dummy variable equal to one if the firm attempted to obtain external finance from a bank (i.e. additional to
internal cash flows) in the 1996-1997 period.
0.736 0.000 1.216 0.000 4.000 1900
External Finance Obtained from Banks
An ordered variable equal to 0 if a bank was approached but no finance offered, 1 if a bank was approached but
offered less than the full amount, and 2 if a bank was approached and offered the full amount.
1.480 2.000 0.809 0.000 3.000 564
External Finance Sought from VC Funds
A dummy variable equal to one if the firm attempted to obtain external finance from a venture capital fund (i.e. additional to internal cash flows) in the 1996-1997
period.
0.073 0.000 0.416 0.000 4.000 1900
External Finance Obtained from VC
Funds
An ordered variable equal to 0 if a VC fund was approached but no finance offered, 1 if a VC was approached but offered less than the full amount, and 2
if a VC was approached and offered the full amount.
0.958 1.000 0.977 0.000 3.000 71
Independent Variables
Firm Financial
Characteristics
Log (Profits)
The natural log of pre-tax profits (losses) before deduction of interest, tax, and directors’, partners’ or
proprietors’ emoluments. Measured in thousands of 1997 pounds. [scaled to avoid negatives]
7.967 7.929 0.250 0.000 9.450 1473
Log (Capital Expenditures)
The natural log of the firm's total capital expenditures in
1996-1997. Measured in thousands of 1997 pounds. 3.461 3.434 2.170 0.000 10.951 1470 Log (Capital
Expenditures / Profits)
Log of capital expenditures per profits. [scaled to avoid
negatives] -4.339 -4.236 2.067 -8.344 6.974 1470 Log (Turnover) The natural log of the firm's total turnover in
1996-1997. Measured in thousands of 1997 pounds 6.363 6.375 1.750 0.000 11.408 1347 Innovation
A dummy variable equal to one if the Firm developed a new commercialisable technology in the 1996-1997
period
0.235 0.000 0.424 0.000 1.000 1702
Firm Age and Profile
Log (Age) The natural log of the firm's age as at 1997 from date of
incorporation. 2.669 2.639 0.962 0.000 5.628 1847
Professional Directors
The proportion of directors with an advanced degree in science, engineering or some other professional
qualification.
0.535 0.500 0.499 0.000 2.000 1431
Gender The gender of the firm’s Chief Executive/Senior
Partner/Proprietor (1=male, 2=female) 1.079 1.000 0.270 1.000 2.000 1861
Growth Objectives
The firm's planned growth objectives over the 1997 - 2000 period (1=become smaller, 2=stay the same size,
3=grow moderately, 4=grow substantially)
Table 1. (Continued)
Variable Name Definition Mean Median Standard Deviation Minimum Maximum Observations
Corporation A dummy variable equal to 1 for incorporated firms 0.782 1.000 0.413 0.000 1.000 1900 Partnership A dummy variable equal to 1 for partnerships 0.124 0.000 0.330 0.000 1.000 1900 Sole Proprietorship A dummy variable equal to 1 for sole proprietorship 0.094 0.000 0.291 0.000 1.000 1900
Reason Firm
Established
Completely New Start-ups
A dummy variable equal to 1 for firms that were
Completely New Start-ups 0.629 1.000 0.483 0.000 1.000 1900
Founded to avoid unemployment of
founder(s)
A dummy variable equal to 1 for firms founded to avoid
unemployment of founder(s) 0.652 1.000 0.476 0.000 1.000 1900
Founded for desire of founder(s) to run own
business
A dummy variable equal to 1 for firms founded for
desire of founder(s) to run his or her own business 0.815 1.000 0.389 0.000 1.000 1900 Founded to implement
an invention
A dummy variable equal to 1 for firms founded to
implement an invention 0.249 0.000 0.433 0.000 1.000 1900
Founded due to wealth ambitions of founders
A dummy variable equal to 1 for firms founded due to
wealth ambitions of founders 0.245 0.000 0.430 0.000 1.000 1900
Competitors / Industry
Larger Competitors The proportion of the firm's primary competitors that are larger than the firm. 0.695 0.750 0.323 0.000 1.000 1467 Log (Total Competitors) The natural log of the total number of serious
competitors of the firm. 1.810 1.792 1.026 0.000 8.517 1634
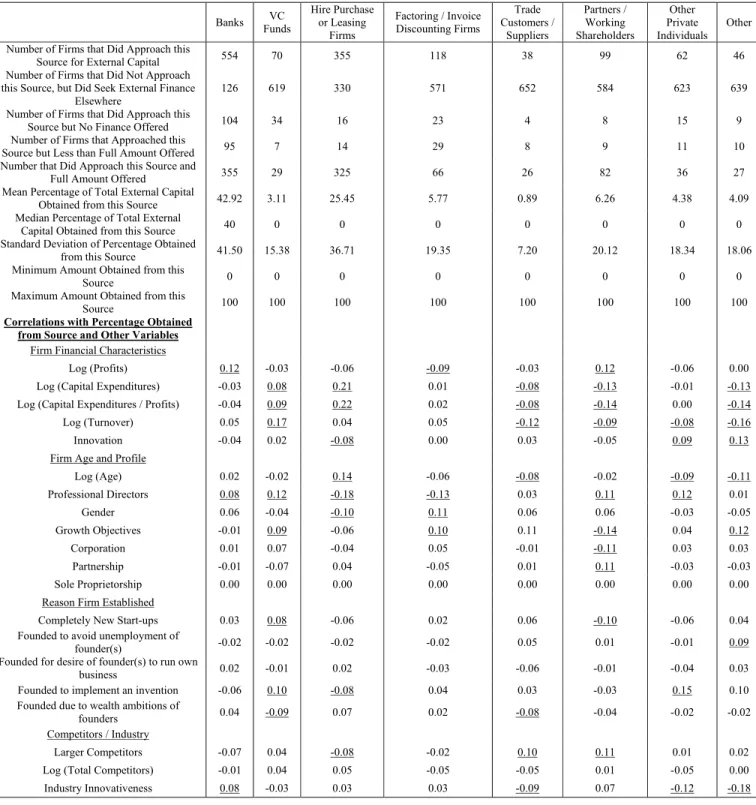
Industry Innovativeness The percentage of the firm's sales for which products or services were unchanged or only marginally changed in the last 3 years.
Table 2. Summary Statistics and Correlations for Specific Sources of External Capital
This table presents summary statistics and correlation coefficients for each specific source of external capital (banks, venture capital (VC) funds, hire purchase or leasing firms, factoring / invoice discounting firms, trade customers / suppliers, partners / working shareholders, other private individuals and other). The number of firms that did and did not approach the source is indicated, followed by the rejection and success rates among those firms that did approach the source. The statistics for the mean, median, standard deviation and minimum and maximum percentage of capital obtained from the each source is indicated. Correlations with various variables for the characteristics of the businesses are presented; correlations significant at the 5% level are highlighted in underline font.
Banks Funds VC Hire Purchase or Leasing Firms Factoring / Invoice Discounting Firms Trade Customers / Suppliers Partners / Working Shareholders Other Private Individuals Other Number of Firms that Did Approach this
Source for External Capital 554 70 355 118 38 99 62 46
Number of Firms that Did Not Approach this Source, but Did Seek External Finance
Elsewhere
126 619 330 571 652 584 623 639
Number of Firms that Did Approach this
Source but No Finance Offered 104 34 16 23 4 8 15 9
Number of Firms that Approached this
Source but Less than Full Amount Offered 95 7 14 29 8 9 11 10
Number that Did Approach this Source and
Full Amount Offered 355 29 325 66 26 82 36 27
Mean Percentage of Total External Capital
Obtained from this Source 42.92 3.11 25.45 5.77 0.89 6.26 4.38 4.09
Median Percentage of Total External
Capital Obtained from this Source 40 0 0 0 0 0 0 0
Standard Deviation of Percentage Obtained
from this Source 41.50 15.38 36.71 19.35 7.20 20.12 18.34 18.06
Minimum Amount Obtained from this
Source 0 0 0 0 0 0 0 0
Maximum Amount Obtained from this
Source 100 100 100 100 100 100 100 100
Correlations with Percentage Obtained
from Source and Other Variables
Firm Financial Characteristics
Log (Profits) 0.12 -0.03 -0.06 -0.09 -0.03 0.12 -0.06 0.00
Log (Capital Expenditures) -0.03 0.08 0.21 0.01 -0.08 -0.13 -0.01 -0.13
Log (Capital Expenditures / Profits) -0.04 0.09 0.22 0.02 -0.08 -0.14 0.00 -0.14
Log (Turnover) 0.05 0.17 0.04 0.05 -0.12 -0.09 -0.08 -0.16
Innovation -0.04 0.02 -0.08 0.00 0.03 -0.05 0.09 0.13
Firm Age and Profile
Log (Age) 0.02 -0.02 0.14 -0.06 -0.08 -0.02 -0.09 -0.11 Professional Directors 0.08 0.12 -0.18 -0.13 0.03 0.11 0.12 0.01 Gender 0.06 -0.04 -0.10 0.11 0.06 0.06 -0.03 -0.05 Growth Objectives -0.01 0.09 -0.06 0.10 0.11 -0.14 0.04 0.12 Corporation 0.01 0.07 -0.04 0.05 -0.01 -0.11 0.03 0.03 Partnership -0.01 -0.07 0.04 -0.05 0.01 0.11 -0.03 -0.03 Sole Proprietorship 0.00 0.00 0.00 0.00 0.00 0.00 0.00 0.00
Reason Firm Established
Completely New Start-ups 0.03 0.08 -0.06 0.02 0.06 -0.10 -0.06 0.04
Founded to avoid unemployment of
founder(s) -0.02 -0.02 -0.02 -0.02 0.05 0.01 -0.01 0.09
Founded for desire of founder(s) to run own
business 0.02 -0.01 0.02 -0.03 -0.06 -0.01 -0.04 0.03
Founded to implement an invention -0.06 0.10 -0.08 0.04 0.03 -0.03 0.15 0.10
Founded due to wealth ambitions of
founders 0.04 -0.09 0.07 0.02 -0.08 -0.04 -0.02 -0.02
Competitors / Industry
Larger Competitors -0.07 0.04 -0.08 -0.02 0.10 0.11 0.01 0.02
Log (Total Competitors) -0.01 0.04 0.05 -0.05 -0.05 0.01 -0.05 0.00
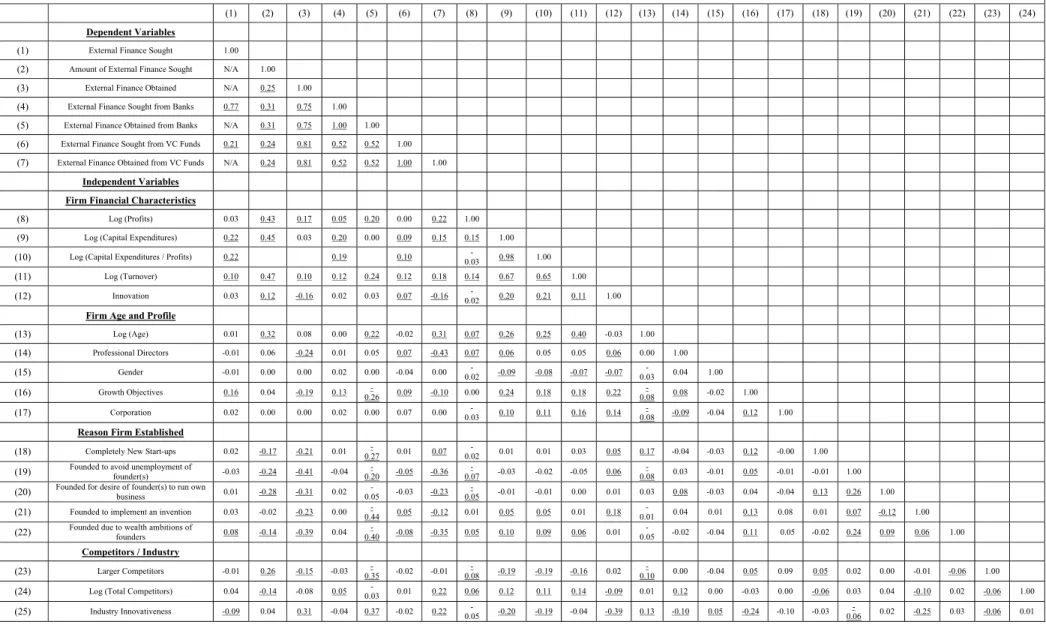
Table 3. Correlation Matrix
This table presents correlation coefficients across the variables that were defined in Table 1. Correlations that are statistically significant at the 5% level are highlighted in underline font. N/A refers to not applicable; for example, where the amount of external finance sought is left blank if no external finance is sought (so there is no correlation between variables (1) and (2).
(1) (2) (3) (4) (5) (6) (7) (8) (9) (10) (11) (12) (13) (14) (15) (16) (17) (18) (19) (20) (21) (22) (23) (24)
Dependent Variables
(1) External Finance Sought 1.00
(2) Amount of External Finance Sought N/A 1.00
(3) External Finance Obtained N/A 0.25 1.00
(4) External Finance Sought from Banks 0.77 0.31 0.75 1.00
(5) External Finance Obtained from Banks N/A 0.31 0.75 1.00 1.00
(6) External Finance Sought from VC Funds 0.21 0.24 0.81 0.52 0.52 1.00
(7) External Finance Obtained from VC Funds N/A 0.24 0.81 0.52 0.52 1.00 1.00
Independent Variables
Firm Financial Characteristics
(8) Log (Profits) 0.03 0.43 0.17 0.05 0.20 0.00 0.22 1.00
(9) Log (Capital Expenditures) 0.22 0.45 0.03 0.20 0.00 0.09 0.15 0.15 1.00
(10) Log (Capital Expenditures / Profits) 0.22 0.19 0.10 0.03 - 0.98 1.00
(11) Log (Turnover) 0.10 0.47 0.10 0.12 0.24 0.12 0.18 0.14 0.67 0.65 1.00
(12) Innovation 0.03 0.12 -0.16 0.02 0.03 0.07 -0.16 0.02 - 0.20 0.21 0.11 1.00
Firm Age and Profile
(13) Log (Age) 0.01 0.32 0.08 0.00 0.22 -0.02 0.31 0.07 0.26 0.25 0.40 -0.03 1.00
(14) Professional Directors -0.01 0.06 -0.24 0.01 0.05 0.07 -0.43 0.07 0.06 0.05 0.05 0.06 0.00 1.00
(15) Gender -0.01 0.00 0.00 0.02 0.00 -0.04 0.00 0.02 - -0.09 -0.08 -0.07 -0.07 0.03 - 0.04 1.00
(16) Growth Objectives 0.16 0.04 -0.19 0.13 0.26 - 0.09 -0.10 0.00 0.24 0.18 0.18 0.22 0.08 - 0.08 -0.02 1.00
(17) Corporation 0.02 0.00 0.00 0.02 0.00 0.07 0.00 0.03 - 0.10 0.11 0.16 0.14 0.08 - -0.09 -0.04 0.12 1.00
Reason Firm Established
(18) Completely New Start-ups 0.02 -0.17 -0.21 0.01 0.27 - 0.01 0.07 0.02 - 0.01 0.01 0.03 0.05 0.17 -0.04 -0.03 0.12 -0.00 1.00
(19) Founded to avoid unemployment of founder(s) -0.03 -0.24 -0.41 -0.04 0.20 - -0.05 -0.36 0.07 - -0.03 -0.02 -0.05 0.06 0.08 - 0.03 -0.01 0.05 -0.01 -0.01 1.00
(20) Founded for desire of founder(s) to run own business 0.01 -0.28 -0.31 0.02 0.05 - -0.03 -0.23 0.05 - -0.01 -0.01 0.00 0.01 0.03 0.08 -0.03 0.04 -0.04 0.13 0.26 1.00
(21) Founded to implement an invention 0.03 -0.02 -0.23 0.00 0.44 - 0.05 -0.12 0.01 0.05 0.05 0.01 0.18 0.01 - 0.04 0.01 0.13 0.08 0.01 0.07 -0.12 1.00
(22) Founded due to wealth ambitions of founders 0.08 -0.14 -0.39 0.04 0.40 - -0.08 -0.35 0.05 0.10 0.09 0.06 0.01 0.05 - -0.02 -0.04 0.11 0.05 -0.02 0.24 0.09 0.06 1.00
Competitors / Industry
(23) Larger Competitors -0.01 0.26 -0.15 -0.03 0.35 - -0.02 -0.01 0.08 - -0.19 -0.19 -0.16 0.02 0.10 - 0.00 -0.04 0.05 0.09 0.05 0.02 0.00 -0.01 -0.06 1.00
-16
Table 4. Comparison of Means and Medians for Profit Performance of Firms Seeking External Capital
This table presents comparison tests for the profit performance of businesses that did and did not seek external capital. Profit figures indicated are in '000 1997 pounds. For the businesses that did seek external capital, comparisons are also provided for the amounts sought relative to the capital expenditures. *, **, *** significant at the 10%, 5%, and 1% levels, respectively.
Number of Firms Average Median Minimum Maximum Standard Deviation
(1)
Profit performance of firms with capital expenditure but do not seek external
finance at all 621 249.60 86.00 -2704.00 10000.00 625.99 In te rn al Gr ow th Financ iers (2)
Profit performance of firms with capital expenditure which is greater than the
amount of external capital sought
205 294.82 152.00 -494.00 -494.00 482.12 Ex te rn al Gr ow th Financie rs (3)
Profit performance of firms with capital expenditure which is less than or equal to
the amount of external capital sought
232 241.33 58.50 -2139.00 8400.00 769.56
(4) Profit performance of firms with no capital
expenditure but do seek external finance 478 260.73 96.00 -2139.00 8400.00 627.16
N on-A sset Grow th Firm s (5)
Profit performance of firms with no capital expenditure and do not seek external
finance
108 83.32 29.00 -4.00 1500.00 193.68
Difference of Means and Medians Tests
Means Test Medians Test
(1) versus (2) -1.08 p <= 0.0003*** (1) versus (3) 0.15 p <= 0.004*** (1) versus (4) -0.29 p <= 0.435 (1) versus (5) 5.32*** p <= 8.35e-08*** (2) versus (3) -0.88 p <= 8.07e-07*** (2) versus (4) 0.77 p <= 0.008*** (2) versus (5) 5.50*** p <= 0.0003*** (3) versus (4) -0.33 p <= 0.006*** (3) versus (5) 2.93*** p <= 5.63e-12*** (4) versus (5) 5.19*** p <= 2.32e-08***
Table 2 reports the number of firms in our data that did seek external finance by the type of source of finance, as well as the percentage of all their external capital obtained from the source. Among the firms in our sample that did seek external finance, 554 approached banks, 355 approached leasing firms, 118 approached factoring / invoice discounting firms, 99 approached partners / working shareholders, 70 approached VC funds, 62 approached private individuals, and 38 approached trade customers / suppliers (and 46 approached other sources). It is of interest that outright rejection rates were highest among VC funds (49% rejection), and much higher than that for banks (19% outright rejection). The lowest rejection rate was among leasing firms (5%). Banks comprised the median and mean highest percentage of outside finance in terms of which type of source was approached and which type of source provided the finance. In fact, banks comprised the only type of source for which the median percentage of a firm’s total external capital was greater than 0% (for banks, the median percentage is 40%; see Table 2).
A number of the correlations in Table 2 provide insights into the different characteristics of the different types of investors. Banks are statistically more likely to finance profitable businesses, those with professional directors, and firms in industries that are less innovative. Banks provide debt finance, have very large portfolios, and typically use preset criteria in ascertaining whether the firm is a suitable risk for a loan.
The data indicate VC funds, by contrast, are more likely to finance businesses with higher capital expenditures and turnover, as well as those with a higher
proportion of professional directors, high growth objectives, new start-ups,7 and
businesses founded to implement an invention. These results are expected in the data. VC funds provide finance that has typically has some equity upside potential in the investees. VC managers have small portfolios (often no more than 5 investees per fund manager; see Kanniainen and Keuschingg, 2003, 2004; Cumming, 2004), and provide significant screening pre-investment and value-added post investment in their investee firms.
Hire purchase or leasing firms are more likely to finance older businesses with high capital expenditures, little innovation, a smaller proportion of professional directors, and firms started by males and not females, and firms in industries with fewer larger competitors. In short, leasing businesses act in ways that are somewhat similar to banks. The main difference is that the leasing business typically ties the financing provided to some other product provided to the firm.
Factor / invoice discounting firms provide cash advances on the basis of an
unpaid invoice, so that a firm may meet cash shortages.8 This type of financing
tends to be used by firms with fewer professional directors, firms started by females, as well as firms with high growth objectives and lower profit levels. The type of finance provided by an invoice discounting firm is such that they do not have concerns with information problems associated with the quality of the firm that obtains the finance, but rather, with the firm or customer with the unpaid invoice.
Trade customers / suppliers are more likely to finance younger firms with low capital expenditures, low turnover, firms with larger competitors and firms in industries with less innovation. This is intuitive, since there are proprietary rights associated with innovative industries and smaller innovative firms will be reluctant to seek capital from larger suppliers due to potential hold up problems with innovative ideas. For more traditional industries, however, suppliers are a natural source of capital for some developing firms securing a supply chain for developing their own products.
Partners / working shareholders are more likely to be a significant source of capital for more profitable businesses with professional directors, and firms with lower capital expenditures, low growth objectives, and larger competitors. This is also fairly intuitive for reasons similar to the intuition for the evidence for the trade customers / suppliers discussed immediately above. Significant agency problems may arise in partnerships that could inhibit growth of a firm. Finally, the category of “other private individuals” in Table 2 (also known as “Angel” investors) indicates similar patterns as with the VC funds. Angel investors finance young businesses with strong management and high quality directors, and particularly those firms which were started to implement an invention in highly innovative industries.
Table 3 provides additional correlation statistics across various variables that are used in the multivariate empirical analyses in the next section. The matrix gives further insights into the data, and provides guidance in terms of considering issues of collinearity in the regressions in section 5. Specific testable hypotheses are first outlined in section 4 before proceeding to the multivariate regressions which are presented in section 5.
Table 4 contrasts the profit performance of those firms that (1) have capital expenditure but do not seek external finance at all, with (2) have capital expenditures which are more than the amount of finance sought, (3) have capital expenditures which are less than the amount of capital sought, (4) have no
capital expenditure and seek external finance, and (5) have no capital expenditure and do not seek finance. Categories (1) and (2) comprise businesses that are ‘internal growth financers’, category (3) comprise businesses that are ‘external growth financers’, and categories (4) and (5) comprise ‘non-asset growth firms’. The data indicate that category (5) firms have lower average and median profits relative to any other category. The highest median profits are among businesses in category (2). The fact that median profits among category (2) is greater than median profits among category (3) suggests support for the pecking order hypothesis (Hypothesis 1a in section 3). However, median profits in category (4) are greater than that for category (3), which suggests other firm characteristics should be examined in a multivariate setting. Such multivariate tests are provided in the next section.
5. Multivariate Empirical Analyses
In this section, we provide unique multivariate tests of these theoretical propositions by first considering the firm’s decision to seek external financing in subsection 5.1. We then analyze the extent of finance sought in subsection 5.2, taking into account (in the spirit of Heckman, 1976, 1979) the first step non-randomness in the decision to seek outside capital. Subsection 5.3 considers the percentage of external capital obtained relative to the amount sought. Thereafter, we provide tests of differences across venture capital funds and banks in subsection 5.4. Section 6 discusses potential limitations and alternative explanations, and suggests avenues for future research. Concluding remarks follow in section 7.
5.1. Which Firms Seek External Finance?
In this subsection we identify factors that lead firms to seek external finance. We make use of logit regressions in which the left-hand-side variable is dummy variable equal to one if the firm sought external finance in the 1996-1997 period. A variety of explanatory variables are considered, as indicated in Table 5, and defined in Table 1.
Table 5. Logit Analyses of Which Businesses Seek External Finance
This table presents logit regression estimates of the probability that a business seeks external finance. The dependent variable is a binary variable equal to one if the business sought external finance in the past two years (from 1997). The independent variables are as defined in Table 1. The total population of firms comprised 1900 UK firms. Observations were skipped where there were missing values for the dependent or independent variables. The values presented are not the standard logit coefficients; rather, they are the marginal effects so that the economic significance is shown alongside the statistical significance. *, **, *** Significant difference for the sample of all other firms in the group at the 10%, 5% and 1% levels, respectively.
Model 1 Model 2 Model 3 Model 4 Model 5
Constant -0.156 -0.064 -0.536*** -0.241 -0.421
Firm Financial Characteristics
Log (Profits) 0.033 0.075
Log (Capital Expenditures) 0.052***
Log (Capital Expenditures / Profits) 0.050*** 0.071***
Log (Turnover) 0.035*** -0.035*
Innovation -0.049
Firm Age and Profile
Log (Age) -0.010 -0.037* -0.027 -0.032 -0.003
Professional Directors -0.007 -0.016 -0.040 -0.034
Gender -0.161*** -0.087 0.0142 0.119 0.035
Growth Objectives 0.102*** 0.100*** 0.090**
Corporation 0.012 -0.012
Reason Firm Established
Completely New Start-ups -0.016 0.002
Founded to avoid unemployment of founder(s) -0.070* -0.061
Founded for desire of founder(s) to run own business 0.029 0.031
Founded to implement an invention 0.024 0.017
Founded due to wealth ambitions of founders 0.045 0.071
Competitors / Industry
Larger Competitors 0.035 0.040
Log (Total Competitors) 0.0002 0.021
Industry Innovativeness -0.001 0.0003 0.0004 -0.001 Model Diagnostics Number of Observations 1418 929 795 718 600 Loglikelihood -953.697 -624.047 -508.796 -473.697 -390.340 Pseudo R2 0.005 0.011 0.061 0.043 0.056 Chi-Squared Statistic 9.684*** 14.461*** 66.632*** 42.946*** 46.231
Firms that do seek external finance have the following characteristics: they have higher turnover (Model 2) and higher capital expenditures (Model 3), and
higher capital expenditures / profits (Models 4 and 5).9 We do not observe a
direct relation between profits and applications for external finance (Models 1 and 5). The relation between capital expenditures / profits and external finance applications is also graphically illustrated in Figure 1. This indicates support for the traditional pecking order in which firms finance new projects internally before seeking external finance (see Hypothesis 1a outlined above in section 4). Firms applying for external finance also tend to be younger firms with a strong growth orientation (in support of Hypothesis 2a). On a ranking from 1-4 with 4 being the highest growth orientation for the 3 years subsequent to the application for external finance, an increase in the ranking by 1 point tends to
increase the probability of an application for external finance by approximately 10% (see Models 3 – 5). -9 -8 -7 -6 -5 -4 -3 -2 -1 0 1 2 3 4 5 6 7
External Finance Application No External Finance Application 0 10 20 30 40 50 60 70 80 90 100 Number of Companies
Log (Capital Expenditures / Profits) [scaled]
Figure 1. Applications for External Finance and Capital Expenditures / Profits
Consistent with Hypothesis 2a is the fact that there is some evidence that the motivation that led to the formation of the business affects the propensity to seek external finance. In particular, Model 3 in Table 5 indicates firms which were started to avoid unemployment of the founding entrepreneurs are approximately 7% less likely to seek external finance (but this evidence is not supported in the alternative specification in Model 5).
There is also evidence in Model 1 that firms founded by females are approximately 16% less likely to seek external finance; however, that evidence can be explained by the different characteristics exhibited by firms started by females, such as lower capital expenditures, lower turnover and lower rates of innovation (as indicated in Models 2-5 in Table 5, and the correlation coefficients reported in Table 3). In short, the evidence does not favor actual sex discrimination, but does suggest the presence of apparent sex discrimination at least in respect of the effect on the propensity that discrimination might have on the decision to seek external finance.
Finally, note that we do not observe any differences in industry or market factors that lead to applications for external finance (in contrast to the
predictions in Hypothesis 3). In the next subsections, we nevertheless consider this issue along with the other hypotheses about the amount of finance sought and obtained.
5.2. The Amount of External Finance Sought
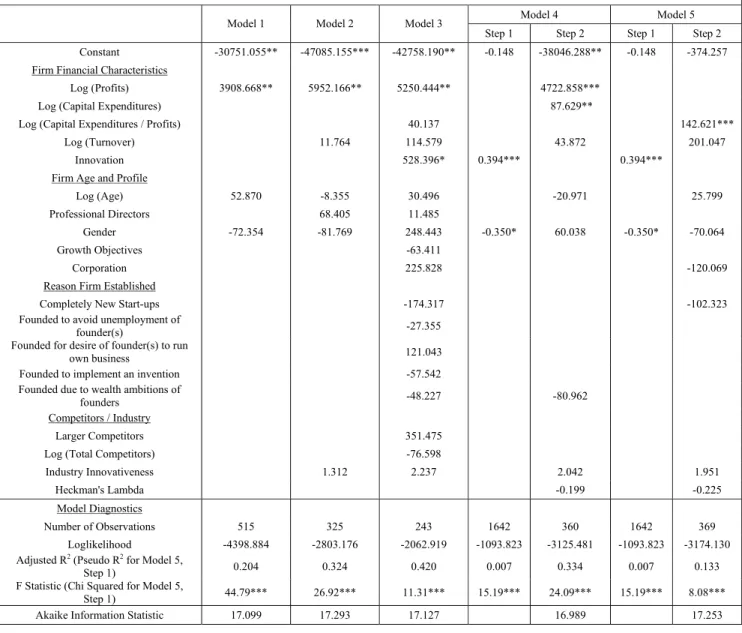
Table 6 presents regression evidence that indicates systematic characteristics drive the amount of external finance actually sought. Heckman corrected estimates are also presented which takes into account non-randomness in the decision of firms to actually seek external finance in the first place. For reasons of succinctness, we do not report other specifications for the Heckman corrected estimates (Models 4 and 5, Table 6). We selected a specification that minimized the overlap between the variables of the two steps in the regressions, because overlapping variables can cause bias (see, e.g., Puhani, 2000). Alternative specifications with minimal overlapping variables provided consistent results to that which is reported. Note that we also considered the robustness of our results to outlier observations (as identified by Cook’s distances and leverage plots). The results are robust. For instance, removing the outliers apparent in Figure 2, we do not find any material differences in the regression results reported in the Tables. Additional specifications are available upon request.
Table 6. Regression Analyses of Amount of External Finance Sought
This table presents OLS and Heckman corrected regression estimates of the amount of external finance sought. The dependent variable in Models (1) - (3) is the (strictly positive) amount of external finance sought by the business in the past two years (from 1997). Observations where no external finance was sought are skipped. Models (4) and (5) are a two-step Heckman corrected model, where the first step considers the probability that external finance was sought, and the second step accounts for the amount of external finance sought. The independent variables are as defined in Table 1. The total population of firms comprised 1900 UK firms. Observations were skipped where there were missing values for the independent variables. The values presented for step (1) of Models (4) and (5) are not the standard logit coefficients; rather, they are the marginal effects so that the economic significance is shown alongside the statistical significance. *, **, *** Significant difference for the sample of all other firms in the group at the 10%, 5% and 1% levels, respectively.
Model 4 Model 5
Model 1 Model 2 Model 3
Step 1 Step 2 Step 1 Step 2 Constant -30751.055** -47085.155*** -42758.190** -0.148 -38046.288** -0.148 -374.257
Firm Financial Characteristics
Log (Profits) 3908.668** 5952.166** 5250.444** 4722.858***
Log (Capital Expenditures) 87.629**
Log (Capital Expenditures / Profits) 40.137 142.621***
Log (Turnover) 11.764 114.579 43.872 201.047
Innovation 528.396* 0.394*** 0.394***
Firm Age and Profile
Log (Age) 52.870 -8.355 30.496 -20.971 25.799
Professional Directors 68.405 11.485
Gender -72.354 -81.769 248.443 -0.350* 60.038 -0.350* -70.064
Growth Objectives -63.411
Corporation 225.828 -120.069
Reason Firm Established
Completely New Start-ups -174.317 -102.323
Founded to avoid unemployment of
founder(s) -27.355
Founded for desire of founder(s) to run
own business 121.043
Founded to implement an invention -57.542
Founded due to wealth ambitions of
founders -48.227 -80.962
Competitors / Industry
Larger Competitors 351.475
Log (Total Competitors) -76.598
Industry Innovativeness 1.312 2.237 2.042 1.951
Heckman's Lambda -0.199 -0.225
Model Diagnostics
Number of Observations 515 325 243 1642 360 1642 369
Loglikelihood -4398.884 -2803.176 -2062.919 -1093.823 -3125.481 -1093.823 -3174.130
Adjusted R2 (Pseudo R2 for Model 5,
Step 1) 0.204 0.324 0.420 0.007 0.334 0.007 0.133
F Statistic (Chi Squared for Model 5,
Step 1) 44.79*** 26.92*** 11.31*** 15.19*** 24.09*** 15.19*** 8.08***
Figure 2. Amount of External Finance Sought and Capital Expenditures / Profits 0 5000 10000 15000 20000 25000 -9 -8 -7 -6 -5 -4 -3 -2 -1 0 1 2
Log (Capital Expenditures / Profits) [scaled]
Amo u n t of E xt ernal S o ugh t ( thou sa n ds o f po un ds )
Table 6 indicates firms with greater profits (Models 1-4), capital expenditures (Model 4), and capital expenditures / profits (Model 5) seek a greater amount of external finance, in support of Hypothesis 1a. Model 3 also indicates firms that recently developed a new innovation seek a greater amount of external finance (approximately £500,000 more capital), in support of Hypothesis 2a.
Models 4 and 5 used the innovation variable as a control in the first step in considering whether the firm in fact made an application for external finance. We exclude this variable in the second step to mitigate bias from the same included right-hand-side variables in steps 1 and 2 (Puhani, 2000). Alternative control variables for the first step regressions did not materially impact the interpretation of the second step regression.10 Controlling for this first step in Models 4 and 5, the data indicate capital expenditures and profits (Model 4), and capital expenditures / profits (Model 5) seek a greater amount of external finance. The capital expenditures / profits variable is the only statistically significant variable in Model 5 Step 2. These results strongly support the pecking order prediction (Hypothesis 1a). The economic significance is such that an increase in capital expenditures / profits by a factor of 10 increases the amount of external capital sought by approximately £142,000, whereas an increase in capital expenditures / profits by a factor of 100 increases the amount of external capital sought by £284,000.
The positive relation between capital expenditures / profits and the amount of external finance sought is also depicted graphically in the data in Figure 2. Note that we have expressed the right-hand-side variables in logs. A linear specification (either in terms of capital expenditures / profits or capital expenditures – profits) does not give rise to a statistically significant and positive relation with the amount of capital sought. The nonlinear specification models the relation as a concave specification, such that a firm’s application for external capital increases at a decreasing rate as capital expenditures / profits increases. The intuition for this non-linear relation is that at very high levels of capital expenditures, firms are not as likely to apply for an equal amount of external finance as this would reduce the probability that such amounts would be granted by the financier. This issue is further addressed in the next subsection.
5.3. The Percentage of External Finance Obtained
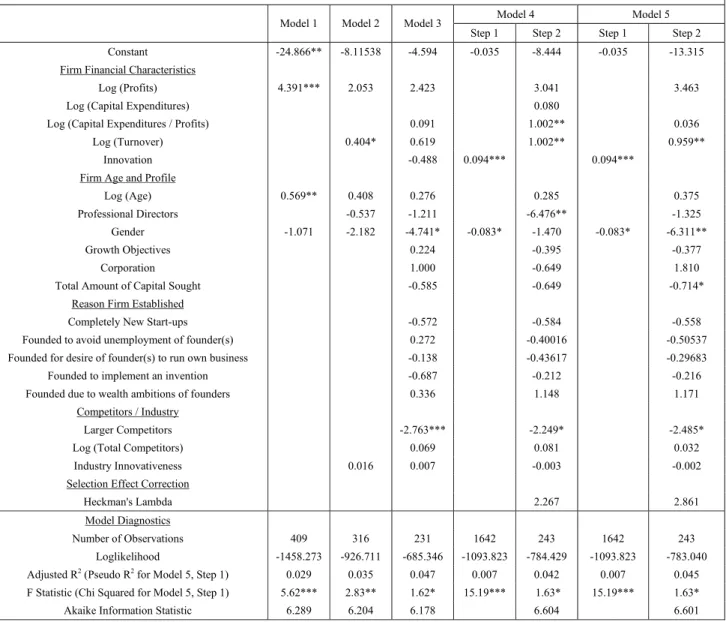
Table 7 presents evidence from OLS and Heckman-corrected regressions that indicate systematic characteristics drive the percentage of external finance obtained. The left-hand-side variable is transformed so that it is not bounded between 0 and 100%, in a standard way of modeling fractions (see, e.g., Bierens, 2003), so that the residuals and estimates have properties consistent with assumptions underlying OLS.
Table 7. Regression Analyses of Percentage of External Finance Obtained
This table presents OLS and Heckman corrected regression estimates of the percentage of external finance obtained. The dependent variable in Models (1) - (3) is ln(Y/(1-Y)), where Y is the percentage of external finance sought by the business in the past two years (from 1997). This transformation of the dependent variable enables OLS to be used without bias from being bounded below by zero or bounded above by 100%. Observations where no external finance was sought are skipped. Models (4) and (5) are a two-step Heckman corrected model, where the first step considers the probability that external finance was sought, and the second step accounts for ln(Y/(1-Y)) where Y is the percentage of external finance obtained. The independent variables are as defined in Table 1. The total population of firms comprised 1900 UK firms. Observations were skipped where there were missing values for the independent variables. The values presented for step (1) of Models (4) and (5) are not the standard logit coefficients; rather, they are the marginal effects so that the economic significance is shown alongside the statistical significance. *, **, *** Significant difference for the sample of all other firms in the group at the 10%, 5% and 1% levels, respectively.
Model 4 Model 5
Model 1 Model 2 Model 3
Step 1 Step 2 Step 1 Step 2
Constant -24.866** -8.11538 -4.594 -0.035 -8.444 -0.035 -13.315
Firm Financial Characteristics
Log (Profits) 4.391*** 2.053 2.423 3.041 3.463
Log (Capital Expenditures) 0.080
Log (Capital Expenditures / Profits) 0.091 1.002** 0.036
Log (Turnover) 0.404* 0.619 1.002** 0.959**
Innovation -0.488 0.094*** 0.094***
Firm Age and Profile
Log (Age) 0.569** 0.408 0.276 0.285 0.375
Professional Directors -0.537 -1.211 -6.476** -1.325
Gender -1.071 -2.182 -4.741* -0.083* -1.470 -0.083* -6.311**
Growth Objectives 0.224 -0.395 -0.377
Corporation 1.000 -0.649 1.810
Total Amount of Capital Sought -0.585 -0.649 -0.714*
Reason Firm Established
Completely New Start-ups -0.572 -0.584 -0.558
Founded to avoid unemployment of founder(s) 0.272 -0.40016 -0.50537
Founded for desire of founder(s) to run own business -0.138 -0.43617 -0.29683
Founded to implement an invention -0.687 -0.212 -0.216
Founded due to wealth ambitions of founders 0.336 1.148 1.171
Competitors / Industry
Larger Competitors -2.763*** -2.249* -2.485*
Log (Total Competitors) 0.069 0.081 0.032
Industry Innovativeness 0.016 0.007 -0.003 -0.002
Selection Effect Correction
Heckman's Lambda 2.267 2.861
Model Diagnostics
Number of Observations 409 316 231 1642 243 1642 243
Loglikelihood -1458.273 -926.711 -685.346 -1093.823 -784.429 -1093.823 -783.040 Adjusted R2 (Pseudo R2 for Model 5, Step 1) 0.029 0.035 0.047 0.007 0.042 0.007 0.045 F Statistic (Chi Squared for Model 5, Step 1) 5.62*** 2.83** 1.62* 15.19*** 1.63* 15.19*** 1.63*
Table 7 indicates some evidence of a comparatively smaller percentage of finance obtained, relative to the amount asked for, among firms started by females (Models 2 and 5). This is suggestive of actual discrimination; however, the statistical significance of this effect is not robust to the use of different control variables in Models 1, 2 and 4, suggesting this discrimination might be more apparent than actual, in that other factors associated with female firms give rise to a lower percentage of capital obtained.
The most robust result pertaining to the percentage of external finance obtained is that a comparatively larger percentage of external finance is obtained by firms with fewer larger competitors (in terms of asset size): see Models 3, 4 and 5. This is very strong support for Hypothesis 3 outlined above in section 4. Firms facing a 10% higher percentage of competitors that are larger direct competitors tend to face a 10% reduction in the percentage of finance that they are able to obtain from sources of capital. The statistical and economic significance of this evidence is robust to selection effects in applications for external capital across all potential sources reported in Models 4 and 5 (among other specifications not reported but available upon request).
In sum, although industry competition was not related to applications for external finance and the amount of capital sought (subsections 5.1 and 5.2 immediately above), industry competition is in fact of central importance in understanding the proportion of external finance that a firm is able to obtain. Hence, the data do support Hypothesis 3. The data do not, however, support Hypothesis 1a that more profitable firms are more likely to obtain a greater percentage of external finance sought.
5.4. Differences between VC Funds and Banks
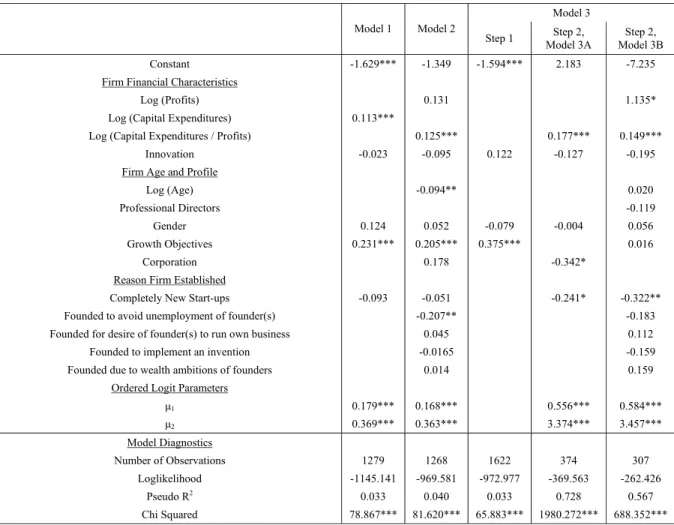
Table 8 Panels A and B explores further the issues addressed above by considering the differences between banks and VC funds. As discussed above in section 3 (Hypothesis 2b), among the approximately 38% of 1900 firms in our sample that did seek external finance in the 1996-1997 period considered, 554 approached banks, and only 70 approached VC funds (the other sources approached were identified in section 3 and Table 2 above). Outright rejection rates were highest among VC funds (49% rejection), and much higher than that for banks (19% outright rejection). Table 8 addresses in a multivariate context whether the factors leading to financing by these distinct sources were materially different.
Table 8. Regression Analyses of Specific Sources of Finance Panel A. Bank Finance
This table presents ordered logit and Heckman corrected ordered logit regression estimates of the extent of external finance obtained from different sources. The dependent variable in Models (1) and (2) is equal to 0 if the source