Lawrence Berkeley National Laboratory
Recent Work
Title
A three-stage optimization methodology for envelope design of passive house
considering energy demand, thermal comfort and cost
Permalink
https://escholarship.org/uc/item/89p9q571
Authors
Wang, Ran
Lu, Shilei
Feng, Wei
Publication Date
2020-02-01
DOI
10.1016/j.energy.2019.116723
Peer reviewed
eScholarship.org
Powered by the California Digital Library
A three-stage optimization methodology for envelope design of
passive house considering energy demand, thermal comfort and cost
Ran Wang
a,b, Shilei Lu
a,b,*, Wei Feng
baSchool of Environment Science and Engineering, Tianjin University, 92 Weijin Road, Tianjin, 300072, China bLawrence Berkeley National Laboratory, Berkeley, CA 94720, USA
a r t i c l e i n f o
Article history: Received 14 August 2019 Received in revised form 29 October 2019 Accepted 6 December 2019 Available online 7 December 2019 Keywords: Passive house Energy demand Thermal comfort Meta-model NSGA-II Cost-optimal analysis
a b s t r a c t
Due to reducing the reliance of buildings on fossil fuels, Passive House (PH) is receiving more and more attention. It is important that integrated optimization of passive performance by considering energy demand, cost and thermal comfort. This paper proposed a set three-stage multi-objective optimization method that combines redundancy analysis (RDA), Gradient Boosted Decision Trees (GBDT) and Non-dominated sorting genetic algorithm (NSGA-II) for PH design. The method has strong engineering applicability, by reducing the model complexity and improving efficiency. Among then, the GBDT algo-rithm wasfirst applied to the passive performance optimization of buildings, which is used to build meta-models of building performance. Compared with the commonly used meta-model, the proposed models demonstrate superior robustness with the standard deviation at 0.048. The optimization results show that the energy-saving rate is about 88.2% and the improvement of thermal comfort is about 37.8% as compared to the base-case building. The economic analysis, the payback period were used to integrate initial investment and operating costs, the minimum payback period and uncomfortable level of Pareto frontier solution are 0.48 years and 13.1%, respectively. This study provides the architects rich and valuable information about the effects of the parameters on the different building performance.
©2019 Elsevier Ltd. All rights reserved.
1. Introduction
Population growth, increased demand for indoor environment and global warming have led to a sharp increase in energy con-sumption for buildings heating and cooling, which accounts for 20% of global energy consumption [1]. Especially, the energy con-sumption by the residential building is increasing at approximately 30% annually worldwide [2]. Therefore, developing sustainable buildings has increasingly become a very important task, and Passive House (PH) has emerged as the preferred concept for ar-chitects and subject for researchers in most countries. PH are buildings that need 80%e90% less heating energy than conven-tional buildings to provide comfortable indoor conditions, while the incremental cost of their construction is only 5%e10% [3]. Many countries have introduced PH standards. For example, China has issued “Passive ultra-low energy green building technology guidelines”[4]. However, the standards merely set deterministic
results to evaluate the design without pre-directing the design. Therefore, it is almost impossible to use standards to fully exploit large design spaces and to guide decision-makers. In addition, en-gineers and technicians put more focus on active equipment and facilities but ignore the idea that PH is based on improving passive performance [5]. The passive performance is the base of sustainable development, especially for residential buildings [6].
Current research on PH buildings mainly focuses on perfor-mance assessment such as energy consumption and thermal comfort. Many studies have shown the superior performance of PH buildings. Based on the performance simulation, the heating en-ergy demand of the PH building is less than the requirement of the PH standard, and the annual cooling energy demand is also very low [7]. The measured data shows that the total energy con-sumption of PH buildings is reduced by about 50% compared with traditional buildings [8] and reduce heating energy consumption by about 65% and energy consumption by 35% compared with low-energy buildings. However, there are also studies that expose the negative side of PH buildings in the indoor thermal environment, especially during the transitional season. For example, based on in-use monitored data gathered in 21 months, a study evaluated the thermal comfort of a UK PH dwelling with vulnerable occupants [9]. *Corresponding author. School of Environment Science and Engineering, Tianjin
University, 92 Weijin Road, Tianjin, 300072, China. E-mail address:lvshilei@tju.edu.cn(S. Lu).
Contents lists available atScienceDirect
Energy
j o u r n a l h o m e p a g e :w w w . e l s e v i e r . c o m / l o c a t e / e n e r g y
https://doi.org/10.1016/j.energy.2019.116723 0360-5442/©2019 Elsevier Ltd. All rights reserved.
This research indicated that indoor overheating risk (IOR) can occur if the dwelling is not managed correctly, energy and carbon savings should not be at the expense of thermal comfort. In Europe, IOR in PH buildings has been recorded as more widespread compared to traditional buildings [10,11]. Moreover, in Australia, the high-performance buildings do not directly encourage passive surviv-ability and can even increase IOR compared to traditional buildings [12]. Even some studies have directly pointed out that improving building fabric (increased insulation and airtightness) increases IOR [13]. It should be mentioned that natural ventilation is very effec-tive in reducing energy consumption and improving the indoor thermal environment [14]. Opening the window for ventilation during the night or uncomfortable daytime can maintain indoor thermal comfort [15]. In short, thermal comfort issues should be valued in high-performance buildings such as PH buildings.
Many recent scientific studies performed building performance optimization whether it is single or multi-objective. There are numerous metrics involved in assessing building performance: 1) energy metrics [16e20], including annual heating, cooling, lighting,
and total building energy demand; 2) life cycle metrics [16], including life cycle costs, life cycle carbon emissions and life cycle energy consumption; 3) indoor thermal comfort metrics [17,18]. It should be mentioned that it is easy to transfer energy metrics into life cycle metrics with some simple additional information [21]. According to the research objects, these studies mainly focus on new residential buildings and renovated buildings. For example, a study developed a new methodology to optimize building life cycle cost, environmental impacts, and occupant satisfaction in the early design phase [17,22]. Another research proposed a set of optimi-zation methods for energy-renovating buildings that focus on en-ergy consumption, retrofit cost, and thermal discomfort hours [23]. However, the design priorities of PH and conventional buildings are different, in the related research of PH buildings, few studies involve integrated optimization of energy efficiency, thermal comfort, and economic benefit.
Computer-aided optimization is the earliest method used in building performance optimization (BPO). It is automatically opti-mized by coupling simulation software and optimization algo-rithms [24]. However, evolutionary algoalgo-rithms usually still need a large number of cost function evaluations before a satisfying result can be obtained [25]. Moreover, higher time costs of dynamic building performance simulation reduce the effectiveness of BPO and especially its diffusion in professional practice [26]. A survey study based on architects, mechanical engineers, and green
construction consultants demonstrated that slower optimization speed is the main reason for hindering the actual application of BPO [19]. More important, some optimization indicators cannot be directly obtained by running simulation software, generally, they need secondary processing. Therefore, traditional computer-aided algorithms are not suitable for multi-objective optimization lems. For this reason, an approximation of the optimization prob-lem is required. Among existing approximation approaches, the functional approximation approach (a.k.a. meta-model or surrogate model approximation) is the most used in BPO [27]. The meta-model constructs a functional relationship between multiple in-puts and multiple outin-puts, which improve efficiency by sacrificing precision [28]. It should be mentioned that the meta-model is not equal to the agent model. The former is generally used for building performance optimization problems, while the latter generally appears in research related to human behavior and perception [29]. Seeking appropriate algorithms to build a high-precision meta-model is getting more and more research attention [30e33].
Several studies have employed a variety of algorithms to establish meta model, such as multiple linear regression [34e36], support
vector machines (SVM) [33] and artificial neural networks (ANN) [17,23,37,38]. These meta-models are generally combined with optimization algorithms such as genetic algorithms (GA). For example, Asadi et al. present a multi-objective optimization model using GA and ANN to quantitatively assess technology choices in a building retrofit project [23]. Gou et al. established a model to optimize the thermal comfort and energy demand of new resi-dential buildings, by using the Non-dominated Sorting Genetic Algorithm II (NSGA-II) coupled with the ANN [17]. Although the meta-model has been generally accepted and applied, proposing new algorithms to build a more robust and highly accurate meta-model is still the research focus. Especially for multi-objective optimization problems, the robustness of the meta-model is more important [39].
Based on the above analysis, a summary of the existing prob-lems and the corresponding innovations is as follows:
(1) From the optimization model:
CThe existing problems on PH buildings:Most research related to PH buildings focuses on performance assess-ments, some of which only raised the phenomenon of the indoor overheating risk in PH buildings, but did not propose solutions to solve the problem. In addition, PH standards have only constrained the range of energy
Nomenclature
Abbreviation
PH Passive house
EUI Annual energy use intensity [kWh/(m2a)]
HEUI Annual heating energy demand [kWh/(m2a)]
CEUI Annual cooling energy demand [kWh/(m2a)]
CTR Annual thermal comfort level [%]
DCTR Annual thermal discomfort level [%]
WWR Window to wall ratio[%]
SHGC Solar heat gain coefficient
ACH Air exchange times under the pressure difference of 50Pa [/hr]
WDH20 Wet-bulb degree hours 20[kKh]
DDH28 Dry-bulb degree hours 28[kKh]
NMBE The standard mean deviation
CVRMSE The coefficient of variation of root mean square error
PDF The probability density function
IOR Indoor overheating risk
BPO Building performance optimization
PBC Payback period [year]
SD The standard deviation
Method
LHS Latin hypercube sampling
RDA Redundancy analysis
SA Sensitivity analysis
PRCC Partial Rank Correlation Coefficient
SVM Support vector machine
ANN Artificial neural network
MLR Multiple linear regression
GBDT Gradient boosted decision tree
consumption and certain design parameters, but it is difficult to guarantee an optimal solution. In summary, there is still a lack of systematic optimization methods to guide the passive design of PH buildings in engineering applications.
CThe corresponding innovation:This paper establishes an optimization model for PH buildings. Different from previous research, the optimization model considers the effect of windowing for natural ventilation on the indoor thermal environment. The relationship between 20 pas-sive design parameters and two building properties including energy demand and thermal comfort was constructed and the optimization scheme was explored under the constraints of PH standards. Finally, an eco-nomic analysis of the Pareto frontier solution was carried out. The optimization framework produces more prac-tical and detailed design guidance.
(2) From the optimization method:
CThe existing problems on passive optimization: Exist-ing research generally uses meta-models coupled multi-objective optimization algorithm to improve optimiza-tion efficiency. Although the effectiveness of the meta-model has been proven in numerous architectural per-formance optimization studies, seek alternative algo-rithms suitable for all building performance to build robust and highly accurate meta-models is still the focus of current research.
CThe corresponding innovation:This paper proposes a three-stage optimization method (RDA-GBDT-NSGA) that simultaneously improves the optimization efficiency and
accuracy. The GBDT machine learning algorithm
(described in Section2.3.2) is used to establish
meta-models of building performance, which was first
applied to the building optimization. From the two as-pects of accuracy and robustness, its effectiveness is
verified by comparison with the commonly used algo-rithms including ANN and SVM.
2. Method
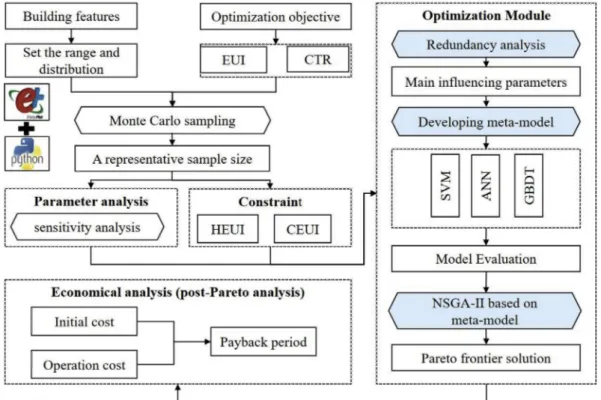
The optimization framework for PH buildings mainly includes three parts: constructing optimization model, establishing opti-mization method and post-Pareto analysis (Fig. 1). This section details the involved methods.
2.1. Optimization model 2.1.1. Optimization variables
The optimization variables involved are dominated by passive parameters, generally relate to design parameters of building components, such as the wall and roof (insulation, density, and specific heat), exterior windows (insulation and SHGC), building shape (shape coefficient and window-wall ratio), airtightness and building layout (orientation, etc.). The relationship between these parameters is more or less non-linear, so there will be interaction in the construction of variable space [40]. As shown inTable 1, 20 optimization variables are covered in this paper.
The boundaries and probability distribution of optimization variables will largely affect the optimization result. Considering that the research is oriented at the overall passivity of a building, it is assumed that the design variables are continuously and evenly distributed in order to fully cover the architectural feature space [41]. The determination of the boundaries of design variables can be divided into three cases. First, variables have been clearly defined in the PH standards [42], such as SHGC, the U-vale of en-velope components and airtightness. According to common prac-tices, the insulation layer and thefilling layer (usually concrete) of walls and roofs respectively affect the insulation level and thermal mass. The U-value is obtained by changing the insulation thickness,
and the density, as well as specific heat, are obtained by changing parameters of thefilling layer [17,43]. Second, WWR for different orientations determined according to the JGJ series of standards [44]. Third, the boundary is determined according to the variables occurring in the related literature though they may not be clearly defined in norm or standards. For example, the overhang depth and thefin depth of shading are set equal to the height of the external window [17]; The specific heat changes within default limits as per EnergyPlus modeling guidelines [33]; the change in the density of the envelope is based on the characteristics of conventional con-crete [45]. The solar absorptance of building coating was set ac-cording to the absorptive characteristic of surface materials of various colors. The building orientation is changed from 0to 360. The external windows are closed in the cooling season and the heating season. In the transition season, the indoor thermal envi-ronment can be regulated by natural ventilation. In this study, the “Wind and Stack with Open Area model”is used, which is a func-tion of wind speed and thermal stack effect. The model is designed to simplify ventilation calculations rather than using a flow network model for more detailed ventilation investigations. 2.1.2. Optimization objectives
2.1.2.1. Energy-related performance indicators. Building energy
de-mand was defined as the sum of the cooling and heating energy demand of allflats, calculated for the cooling (from Jun. 14 to Aug. 28) and heating periods (from Nov. 15 to Mar. 15) respectively. The energy demands for domestic hot water, electronic equipment, and artificial lighting were not considered as they were not expected to vary significantly throughout the periods of optimization [17]. Building energy demand, cooling and heating energy demand are represented by the annual energy use intensity (EUI), cooling en-ergy use intensity (CEUI) and heating enen-ergy use intensity (HEUI), respectively. Similar to many previous related studies [16,17,19], the HVAC system used in this study was the‘Ideal Loads Air System’, which means that the Coefficient of Performance (COP) of the system was assumed to be 1 and is used in situations where the intention is to study the building HVAC energy demand. Among then, humidification/dehumidification consumptions were considered and the fresh air change rate of the HVAC system was set as 1 per hour for every simulation case. The building perfor-mance is based on the hourly simulation of the whole year, and the time step is 6 times/h.
The formula is as follows:
HEUI¼Xii¼¼Nh1 EUhi=M (1)
CEUI¼Xii¼¼Nc1 EUci=M (2)
EUI¼HEUIþCEUI (3) EUi is hourly energy demand in kWh; Nh is annual heating hours; Nc is annual cooling hours; M (m2) is the conditioning area,1029.6 m2in this paper.
2.1.2.2. Thermal comfort indicator. The adaptive model is used to
evaluate the thermal comfort of free-running buildings, and the ASHRAE-55 adaptive model, which is based onfield data collected from various climate zones, is the most commonly used [46]. The ASHRAE-55 model uses outdoor monthly average temperatures to represent outdoor weather conditions. The indoor environment of the transition season in this paper can be evaluated using this model.
The neutral temperature calculation based on the ASAHE-55 model is shown in equation(4):
Tc¼0:31Trþ17:8 (4) Considering 80% acceptability, thermal comfort fluctuates within 3.5 C on either side of neutral temperature (7 C bandwidth).
Based on the adaptive model, the annual cumulative comfort ratio (CTR) is used as a thermal comfort measure. The calculation formula is as follows: CTR¼1 m Xk¼m k¼1 0 @XNp j¼1wfj, 1 Np 1 A m 2½0;1 (5) wfj¼ 1; 0;ifif Tlower TTupper T3Tloweror_Tupper (6) WhereTis the comfort indicator, which here is the room temper-ature.TupperandTlowerare the limits of the thermal comfort zone.NP represents the total hours. The number offlats ism,CTRis the Table 1
Input parameters and probability distribution.
category description unit No. Probability distributions boundary
Exterior wall U-value W/(m2K) X
1 Continuous uniformity [0.1,0.25]
density kg/m3 X
2 Continuous uniformity [500,2500]
specific heat J/(kg K) X3 Continuous uniformity [800,2500]
Roof U-value W/(m2K) X
4 Continuous uniformity [0.1,0.25]
density kg/m3
X5 Continuous uniformity [500,2500]
specific heat J/(kg K) X6 Continuous uniformity [800,2500]
Exterior window U-value W/(m2K) X
7 Continuous uniformity [0.8,1.5]
SHGC / X8 Continuous uniformity [0.16,0.45]
Air tightness ACH50 1/hr X9 Continuous uniformity [0.01,0.6]
Solar absorptance Exterior wall / X10 Continuous uniformity [0.1,0.9]
Roof / X11 Continuous uniformity [0.1,0.9]
Orientation Long axis X12 Continuous uniformity [0,360]
WWR east / X13 Continuous uniformity [0.2,0.45]
south / X14 Continuous uniformity [0.2,0.6]
west / X15 Continuous uniformity [0.2,0.45]
north / X16 Continuous uniformity [0.2,0.4]
Thefloor U-value W/(m2K) X
17 Continuous uniformity [0.15,0.35]
Window external shading Overhang height m X18 Continuous uniformity [0,0.5]
Overhang depth m X19 Continuous uniformity [0,2]
average of the thermal comfort of nineflats. 2.1.3. Objective functions
In this paper, the annual EUI and CTR were taken as optimization targets. In addition, according to the general requirements of the PH standard, the constraint condition is set as HEUI and CEUI.
Thefitness function is defined as Eq.
OF¼ f1¼fð!x;EUIÞmin f2¼fð!x;CTRÞmax (7) Subject to 8 < : x ! ¼!xrange HEUI15 CEUI3:5þ2WDH20þ2:2DDH28 (8)
Where, the !xrange contains 20 variables, all variables meet the distribution form and value range requirements inTable 1.WDH20 (Wet-bulb degree hours 20) is the cumulative value of the differ-ences between the wet-bulb temperature and the 20C when it is higher than 20C in one year (kKh). DDH28(Dry bulb degree hours 28) is the cumulative value of the difference between the dry-bulb temperature and the 28C temperature when it is higher than 28C in one year (kKh).
2.2. Sensitivity analysis
Sensitivity analysis (SA) plays an important role in performance analysis such as building energy, which can specifically extract key factors that affect each building performance [41,47]. Regression methods are the most commonly used global SA method because they are easy to understand, and the minimum sample size required is relatively small [41]. Many sensitivity indicators are derived based on regression methods, such as Standardized Regression Coefficients (SRC), Partial Correlation Coefficients (PCC), standardized rank regression coefficient (SRRC) and partial rank correlation coefficient (PRCC). Thefirst two apply to linear models, and their ranks apply to non-linear monotonic models. Compared to SRRC, PRCC suits the correlated input variables better because it can exclude the effects of correlations between input variables [48]. In thefield of building performance, some passive variables are interactive, and the relationship between variables and optimized performance goals is non-linear. Therefore, PRCC is used as the SA index.
2.3. Optimization method 2.3.1. Redundancy analysis
PRCC can show the relative order of importance of a set of input variables on output variables. There are no clear assessment criteria to measure absolute importance, but mainly to present the relative importance of variables. Therefore, this paper used redundant analysis (RDA) to compensate for the deficiencies of the PRCC in this respect. While giving the level of influence of the input variable on the output variable, the redundancy analysis can also give the significance of the effect at the same time.
RDA is a multivariate technique that examines how a set of response variables (Y) is related to a set of explanatory variables (X) by measuring the portion of the variance in the response variables that is explained by explanatory variables. In this paper, design parameters and building performances are explanatory variables (X) and response variables (Y), respectively. Intuitively, RDA is a canonical version of principal component analysis (PCA), and in general consists in deriving a series of multiple linear regressions of
the dependent variables Y on the independent variables X, followed by principal component analysis of the matrix offitted values. The main steps in an RDA, which are described in Makarenkov and Legendre [49], are as follows:
Multiple linear regression is computed for each Y, one by one, on all X. This step yields the fitted values Yb through the following formula:
b
Y¼XB¼X½X’XX’Y (9) The covariance matrix S of the matrix of fitted values bY is computed using the following formula:
S¼ ½1=ðn1ÞYb’Yb¼ ½1=ðn¼1ÞY’XðX’XÞX’X½X’X1X’Y (10) Eigenvalue and eigenvector decomposition of the covariance matrix S of Yb is carried out by solving the following matrix equation:
ðS
l
kIÞuk¼0 (11) Wherel
kis a canonical eigenvalue andukis the related canonical eigenvector. The matrix containing the normalized canonical ei-genvectorsukis called U.The ordination of objects (Y rows) independent variable space is obtained directly from the centered matrix Y, using the standard equation for computing principal components:
Ordðresponse variable Y spaceÞk¼Yuk (12) The ordination vectors defined by Eq.(4)are called‘‘site scores’’. Their variance is similar, although not necessarily equal to the corresponding eigenvalues.
Likewise, the ordination of objects in X space is obtained using the following equation:
Ordðexplanatory variable X spaceÞk¼YbukXBuk (13) The ordination vectors, called‘‘fitted site scores’’, are the linear combinations of the explanatory variables X. Their variance is equal to the corresponding eigenvalues.
2.3.2. Meta-model
2.3.2.1. Gradient Boosted Decision Trees (GBDT). More advanced
thinking called ensemble learning was introduced in the early 1990s [50]. The ensemble learning leverages the principle of model complementation to provide more accurate and stable results compared to base models [51]. Most review articles published in the recent past, suggest that ensemble algorithms are more effec-tive than single prediction algorithms [52,53]. Choosing an effeceffec-tive machine learning algorithm is critical to achieving good perfor-mance with the resulting meta-model. GBDT also called multiple additive regression trees (MART) or gradient boosting machine (GBM), is an integrated machine learning algorithm [54]. Due to the high robustness, the GBDT algorithm has been increasingly popular in the field of building energy management. Numerous studies have shown that the GBDT model exhibits the highest performance in the prediction of energy consumption by appliances in a low-energy house [55], building baseline low-energy consumption pre-dictions [56], and electricity load forecasting for utility energy management systems [57]. Therefore, this study builds meta-models for building performances based on GBDT algorithm. The detailed construction process of this algorithm is described in Ref. [58].
(1) Accuracy.
The error indicators specified in ASHRAE Guideline 14e2002 are introduced, that is the basic requirements for meta-models. When the standard mean deviation (NMBE) and the coefficient of varia-tion of root mean square error (CV-RMSE) is less than±5% and±15%, respectively, the model is accurate and reliable [59].
The calculation formula is as follows:
NMBE¼ Pi¼n i¼1ðyibyiÞ ny 100% (15) CVRMSE¼ ffiffiffiffiffiffiffiffiffiffiffiffiffiffiffiffiffiffiffiffiffiffiffiffiffiffiffiffiffiffiffiffiffiffi 1 n Pi¼n i¼1ðyibyiÞ2 q y 100% (16)
Where theyibyiyrepresents the actual value, the predicted value and the average actual values.
(2) Robustness
The robustness of meta-model refers to the ability to provide acceptable accuracy for diverse problems with varying levels of complexity and dimensionality [60]. This paper covers a variety of building performance indicators include energy and thermal comfort. These performance indicators vary substantially in complexity and in the shape of the output distribution (see Section 2.4). Thus, the meta-model technique must be robust to each per-formance indicator. As an indicator of robustness, previous works have used the standard deviations of the accuracies obtained from multiple problems [61,62]. R2is generally used as an accuracy index to calculate the standard deviation [60].
2.3.3. Optimization algorithm
The multi-objective function is solved by a multi-objective optimization algorithm. Multiple optimization functions are generally involved in the performance optimization of building, and the dimensions between different properties may be different, such as energy demand kWh/(m2a) and thermal comfort level (%/a) in this article. It is difficult to integrate into one optimization function. Therefore, the Pareto method is usually used to solve such problems [63]. The Pareto method can provide a non-dominated optimization solution that allows for solution selection based on preferences during subsequent decision making [64]. These algo-rithms can handle efficiently non-linear problems with disconti-nuities and many local minima [65]. Among them, genetic algorithms (GA) are widely and effectively applied to building performance optimization problems, especially non-dominated sorting genetic algorithms (NSGA-II) [66]. For example, a study developed objective functions of energy consumption, retrofit cost, and thermal discomfort hours, and studied the interaction between these conflicting objectives and assess their trade-off using the NSGA-II algorithm [23]. Another study used the NSGA-II algorithm to solve the optimization function with the annual energy con-sumption and the summer comfort degree as the optimization goals [67]. Therefore, NSGA-II is used in this paper to optimize the passive performance of buildings.
2.4. Economic assessment
An economic analysis of the Pareto frontier solution is necessary. In this paper, the initial investment, operating costs and payback period are used to evaluate the economic benefits of the optimized solution. The design parameters that cause great economic
differences due to various values are mainly the insulation thick-ness and the windows type. Therefore, they are the main parame-ters considered in the initial investment.
The main initial investment cost and the annual operating costs of HVAC are calculated as follows:
Ci¼cwallþcroof þcwindow (17)
Co¼cheatingþccooling (18)
PBC¼ ðCioCibÞ=ðCobCooÞ (19) Among them, Ciis the initial investment cost, CNY/m2. The price of the insulation material and the exterior window can be obtained from Green building material selection technology [68] and the China Building Materials Network [69], respectively. Co is the operating cost, including heating and cooling, CNY/m2. The urban heating network is used in the winter, and the local heating cost is 0.13RMB/kWh. The household air conditioner is used in the sum-mer, and the COP value is 2.8. The PBC is the payback period. TheCio andCibpresent the initial investment of optimized solution and the base building.CooandCobpresent the operating costs of optimized solution and the base building.
2.5. Construction of sample space
The input-output matrix is built by the coupling of Python programming language and EnergyPlus. As shown inFig. 2,firstly, the input matrix is constructed using Latin hypercube sampling (LHS) in Python and stored in a CSVfile. Then each set of the input variable is read from the CSVfile and written to the EnergyPlus software in turn by means of Python. Then use Python to read the CSVfile, and then write each set of the input variable to the IDFfile of EnergyPlus in turn. Finally, EnergyPlus performs building per-formance simulation and enters the next loop. In general, the entire program consists of two loops: python writes the input variables to EnergyPlus in turn, and the EnergyPlus software performs a full-year simulation in time steps.
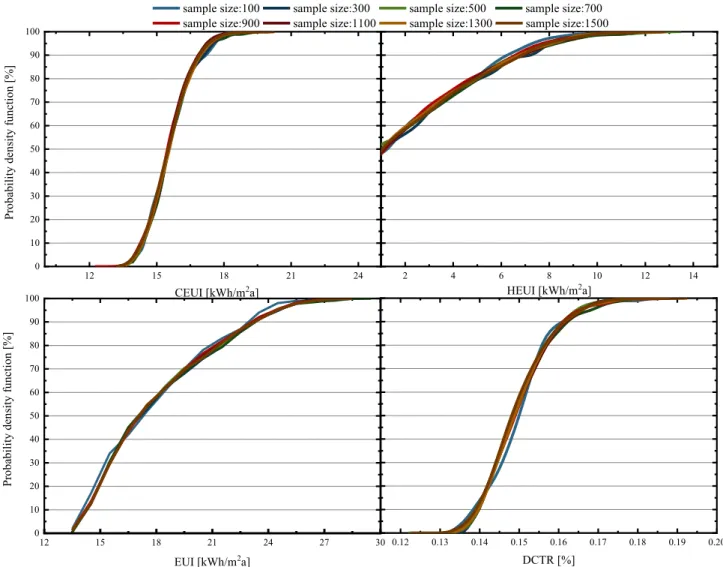
The sample size taken by the LHS during the uncertainty anal-ysis is generally at least ten times the number of input variables, but it is also related to the interaction complexity between input pa-rameters. In order to ensure that the selected sample size is sta-tistically representative, this paper compares the probability density function (PDF) of performance indicators for different sample sizes. It is generally believed that when the probability density function gradually becomes uniform as the sample size changes, the sample size can represent the overall building library. Independent sampling is performed to get the sample sets of var-iables in different sizes. According toFig. 3, when the sample size is greater than 300, the PDF curve does not vary substantially as the sample size changes, especially CEUI. This verifies the effectiveness of the LHS method in this research question. In the subsequent analysis, we need to ensure that the sample size is greater than 300.
3. The base-case building model
3.1. Setting the building model
Since the optimization of passive parameters exists in the early stage of building design, as in most of the related existing studies, the simulation data is used to expand the research database [16]. The entire building performance is simulated using EnergyPlus (Ver.9.0.1), which is a highly validated simulation engine widely used in building energy analysis [70]. In order to represent the
Fig. 2.The framework used to perform automatic EnergyPlus simulations.
characteristics of most Chinese residential buildings, this paper takes the popular slab-type building as an example, which has a rectangular footprint and there are about threeflats on each storey [71]. According to the database of Lianjia [72], the most common area offlats is about 100 m2in most of the newly built buildings. The rectangular footprint of the total building is 31.2 m11.0 m (length width) with three units on each story (Fig. 4). The building long axis is oriented East-West. The parameters of the envelope components are determined in accordance with JGJ res-idential building standards [44], which are shown inTable 2. It is assumed that three persons live in each unit, and their schedule of a workday is shown in Table 3. The internal thermal load from lighting, equipment, and people are assumed to be 4.3 W/m2on average.
Multi-story, especially the high-rise residential buildings, contain thousands of interior spaces, and it is not realistic to simulate a complete architectural model. In order to improve the computational efficiency, the common practice in the existing research is to select the bottom, standard and top stories to construct the building model according to the influence of the external meteorological environment [17]. Therefore, in order to reduce the number of thermal zones, this study uses a three-story building model in the subsequent process. In addition, since our research object is the average performance of the entire building, eachflat is used as a thermal zone in order to simplify the calcu-lation. This division method refers to some existing research [17] and the standard residential building model generated by the U.S.
DOE Building Energy Codes Program [73].
3.2. Climate characteristics
China’s policy prescribes the design features of traditional buildings in the cold climate to be mainly for thermal insulation in winter [45]. However, with global warming and the improvement in living standards, the cooling demand during summertime is gradually increasing in the cold climate and the cooling energy consumption cannot be ignored. Therefore, it is necessary for the region tofind the optimal passive design. This study selects the typical city of Tianjin as the case location. Tianjin is located in eastern China. HDD18 and CDD26 are 2743 and 92 respectively, and the annual average horizontal radiation intensity is 102 W/m2. As shown inFig. 5, the average daily temperature throughout the year is between10 and 30C. The heating season in the area lasts from November 15 to March 15 of the following year, and the cooling season is from June 14 to August 28. The weather data for simula-tion are derived from the Chinese Standard Weather Data pub-lished by the EnergyPlus website [74].
Fig. 4.Elevation and Isometric view of case building.
Table 2
Basic parameters of the case building.
Exterior wall Roof Exterior window Thefloor Interior wall U-value 0.7 0.45 2.5 0.65 1.5 WWR North: 0.3; South: 0.5; West: 0.35; East: 0.35
Form Layer height:2.9; Shape coefficient:0.299
Table 3
The setting of schedules.
4. Results
4.1. Multivariate performance analysis
PRCC, the sensitivity index, derived from MLR is applied to analyze the main factors affecting building performance. The larger the sample size, the more stable the indicators will be. However, there is no a priori exact rule for determining the adequate sample size for LHSePRCC index. A way to solve the problem is to sys-tematically increase the sample size and check if the sensitivity index used can consistently capture and rank a similar set of most important effects [75]. Therefore, the sensitivity analysis results under different samples are compared in this section. The input variables involved include not only thermo-physical parameters but also parameters that have potential effects on EUI and thermal comfort such as WWR. SA has the complementary role of ordering by importance, the strength, and relevance of the inputs in deter-mining the variation in the output. The SA results are determined and motivated by the thermo-physical characteristic, and also affected by the uncertainty of input variables [41]. For variables that are highly correlated in thermo-physical properties, it is also possible to have a relatively low order of influence when the parameter uncertainty (constrained by PH standards) is small.
For the EUI, PRCC and R2of the regression model for different sample sizes are exhibited inFig. 6andTable 4. For different sample sizes, the PRCCs are slightly different but the overall trend can be used as the basis for measuring important variables, and thefitting performance of the regression model is perfect with R2higher than 0.90. This indicates that the regression analysis model is robust. ACH (x9) is recognized as the most important contributor. It ac-counts for over 95% of the explainable output variation. The U-value of the external wall (x1) and roof (x4), as well as the WWR of the south (x14) are ranked after and contribute about 40%. The U-value of the external window (x7), the SHGC (x8) and WWR of the north (x16) have some influence with PRCC about 30%. The solar
absorptance of coating (x10and x11) also has some influence on PRCC, about 10%. The remaining factors are considered relatively less important with individual contributions less than 10%. In addition, the impact of variables on the annual cooling load and the annual heating load also are shown inFig. 6. The results of SA of EUI are different from both HEUI and CEUI, which indicates that the EUI is not only determined by the cooling or the heating energy demand.
Finally, obtaining the PRCC indices of CTR. The model achieved acceptablefitting performance with R2of 0.83. For CTR, the density (x5) and heat capacity (x6) of roof and SHGC (x8) are the most important factors with PRCC around 0.6. Followed by WWR (x13-x16) and the length of overhang (x19). The U-value of window (x7), ACH (x9), building orientation (x12) andfin depth (x20) have almost no impact on CTR.
For the cold climate zone, the rank and the magnitude of the influence of input variables are not consistent for EUI and CTR. Contrary to EUI, the effect of ACH (x9) on CTR is largely negligible. This is because natural ventilation which is used during the tran-sition season weakens the effect of airtightness on the indoor temperature. However, during the cooling and heating seasons, the external windows are closed, so the ACH will have a large impact on the load. EUI is more sensitive than CTR to the U-value of the wall,
Fig. 6.The Sensitivity index PRCC of building performances. Table 4
The determination coefficient (R2) of the regression model.
Sample size CEUI HEUI EUI CTR
100 0.930 0.852 0.952 0.863 300 0.916 0.864 0.802 0.836 500 0.913 0.861 0.935 0.841 700 0.907 0.846 0.923 0.830 900 0.918 0.853 0.931 0.831 1100 0.911 0.850 0.927 0.839 1300 0.913 0.851 0.925 0.826 1500 0.917 0.849 0.930 0.837
roof, and windows. The density and heat capacity of the roof has little effect on EUI, but it is an important factor in CTR. But there are some commonalities, for example, the density and heat capacity of the external wall, thefin depth (x20) and orientation (x12), the U-value of thefloor (x17) have little impact on EUI and CTR.
The sign of the PRCC indicates whether the relationship be-tween input variables and output variables is positive or negative. WWR (x13-x16) is positively correlated with energy-related per-formance but negatively with CTR. This means that smaller WWR is proposed as much as possible to reduce energy consumption and improve indoor comfort. Nevertheless, the premise is that the re-quirements of indoor natural lighting must be met. The solar ab-sorptances (x10and x11), overhang height (x18), ACH (x9), U-value of roof (x4) and the SHGC (x8) are positively correlated with EUI, and the length of the overhang (x19) is negatively correlated with EUI. For CTR, the result is just the reverse.
4.2. Redundancy analysis
The RDA method can quantify the explanation and significances the explanatory variables to the overall response variables including EUI and CTR.Table 5presents and explains and signifi -cance, other than x2, x20, x3, x12and x20.The effect of the remaining explanatory variables on the response variables is significant withp less than 0.05. Taking two response variables as a whole, the explanatory variables of the top seven variables are, from high to low, x9, x8, x5, x6, x14, x16, and x19, each explaining more than 1% of the response. In subsequent optimization analysis, variables with insignificant effects were removed to reduce the complexity of the optimization model.
4.3. Meta models
Based on the GBDT algorithm, meta-models of building perfor-mance were established. Trading off the calculation time and reli-ability, the overall sample size is set to 1100 and randomly divided into two parts, of which 1000 cases are used as training sets and 100 cases are used as test sets. Two commonly used algorithms, SVM and ANN, were used to verify the reliability of the GBDT method.
The setting of hyperparameters has important influences on model accuracy. The main parameters affecting the GBDT model
include the maximum depth of trees (MD), the number of trees (NT), the maximum of features (MF) and the learning rate (LR). The SVR model has two crucial parameters:cand
g
. Thecis the penalty factor, which is the tolerance for error. Theg
is the coefficient of the kernel function, which implicitly determines the distribution of the data after mapping to the new feature space [76]. For ANN, the activation and training functions are “tansig” and “traingd”, respectively. The number of hidden layer nodes and learning rates is their main parameters. The parameter settings of three algo-rithms after optimization are shown inTable 6.The linearfit between predicted and simulation results and their R2 are shown inFig. 7andTable 7, respectively. The comparison shows that thefitting performance of the GBDT model is superior to other models as a whole with the R2of EUI and CTR being 0.996 and 0.935, respectively.Table 8present the accuracy evaluation indices for the two objectives. Besides SVM, GBDT and ANN also meet the
requirements of ASHRAE Guideline 14e2002 with NMBE and
CVRMSE less than 5% and 15%, respectively. In particular, the GBDT model, NMBE of EUI and CTR are 2.45% and 1.78%, and CVRMSE of EUI and CTR are 3.36% and 2.36%.
In addition, the model robustness is also important, which represents the versatility for all building performance indicators. The standard deviation of R2 for EUI and CTR is used as the robustness indicator (shown in Fig. 8). It can be seen that the robustness of GBDT is the best with the standard deviation at 0.048, followed by ANN and SVM.
In summary, the GBDT model is superior in terms of robustness and fit and was chosen to construct the fitness function of the optimized model.
4.4. Multiply optimization and evaluation
The building performance model established by GBDT can participate in multi-objective optimization as adaptive functions in the genetic algorithm. The optimization objectives are to minimize the EUI and maximize CTR in this paper. In order to cope with the two opposite optimization goals of minimizing and maximizing, the minimization convention is generally followed. Therefore, the minimization of discomfort (DCTR¼1-CTR) is used instead of CTR. In terms of the NSGA-II algorithm, the roulette selection method and two-point cross are selected. Several other important optimi-zation settings, including the population size, number of maximum generations, generation gap, crossover and mutation probability are summarized inTable 9, according to a statistical summary of existing literature and an adaptive variation of optimization
con-figurations [77].
Fig. 9shows the Pareto frontier solution. The solution distribu-tion is very concentrated because this optimizadistribu-tion assumes that natural ventilation is maintained during the transition season, which alleviates the conflict between two optimization goals. The Table 5
Explains and significant.
Name Explains % pseudo-F P P (adj)
x9 42.1 799 0.002 0.04 x8 10.8 252 0.002 0.04 x5 10.1 301 0.002 0.04 x6 6.8 248 0.002 0.04 x14 7 330 0.002 0.04 x16 3 162 0.002 0.04 x19 2.8 173 0.002 0.04 x4 0.9 61.4 0.002 0.04 x1 0.8 54.4 0.002 0.04 x15 0.7 47.2 0.002 0.04 x13 0.5 33.9 0.002 0.04 x7 0.3 22.1 0.002 0.04 x11 0.3 19.9 0.002 0.04 x18 0.2 18 0.002 0.04 x10 0.2 17.2 0.002 0.04 x2 <0.1 2.1 0.128 0.64 x20 <0.1 1.6 0.188 0.752 x3 <0.1 1.4 0.236 0.752 x12 <0.1 0.8 0.432 0.864 x17 <0.1 0.6 0.61 0.864 Table 6
Parameter settings for meta-models.
Model Parameter DCTR EUI
GBDT subsample 0.8 0.8 MD 3 8 MF 9 7 NT 800 1300 LR 0.01 0.01 SVM c 0.1 1 g 1 0.1 ANN Iterations 10000 10000 Convergence error 0.00001 0.00001 LR 0.01 0.01
optimized EUI and DCTR bothfluctuate within a small range with a variation of 13.1e14.1 kWh/(m2a) and 13.1e13.3%, respectively. The CEUI and HEUI constraints of the PH standard are less than 16.73
and 15 kWh/(m2a), respectively. The corresponding CEUI of the Pareto frontier solution is approximately 13.4e14.6 kWh/(m2a), while the HEUI is substantially lower than 1 kWh/(m2a), which is obviously meeting constraints. In addition, the EUI and CTR of the base-case building are known to be 111.2 kWh/(m2a) and 63.0%, respectively. Therefore, the energy-saving rate of EUI is about 88.2% and the improvement rate of CTR is about 37.8%. In short, in the case of reasonable design and operation, the overall performance of PH buildings can be greatly improved.
In order to more intuitively display the distribution of design variables corresponding to the Pareto frontier solution, it is normalized as shown inFig. 10. Some variables such as x5, x6,and x19are concentrated in the upper limit of the constraint range, and its correlation with all optimization targets is negative. The larger the value, the better the optimization goal. Therefore, the value of these variables should be as large may be permissible under the circumstances. Some variables are all distributed at the lower boundary of the constraint range, and these variables are positively correlated with all variables (x7, x8, x9, x13, x14, x15, and x16). Therefore, the design should be as small as possible. There are also some variables that are distributed almost throughout the con-straints, such as the x1, x7, x10, x11and x18. These variables have Fig. 7.Thefitting curve between predicted and simulated results.
Table 7
The R2between the predicted and simulated results.
Objective GBDT SVM ANN
EUI 0.996 0.910 0.938
CTR 0.935 0.842 0.820
Table 8 Accuracy metrics.
Objectives Indictors [%] GBDT SVM ANN
EUI CVRMSE 3.36 5.96 4.53
NMBE 2.45 5.16 3.67
CTR CVRMSE 2.36 4.06 2.59
NMBE 1.78 3.3 2.00
Fig. 8.Robustness evaluation of meta-models.
Table 9
The setting of the NSGA-II algorithm.
Parameter Value
Population size 100
The number of maximum generation 500
Generation gap 0.5
Crossover probability 0.8
Mutation probability 0.6
different correlation directions for the two optimization goals, and the difference in the degree of relevance is not very large. Taking x1 as an example, the conventional approach is to make the U-value as small as possible, but in the multi-objective trade-off design, the optimization value is in the middle of the recommended value of PH standards. This shows that the integrated design of the building ontology is necessary.
4.5. Economic analysis
An economic analysis is performed in order to investigate the cost-effectiveness of the optimal solutions. Through the investiga-tion of 20 high-performance buildings in the climate, the common insulation materials are summarized inFig. 11. Rock wool and XPS are the most commonly used materials for walls and roofs, respectively. The market price of rock wool and XPS per square meter is 0.3 and 0.5 CNY/(mm thickness). According toTable 2, the U-value of the wall and roof of the base building are 0.45 and 0.7 W/ (m2K), and the cost of corresponding insulation materials is 7.2 and 23.7 CNY/m2 respectively. The external window of the basic building has a U-value of 2.5 W/(m2K) and the corresponding type
of external window is plastic steel (5 mmþ12 mm Airþ5 mm) with the market price being 310 CNY/m2. In addition, since the U-value and SHGC of windows corresponding to Pareto frontier solution are concentrated around 1 W/(m2K) and 0.18, it can be realized by adjusting the air layer thickness, so the window price can be considered the same with a market price of 483 CNY/m2[plastic
steel window (5 mm low-eþ13 mm Airþ5 mm þ 13 mm
Airþ5 mm)].
Calculated according to Eqs.(17) and (18), Ciand Coof the base building are 96.6 and 107.8 RMB/m2, respectively, and the corre-sponding cost of the Pareto frontier solution is shown inFig. 12. There is an exponential relationship between Ciand Co(R2¼0.73), and with the increase of Ci, Co tends to be stable. Further, the payback period is used to integrate Ci and Co. The shorter the payback period, the better the economic benefit, so it is used to the
final decision making on the Pareto frontier solution. As can be seen fromFig. 13, there is generally a positive correlation between the payback period and the DCTR. The optimal solution is present, with the payback period and DCTR of 0.48 years and 13.1%, respectively.
5. Conclusion
This paper proposes a multi-objective optimization method for PH design, and the cold climate zone is chosen as an example to construct the multi-objective optimization model. Annual energy demand and comfort level are used as optimization objectives, and the boundaries of design parameters, annual cooling, and annual heating energy demand are used as constraints. The proposed three-stage optimization design method can reduce the complexity of the model and improve optimization accuracy and efficiency.
The main conclusions are as follows:
1) Linear regression-based PRCC sensitivity indicators were used to analyze the correlation between design variables and building performance indicators. To increase reliability, repeated tests Fig. 10.Normalized distribution of optimized design variables.
were performed on the SA and results show that the PRCC at different tests is slightly different, but the overall trend can be used as a basis for measuring important variables. Thefitted MLR model achieved higher robustness with the CEUI, HEUI, EUI, and CTR, R2being 0.92, 0.85, 0.92 and 0.84, respectively. 2) The pre-RDA method is used for dimensionality reduction,
which can provide the importance ranking and significance of
design parameters to the overall optimization objectives. Compared to SA, this method reduces the influence of subjective judgment and is more suitable for multi-objective optimization problems. RDA shows that the impact of five variables (the density of wall, the fin depth, the specific heat of wall, the orientation, and the U-value of thefloor) is not significant with Fig. 12.The economic analysis of the Pareto frontier solution (Initial investment, operating costs and payback period).
p˃0.05. Therefore, these variables were excluded from the problem space for further optimization.
3) This study is thefirst one in which the GBDT algorithm has been implemented to study a PH building. It outperformed other commonly seen big data algorithms such as SVM and ANN in our experiment. Meta-model based on GBDT algorithm meets the requirements of ASHRAE with NMBE and CVRMSE of EUI and CTR are 2.45%, 3.36%, 1.78%, and 2.36%, respectively. An indicator is proposed to evaluate the robustness of the model. The meta-model based on GBDT withthe standard deviation at 0.048, is more robust than several existing advanced models.
4) By using the GBDT-based NSGA method, the optimized solutions of EUI and CTR are 13.1 kWh/(m2a) 14.1 kWh/(m2a) and 86.7e86.9%, respectively. The energy-saving rate of EUI is about 88.2% and the improvement rate of CTR is about 63.0% compared with the base-case building.
5) Implement an economic analysis of the Pareto frontier solution. There is an exponential relationship between Ci and Co (R2¼0.73), and with the increase of C
i, Cotends to be stable. The Ci and Co of the base building are 96.6 and 107.8 CNY/m2, respectively. Further, the payback period is used to integrate Ci and Co. The shorter the payback period, the better the economic benefit, so it is used to thefinal decision making on the Pareto frontier solution. There is generally a positive correlation be-tween the payback period and the DCTR. The optimal solution is present, with the payback period and DCTR of 0.48 years and 13.1%, respectively.
This study can provide a reference for the integrated design of Passive house buildings. It can be further extended to otherfields, such as building energy-saving renovation, early performance design of buildings of different types or located in different regions.
Declaration of competing interest
The authors declared that they have no conflicts of interest to this work.
We declare that we do not have any commercial or associative interest that represents a conflict of interest in connection with the work submitted.
Acknowledgment
This research has been supported by the “National Key R&D Program of China”(Grant No. 2016YFC0700100).
References
[1] Conti J, Holtberg P, Diefenderfer J, LaRose A, Turnure JT, Westfall L. Interna-tional energy outlook 2016 with projections to 2040. Washington, DC United States: USDOE Energy Information Administration (EIA); 2016.
[2] Allouhi A, El Fouih Y, Kousksou T, Jamil A, Zeraouli Y, Mourad Y. Energy consumption and efficiency in buildings: current status and future trends. J Clean Prod 2015;109:118e30.
[3] Schnieders J, Feist W, Rongen L. Passive Houses for different climate zones. Energy Build 2015;105:71e87.
[4] Liu Z, Liu Y, He B-J, Xu W, Jin G, Zhang X. Application and suitability analysis of the key technologies in nearly zero energy buildings in China. Renew Sustain Energy Rev 2019;101:329e45.
[5] MOF. The development status of passive houses in China and the constraints that affect development. China Passive House Network; 2019.http://www. passivehouse.org.cn/zk/gd/1062.html.
[6] Kishore KN, Rekha J. A bioclimatic approach to develop spatial zoning maps for comfort, passive heating and cooling strategies within a composite zone of India. Build Environ 2018;128:190e215.
[7] Wang Y, Kuckelkorn J, Zhao F-Y, Liu D, Kirschbaum A, Zhang J-L. Evaluation on classroom thermal comfort and energy performance of passive school build-ing by optimizbuild-ing HVAC control systems. Build Environ 2015;89:86e106.
[8] Schnieders J, Hermelink A. CEPHEUS results: measurements and occupants’
satisfaction provide evidence for Passive Houses being an option for
sustainable building. Energy Policy 2006;34(2):151e71.
[9] Fletcher M, Johnston D, Glew D, Parker J. An empirical evaluation of temporal overheating in an assisted living Passivhaus dwelling in the UK. Build Environ 2017;121:106e18.
[10] McLeod RS, Hopfe CJ, Kwan A. An investigation into future performance and overheating risks in Passivhaus dwellings. Build Environ 2013;70:189e209.
[11] Derbez M, Berthineau B, Cochet V, Pignon C, Riberon J, Wyart G, et al. A 3-year follow-up of indoor air quality and comfort in two energy-efficient houses. Build Environ 2014;82:288e99.
[12] Hatvani-Kovacs G, Belusko M, Pockett J, Boland J. Heat stress-resistant building design in the Australian context. Energy Build 2018;158:290e9.
[13] Mulville M, Stravoravdis S. The impact of regulations on overheating risk in dwellings. Build Res Inf 2016;44(5e6):520e34.
[14] Fosas D, Coley DA, Natarajan S, Herrera M, de Pando MF, Ramallo-Gonzalez A. Mitigation versus adaptation: does insulating dwellings increase overheating risk? Build Environ 2018;143:740e59.
[15] Kaklauskas A, Rute J, Zavadskas EK, Daniunas A, Pruskus V, Bivainis J, et al. Passive House model for quantitative and qualitative analyses and its intel-ligent system. Energy Build 2012;50:7e18.
[16] Harkouss F, Fardoun F, Biwole PH. Passive design optimization of low energy buildings in different climates. Energy 2018;165:591e613.
[17] Gou S, Nik VM, Scartezzini J-L, Zhao Q, Li Z. Passive design optimization of newly-built residential buildings in Shanghai for improving indoor thermal comfort while reducing building energy demand. Energy Build 2018;169: 484e506.
[18] Bre F, Fachinotti VD. A computational multi-objective optimization method to improve energy efficiency and thermal comfort in dwellings. Energy Build 2017;154:283e94.
[19] Chen X, Yang H. Integrated energy performance optimization of a passively designed high-rise residential building in different climatic zones of China. Appl Energy 2018;215:145e58.
[20] Chi DA, Moreno D, Navarro J. Correlating daylight availability metric with lighting, heating and cooling energy consumptions. Build Environ 2018;132: 170e80.
[21] Huang Y, Niu J-l, Chung T-m. Energy and carbon emission payback analysis for energy-efficient retrofitting in buildingsdoverhang shading option. Energy
Build 2012;44:94e103.
[22] Mostavi E, Asadi S, Boussaa D. Development of a new methodology to opti-mize building life cycle cost, environmental impacts, and occupant satisfac-tion. Energy 2017;121:606e15.
[23] Asadi E, da Silva MG, Antunes CH, Dias L, Glicksman L. Multi-objective opti-mization for building retrofit: a model using genetic algorithm and artificial neural network and an application. Energy Build 2014;81:444e56.
[24] Prada A, Gasparella A, Baggio P. On the performance of meta-models in building design optimization. Appl Energy 2018;225:814e26.
[25] Maarouf M, Sosa A, Galvan B, Greiner D, Winter G, Mendez M, et al. The role of artificial neural networks in evolutionary optimisation: a review. In: Advances in evolutionary and deterministic methods for design, optimization and control in engineering and sciences. Springer; 2015. p. 59e76.
[26] Attia S, Hamdy M, O’Brien W, Carlucci S. Assessing gaps and needs for inte-grating building performance optimization tools in net zero energy buildings design. Energy Build 2013;60:110e24.
[27] Chen X, Yang H. A multi-stage optimization of passively designed high-rise residential buildings in multiple building operation scenarios. Appl Energy 2017;206:541e57.
[28] Hester J, Gregory J, Kirchain R. Sequential early-design guidance for residen-tial single-family buildings using a probabilistic metamodel of energy con-sumption. Energy Build 2017;134:202e11.
[29] Azar E, Nikolopoulou C, Papadopoulos S. Integrating and optimizing metrics of sustainable building performance using human-focused agent-based modeling. Appl Energy 2016;183:926e37.
[30] Zhou CB, Wang ZQ, Chen QY, Jiang Y, Pei JJ. Design optimization andfield demonstration of natural ventilation for high-rise residential buildings. En-ergy Build 2014;82:457e65.
[31] Papadopoulos S, Azar E. Integrating building performance simulation in agent-based modeling using regression surrogate models: a novel human-in-the-loop energy modeling approach. Energy Build 2016;128:214e23.
[32] Eisenhower B, O’Neill Z, Narayanan S, Fonoberov VA, Mezic I. A methodology for meta-model based optimization in building energy models. Energy Build 2012;47:292e301.
[33] Chen X, Yang H. A multi-stage optimization of passively designed high-rise residential buildings in multiple building operation scenarios. Appl Energy 2017;206:541e57.
[34] Hygh JS, DeCarolis JF, Hill DB, Ranjithan SR. Multivariate regression as an energy assessment tool in early building design. Build Environ 2012;57: 165e75.
[35] Asadi S, Amiri SS, Mottahedi M. On the development of multi-linear regres-sion analysis to assess energy consumption in the early stages of building design. Energy Build 2014;85:246e55.
[36] Chou J-S, Bui D-KJE, Buildings. Modeling heating and cooling loads by artificial intelligence for energy-efficient building design 2014;82:437e46.
[37] Turhan C, Kazanasmaz T, Uygun IE, Ekmen KE, Akkurt GG. Comparative study of a building energy performance software (KEP-IYTE-ESS) and ANN-based building heat load estimation. Energy Build 2014;85:115e25.
analysis by multi-objective optimisation and artificial neural networks: a new framework for the robust assessment of cost-optimal energy retrofit, feasible for any building. Energy Build 2017;146:200e19.
[39] Kheiri F. A review on optimization methods applied in energy-efficient building geometry and envelope design. Renew Sustain Energy Rev 2018;92:897e920.
[40] Ferrara M, Sirombo E, Fabrizio E. Automated optimization for the integrated design process: the energy, thermal and visual comfort nexus. Energy Build 2018;168:413e27.
[41] Tian W. A review of sensitivity analysis methods in building energy analysis. Renew Sustain Energy Rev 2013;20:411e9.
[42] MOF. Technical guidelines for passive ultra-low-energy green buildings. http://wwwmohurdgovcn/wjfb/201511/t20151113_225589html. 2015. [43] Chen X, Huang J, Yang H, Peng J. Approaching low-energy high-rise building
by integrating passive architectural design with photovoltaic application. J Clean Prod 2019;220:313e30.
[44] Development MoHaU-R. JGJ26 Standard for energy saving design of residen-tial buildings in cold and severe cold climate zones. 2010.
[45] Construction Mo. Code for thermal design of civil buildings. China planning press; 1993.
[46] Carlucci S, Bai L, de Dear R, Yang L. Review of adaptive thermal comfort models in built environmental regulatory documents. Build Environ 2018;137: 73-89.
[47] Pannier M-L, Schalbart P, Peuportier B. Comprehensive assessment of sensi-tivity analysis methods for the identification of influential factors in building life cycle assessment. J Clean Prod 2018;199:466e80.
[48] Helton JC, Johnson JD, Sallaberry CJ, Storlie CB. Survey of sampling-based methods for uncertainty and sensitivity analysis. Reliab Eng Syst Saf 2006;91(10e11):1175e209.
[49] Makarenkov V, Legendre P. Une methode d’analyse canonique non lineaire et son applicationa des donnees biologiques. Math Sci Humaines Math Soc Sci
1999;147.
[50] Hansen LK, Salamon P. Neural network ensembles. IEEE Trans Pattern Anal Mach Intell 1990;(10):993e1001.
[51] Dietterich TG. Ensemble methods in machine learning. Conference Ensemble methods in machine learning. Springer, p. 1-15.
[52] Foucquier A, Robert S, Suard F, Stephan L, Jay A. State of the art in building modelling and energy performances prediction: a review. Renew Sustain Energy Rev 2013;23:272e88.
[53] Wang Z, Srinivasan RS. A review of artificial intelligence based building en-ergy use prediction: contrasting the capabilities of single and ensemble pre-diction models. Renew Sustain Energy Rev 2016;75.
[54] Wang R, Lu S, Li Q. Multi-criteria comprehensive study on predictive algo-rithm of hourly heating energy consumption for residential buildings. Sustain Cities Soc 2019;49:101623.
[55] Candanedo LM, Feldheim V, Deramaix D. Data driven prediction models of energy use of appliances in a low-energy house. Energy Build 2017;140. [56] Touzani S, Granderson J, Fernandes S. Gradient boosting machine for
modeling the energy consumption of commercial buildings. Energy Build 2018;158:1533e43.
[57] Ahmad T, Chen H. Nonlinear autoregressive and random forest approaches to
forecasting electricity load for utility energy management systems. Sustain Cities Soc 2019;45:460e73.
[58] Ma J, Cheng JC. Identification of the numerical patterns behind the leading counties in the US local green building markets using data mining. J Clean Prod 2017;151:406e18.
[59] Guideline A. Guideline 14-2002, measurement of energy and demand savings. American society of heating, ventilating. Atlanta, Georgia: Air Conditioning Engineers; 2002.
[60] Ostergard T, Jensen RL, Maagaard SE. A comparison of six metamodeling techniques applied to building performance simulations. Appl Energy 2018;211:89e103.
[61] Jin R, Chen W, Simpson TW. Comparative studies of metamodelling tech-niques under multiple modelling criteria. Struct Multidiscip Optim 2001;23(1):1e13.
[62] Kim B-S, Lee Y-B, Choi D-H. Comparison study on the accuracy of meta-modeling technique for non-convex functions. J Mech Sci Technol 2009;23(4): 1175e81.
[63] Delgarm N, Sajadi B, Delgarm S, Kowsary F. A novel approach for the simulation-based optimization of the buildings energy consumption using NSGA-II: case study in Iran. Energy Build 2016;127:552e60.
[64] Machairas V, Tsangrassoulis A, Axarli K. Algorithms for optimization of building design: a review. Renew Sustain Energy Rev 2014;31:101e12.
[65] Marzouk M, Azab S, Metawie M. BIM-based approach for optimizing life cycle costs of sustainable buildings. J Clean Prod 2018;188:217e26.
[66] Shi X, Tian Z, Chen W, Si B, Jin X. A review on building energy efficient design optimization rom the perspective of architects. Renew Sustain Energy Rev 2016;65:872e84.
[67] Gossard D, Lartigue B, Thellier F. Multi-objective optimization of a building envelope for thermal performance using genetic algorithms and artificial neural network. Energy Build 2013;67:253e60.
[68] Green building selection technology. 2015. [69] Network TCBM.http://jiancaihuangye88com/.
[70] Crawley DB, Lawrie LK, Winkelmann FC, Buhl WF, Huang YJ, Pedersen CO, et al. EnergyPlus: creating a new-generation building energy simulation program. Energy Build 2001;33(4):319e31.
[71] You W, Shen J, Ding W. Improving residential building arrangement design by assessing outdoor ventilation efficiency in different regional spaces. Architect Sci Rev 2018;61(4):202e14.
[72] Lianjia. Lianjia.http://tjfanglianjiacom/.
[73] Energy USDo. Building energy Codes program.https://wwwenergycodesgov/ development.
[74] The weather datafile of Tianjin.https://energyplusnet/weather-location/asia_ wmo_region_2/CHN//CHN_TianjinTianjin545270_CSWD.
[75] Marino S, Hogue IB, Ray CJ. A methodology for performing global uncertainty and sensitivity analysis in systems biology. J Theor Biol 2008;254(1):178e96.
[76] Wang R, Lu S, Li Q. Multi-criteria comprehensive study on predictive algo-rithm of hourly heating energy consumption for residential buildings. Sustain Cities Soc 2019:101623.
[77] Chen X, Yang H, Zhang W. Simulation-based approach to optimize passively designed buildings: a case study on a typical architectural form in hot and humid climates. Renew Sustain Energy Rev 2018;82:1712e25.