1
3K-SANCatalysing Self-Sustaining Sanitation Chains in Informal Settlements A Review and Analysis of the Situation pertaining to the Provision of
Sanitation to Low-Income Settlements in Kigali City (Rwanda): Diagnostic Report
This report was prepared by Aime Tsinda and Pamela Abbott Kigali, June 2102
Date of Publication: 2012
Place of Publication: Kigali, Rwanda
Published by: Institute of Policy Analysis and Research-Rwanda
Copyright©2012: Institute of Policy Analysis and Research-Rwanda
Authors: Aime Tsinda, Pamela Abbott
Institute of policy Analysis
and Research - Rwanda
2
ACRONYMS AND ABBREVIATIONS
BAD: African Development Bank
CHC: Community Health Centre
EDPRS: Economic Development and Poverty Reduction Strategy EIA: Environmental Impact Assessment
EWSA: Energy, Water and Sanitation Authority
EICV: Integrated Household Living Conditions Survey KCMP: Kigali Conceptual Master Plan
MDGs: Millennium Development Goals
MINAGRI: Ministry of Agriculture and Animal Resources MINALOC: Ministry of Local Government
MINECOFIN: Ministry of Finance and Economic Planning MINEDUC: Ministry of Education
MINELA: Ministry of Environment and Lands MINIJUST: Ministry of Justice
MININFRA: Ministry of Infrastructure MINIRENA: Ministry of Natural Resources MINISANTE: Ministry of Health
MINITERE: Ministry of Lands
NGO: Non-Government organizations
NISR: National Institute for Statistics for Rwanda PIGU: Projet d’Infrastructure et de Gestion Urbaine REMA: Rwanda Environmental Management Authority RURA: Rwanda Utilities Regulatory Agency
SPLASH: European Union Water Initiative Research Area Network UNDP: United Nations Development Programme
3
ACKNOWLEDGMENTS
This diagnostic report takes account of the comments made on a draft version at a stakeholders’ work-shop for the 3K-SAN /SPLASH Project held in Kigali in December 2011. It has been supported by the University of Surrey’s 3K-SAN team and was prepared as a part of 3K-SAN/SPLASH Project. We would like to acknowledge the consortium and the funding source, the Swiss Agency for Development and Coop-eration .We would like also to thank Kigali City officials and informal settlement residents who attended the workshop and provided us with relevant information and constructive comments. We also wish to thank our colleges at IPAR-Rwanda who have supported our work in producing this report. We alone remain responsible for the views in the report and they cannot necessarily be attributed to the funders or the Board of Directors of IPAR-Rwanda.
4
EXECUTIVE SUMMARY
This diagnostic report provides a comprehensive review of what is already known about sanitation in Kigali City. It is mainly based on a literature review, supplemented by a number of key informant inter-views undertaken to inform a proposed investigation of sanitation chains in Rwanda. It seeks to provide an overview of the major issues concerned with the provision of sustainable sanitation service chains in Kigali City with an emphasis on informal settlements.
Kigali City, like many other cities in developing countries, is experiencing a high rate of urbanisation. The population in Kigali City is growing faster than the provision of services, including sanitation, required to meet their needs. Much of the urban growth takes place in an unplanned way and 62.6 per cent of the population in Kigali City live in informal settlements. This lack of sanitation presents a major risk to public health. Diseases attributable to poor sanitation are increasing significantly with polluted water and poor sanitation being responsible for about 80 per cent of the disease burden on Rwandans (Lubaale and Musyoki, 2011).
Faced with this situation, some sensitisation initiatives are being made to stimulate demand. These initiatives include media campaigns and programmes targeted at communities (Participatory Hygiene and Sanitation Transformation Program, Cell Based Hygiene approach) and at schools (Hygiene et Assainissement en Milieu Scolaire), the creation of Community Health Workers and the creation of environmental clubs at schools and in every village. Decentralisation and community development programmes (umuganda, ubudehe, and imihigo) provide a way for people to increase their demands for improved sanitation.
However, demand is limited by access to finance and a reluctance to invest in rented property. On the supply side, there is little provision and there is a lack of qualified craftsmen, masons, artisans and adequate sanitary technology know-how. There are plans to build a sewage treatment plant but funding remains problematic. Once constructed, will the plant be able to take the sludge from the latrines? Access to pit emptying machines in informal settlements will be a challenge. The situation of sanitation in Kigali City would probably have been improved if legal, regulatory and institutional framework was effective. How-ever, there is duplication of responsibilities which results in lack of clarity.
5
CONTENTS
ACRONYMS AND ABBREVIATIONS 2
ACKNOWLEDGMENTS 3
EXECUTIVE SUMMARY 4
INTRODUCTION 9
1 BACKGROUND AND CONTEXT 10
1.1 Definitions of key words 10
1.1.1 Self-sustaining sanitation chains 10
1.1.2 Right to sanitation 10
1.1.3 Informal settlements 10
1.2 Description of the Project 11
1.3 Importance of the project 11
1.4 Sites selected for fieldwork 11
2 RWANDA AND KIGALI OVERVIEW 15
2.1 Country overview 15
2.2 Kigali description 16
2.3 Characteristics of Rwandan population 17
2.4 Urbanisation in Rwanda 18
2.1 Urban poverty and employment rates 19
2.1 Economic growth and transformation 21
3 LEGAL, REGULATION AND POLICY FRAMEWORKS FOR SANITATION 22
3.1 International conventions and protocols 22
3.1.1 Ramsar Convention on Wetlands 22
3.1.2 Convention on the Protection and Use of Transboundary Watercourses 22
3.1.3 EAC Protocol on Environment 22
3.2 General Framework 22
3.2.1 Millennium Development Goals 22
3.2.2 Rwanda Vision 2020 (2002-2020) 23
3.2.3 The Economic Development and Poverty Reduction Strategy (2008-2012) 23 3.3 Policy Framework relevant to sanitation 24 3.3.1 The National Decentralisation Policy 24
3.3.2 Environmental Policy 24
3.3.3 National Water and Sanitation Sector Policy 25
3.3.4 Health Sector Policy 25
3.3.5 Environmental Health Policy 26
3.3.6 National Water Resources Management Policy 26
6
3.3.8 National Human Settlement Policy 26
3.3.9 National Urban Housing Policy 26
3.3.10 The National Gender Policy 26
3.3.11 The Girls Education Policy and Strategic Plan 26
3.4 Programmes relevant to sanitation 27
3.4.1 Child Friendly Schools Infrastructure Standards and Guidelines 27 3.4.2 National Wetlands Conservation Program 27
3.4.3 National Investment Strategy 27
3.4.4 National Land Tenure Reform Programme 27
3.5 Legal and Regulatory Framework 28
3.5.1 The Rwandan Constitution 28
3.5.2 Organic LawNo 04/2005 of 08/04/2005on Environment Protection and Management 28 3.5.3 Law N° 16/2006 of 03/04/2006 determining the organisation, functioning and responsibilities of
REMA 29 3.5.4 Environmental Impact Assessment Regulations 30 3.5.5 By laws Nº 01/11 of 23/10/2011 of the City of Kigali concerning hygiene and sanitation 30 3.5.6 Law N°57/2008 of 10/09/2008 relating to the prohibition of manufacturing, importation, use
and sale of polythene bags in Rwanda 30
3.5.7 The Organic Law related to the Land Policy in Rwanda N°08/2005 of 14/07/2005 30 3.5.8 Ministerial order N°002/2008 of 01/4/2008 determining modalities of land registration 31
4 INSTITUTIONAL MANAGEMENT IN URBAN SANITATION IN RWANDA 32
5 MAIN STAKEHOLDERS IN SANITATION 36
6 MARKETS IN SANITATION 39
6.1 Role of public and private sector 39
6.2 Sanitation chains in market sanitation 39
6.3 Credit and savings 42
7 SANITATION SERVICES PROVISION AND PRACTICES 45
7.1 Sanitation provision 45
7.1 Sanitation practices in Kigali 45
7.1.1 Unpiped individual: pit latrines 45
7.1.2 Piped individual sanitation 45
7.1.3 Piped common sanitation 45
7.1.4 Open defecation 46
7.2 The challenges of the current sanitation practices in Kigali 46
7.2.1 Health 46
7.2.2 Aesthetics 46
7.2.3 Finances 46
7.2.4 Limited space 46
7
7.2.6 Erosion and its risks 47
7.2.7 Environment 47
8 POPULATION’S ATTITUDES AND PERCEPTIONS ON SANITATION 48
8.1 Good sanitation 48
8.1 Appropriate technologies 48
8.1 Perceived accessibility 49
9 LOCAL INITIATIVES AND ACTIVITIES FOR IMPROVING SANITATION 50
CONCLUDING REMARKS 54
REFERENCES 55
LIST OF FIGURES
Figure 1: Location of fieldwork sectors 12 Figure 2: Overview of Gatsata layout 12 Figure 3: Overview of Kimisagara layout 13 Figure 4: View of the intersection of Gatsata and Kimisagara and Nyabugogo Taxi Park 13 Figure 5: Location of Rwanda in relation to its neighbouring countries 15 Figure 6: The location of Rwanda (Kigali) and its physical relationship to Uganda
(Kampala) and Kenya (Kisumu) 16
Figure 7: A satellite image of Kigali City showing its topography 17 Figure 8: Population growth in Kigali City 18 Figure 9: Poverty by province (2000/01, 2005/6, 2012/11) in percentages 19 Figure 10: Extreme poverty in Rwanda 2000/1, 2005/6 and 2010/11 in percentages 19 Figure 11: Access to safe drinking water and improved sanitation (2000-2010/11)
and linear progression 24
Figure 12: Market sanitation chains in the City of Kigali 40 Figure 13: Small semi-collective treatment systems of various institutions 41 Figure 14: Access to credit by provinces and urban/rural in 2005/6 43 Figure 15: Access to credit by provinces and urban/rural in 2010/11 44 Figure 16: Manual for CHC facilitators, community health workers and district
environmental health officers 51
Figure 17: Main sources of information on environmental issues 52 Figure 18: Kandagira ukarabe approach 53
LIST OF TABLES
Table 1: Variation in service levels 14 Table 2: Population and economic activity rate changes 20 Table 3: Evolution of inequality in Rwanda 20 Table 4: Sanctions for Solid and Wastewater Management according to the Organic
Law on Environmental Protection 29 Table 5: Division of stakeholders’ responsibilities with regard to sanitation in Rwanda 32 Table 6: Role of relevant stakeholders for 3K-SAN Project 37
8
LIST OF BOXES
Box 1. Millennium Development Goals 23
Box 2: PIGU and WASH Project 36
Box 3. Core objectives of Financial Sector Development Program 42 Box 4. Access to financial services and products in Rwanda 43
Box 5. Umurenge SACCO 44
Box 6. GBEHPP Approach 50
Box 7. Traditional customs formalised into administrative systems 51
9
INTRODUCTION
This report examines what is already known about the provision of sanitation in poor urban informal set-tlements of Kigali City (Rwanda). It analyses the social, economic, legal and policy frameworks that govern the provision of sanitation and how they facilitate or hinder access to sanitation in low-income urban communities. It is a part of 3K-SAN/SPLASH Research Project and will develop and evaluate strategies for catalysing self-sustaining sanitation chains in low-income informal settlements in Kisumu (Kenya), Kam-pala (Uganda) and Kigali (Rwanda). Catalysing self-sustaining sanitation chains broadly refers to improved sanitation without continued external intervention. This is very important because, generally, improved sanitation has not always been sustainable, and relying on foreign aid is not a good idea.
In Rwanda, poverty remains one of the greatest challenges facing the people and their Government. Many households do have access to improved sanitation. According to EICV3, 83.3 per cent of the households in Kigali City have access to improved sanitation (National Institute of Statistics for Rwanda, 2012b). How-ever, the public health situation in Rwanda is greatly compromised because of inadequate sanitation and hygiene. It is argued that polluted water and poor sanitation is responsible for about 80% of the disease burden on Rwandans (Lubaale and Musyoki, 2011). The institutional framework for addressing urban san-itation and hygiene does not work for the poor and lack of infrastructure exacerbates the situation. In regards to this situation, some projects have been implemented, but not always successfully. That is why the 3K-SAN Project has decided to conduct this research because a catalysing self-sustaining sanitation chain is widely acknowledged to be an essential foundation for better health, welfare economic produc-tivity and environmental sustainability. The project fits also with the Government’s strategic priorities. The project will help by coming up with concrete proposals for how improved sanitation can be provided
in a sustainable way in informal urban areas of East Africa. The findings will be of direct benefit to infor-mal settlement dwellers, enable Governments to reach their targets for improved sanitation and health and recognising sanitation as a human right. Recognising sanitation as a human right is an important step in motivating improvement in sanitation while catalysing self-sustaining sanitation chains by improving empting, transport, treatment, disposal and re-use services in urban areas. This acts as an engine for any development efforts and constrains progress across all the MDGs. Why? Because self-sustaining sanitation chains has the potential to catalyse a broad range of development outcomes and supports the realisa-tion of other human rights, including the rights to educarealisa-tion, health, adequate housing, work, food and water (COHRE, 2008). Specifically, self-sustaining chains have the potential to catalyse development and improve the quality of life by ensuring the health of citizens and limiting the burden of treating prevent-able illness, increasing access to education for all, promoting economic growth especially in developing countries (COHRE, 2008).
The report is divided into nine sections describing different aspects of the social and political environ-ment that impact upon the urban sanitation sector. It begins by providing the background and context for the research (section 1) , followed by a brief, but broad overview of the socio-economic and physical conditions that exist in the Rwanda as a whole and a more detailed description of Kigali City (section 2). Section 3 provides a review of the legal, regulatory, and policy regulatory frameworks that impact directly or indirectly on the provision of sanitation. The fourth section describes the role of institutional man-agement in the provision of sanitation services. Section five analyses the main stakeholders. The report then describes the markets for sanitation (Section 6). The seventh section deals with sanitation services provision and practices. The eighth section describes the population’s attitudes and perceptions regarding sanitation. The last section deals with local initiatives and activities for improving sanitation (Section 9).
10
1 BACKGROUND AND CONTEXT
1.1 Definitions of key words
1.1.1 Self-sustaining sanitation chains
T
here are many definitions of sanitation, basic sanitation, improved sanitation and environmental sanitation, proposed by UN bodies, Water Supply and Sanitation Collaborative Council (WSSCC), Joint Monitoring Programme of UNICEF and the World Health Organization, amongst others. In Rwanda, sanitation is defined as the isolation/management of excreta from the environment, maintenance of personal, domestic and food hygiene, safe disposal of solid and liquid wastes, maintaining a safe drink-ing-water chain and vector control(Ministry of Infrastructure, 2010). This definition is different from the one developed by the Millennium Task Force. Sanitation is access to, and use of, excreta and wastewater facilities and services that ensure privacy and dignity, ensuring a clean and healthy living environment for all (COHRE, 2008). It is this definition developed by the Millennium Task Force that has been adopted in this report. The sanitation chain goes beyond this and it clearly refers to a series of services which include the collection, transport, treatment and disposal of human excreta, domestic wastewater and solid waste, and associated hygiene promotion’, to the extent demanded by the particular environmental conditions. It is therefore defined as methods for the safe and sustainable management of human excreta, including the col-lection, storage, treatment and disposal/re-use of faeces and urine (Evans and Tremolet, 2010).As regards to the term sustainable, it has multiple dimensions. The Sustainable Sanitation Alliance (SUSANA) suggests that while the main objective of a sanitation system is to protect and promote human health by providing a clean environment and breaking the cycle of disease, in order to be sustainable, a sanitation system has to be not only economically viable, socially acceptable, technically and institutionally appropriate, it should also protect the environment and the natural resource (SUSANA, 2008). Self-sustaining sanitation chains in the context of informal settlements are understood here as social, financial and technological systems that together provide affordable sanitation and to improve public and environmental health without continued external intervention. In terms of faecal sludge, the sanitation chain is seen as a series of the following services: waste emptying, waste transport, waste treatment and waste disposal/re-use. 1.1.2 Right to sanitation
From a human rights point of view, sanitation must be:
• Safe: This requires adequate hygiene promotion and education (COHRE, 2008);
• Physically accessible: It means that sanitation must be accessible within, or in the immediate vicinity, of each household, health or educational institution, public places and the workplace (COHRE, 2008);
• Affordable : This means that sanitation must be available at a price that everyone can afford with-out compromising their ability to acquire other basic goods and services, including food, housing, health services and education (COHRE, 2008);
• And culturally acceptable: Sanitation must be of a culturally acceptable quality because in many cultures, use of toilets is a highly sensitive subject and the construction, positioning and conditions for use will need to be taken into account in planning services (COHRE, 2008).
1.1.3 Informal settlements
The definition of informal settlements is context-specific. Various definitions have been proposed, but that suggested by the UN Habitat Programme is probably the most widely applicable. Informal settlements are defined as residential areas where a group of housing units has been constructed on land to which the
occu-11
pants have no legal claim, or which they occupy illegally; unplanned settlements and areas where housing is not in compliance with current planning and building regulations (unauthorized housing) (Hofmann et al., 2008). In Rwanda’s context, informal settlements (often referred to as utujagari) are settlements composed of poor communities and as such, these settlements are characterised by a dense proliferation of small, make-shift shelters built from diverse materials, lack of social infrastructure (potable water, sanitation facilities, roads), degradation of the local ecosystem and by severe social problems. In Kigali, 62.6 per cent of households live in informal settlements (National Institute of Statistics for Rwanda, 2012b).1.2 Description of the Project
The 3K-SAN Project is being funded by the EU-SPLASH Consortium under their programme for sustain-able sanitation research. The project aims to identify and evaluate strategies for catalysing self-sustaining sanitation chains in low-income informal settlements in African cities by addressing four major objectives:
• To map and analyse sanitation-related financial flows, stakeholder roles, regulatory frameworks and communication pathways.
• Engaging stakeholders to address social and economic barriers to sanitation provision.
• Building capacity for research in sanitation in East Africa, and for poverty reduction, through facil-itated sanitation development in low-income and vulnerable communities.
• Production and dissemination of appropriate guidance packages on stimulating demand for improved sustainable sanitation services in low-income informal settlements.
The project is being implemented in three cities that face major challenges in providing sustainable access to water and sanitation for their rapidly expanding populations: Kigali (Rwanda); Kisumu (Kenya); and Kampala (Uganda). The similarities and differences between the provision, management, and regulation of sanitation will be analysed using innovative social and legal research methods. Best practice guidelines for the implementation of sustainable sanitation will be produced as a major output from the project. 1.3 Importance of the project
• Through the participatory rapid appraisal, the 3K-SAN Project will work with poor communities in selected sites to identify barriers and develop acceptable and affordable solutions and promote demand;
• Through deliberative forums and focus groups, the 3K-SAN Project will bring the private sector and civil society to increase their interests in removing faecal sludge from household level and to generate affordable improved sanitation;
• Though expert interview with government officials and international experts, 3K-SAN Project will come up with regulation relevant to right to sanitation.
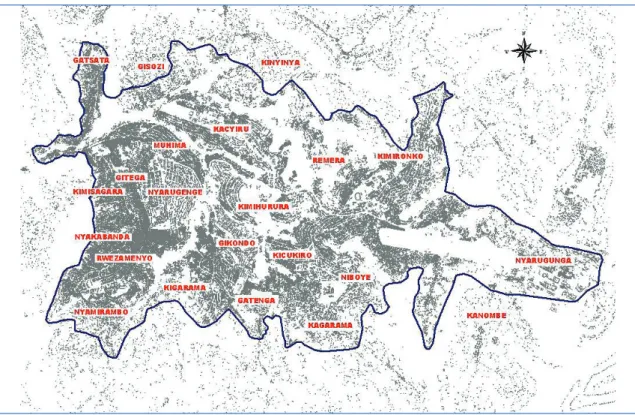
1.4 Sites selected for fieldwork
Two sectors have been selected for fieldwork in the City of Kigali. These two sites are Gatsata and Kim-isagara. The figure 1 shows the location of Gatsata and KimKim-isagara. Gatsata and Kimisagara are “informal settlements” situated at the western edge of Kigali. While Gatsata is situated at North-West, Kimisagara is situated at South-West (Figure 1).
12
Figure 1: Location of fieldwork sectors
Gatsata is defined by the hill line to the west; the eastern edges are defined by a valley floor that strad-dles a river (Figure 2). Running parallel to the valley floor is another main road towards Byumba1. Both sides of the main road in Gatsata are occupied by commercial, light industrial, pubs, churches and other non-residential premises. The valley floor itself is reserved for agricultural production.
Figure 2: Overview of Gatsata layout
Topographically, Kimisagara is similar to Gatsata. The western edge of Kimisagara is denoted by the top of a range of hills and the eastern edge is defined by the avenue of Kigali Mount (Figure 3). This road sepa-rates Kimisagara from the valley floor immediately to its east. The area between the avenue and the valley floor is taken up by shops, small industries, restaurants, churches, government offices etc. The area to the west of the avenue is used almost exclusively for housing, the local school and Kimisagara water works.
13
Figure 3: Overview of Kimisagara layout
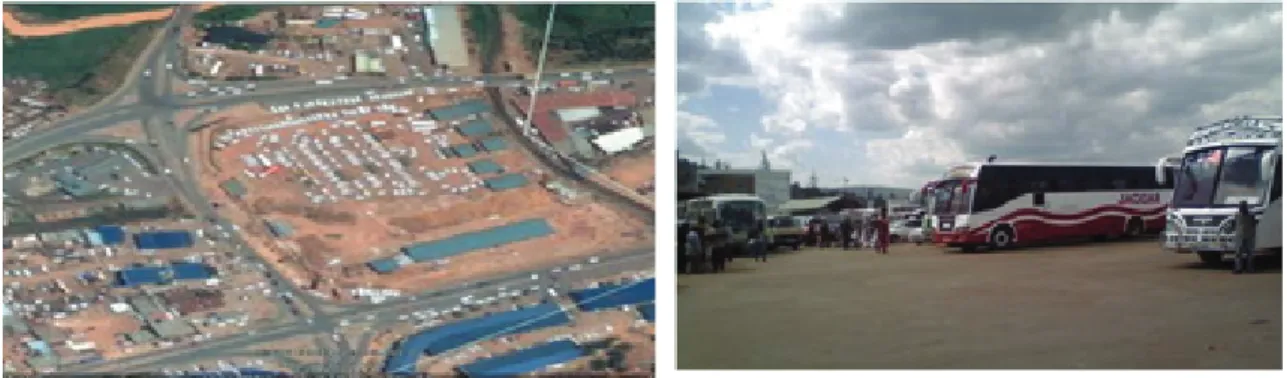
Although Kimisagara has a larger population than Gatsata, the area is significantly smaller. The north-ern and southnorth-ern bounds are separated by approximately 4.5 kilometres. Kimisagara and Gatsata are adjacent to each other and join at an intersection of main arterial roads (Figure 4). At this intersection, there is a market, business centre and a transport interchange. While Gatsata and Kimisagara are both sectors within the City of Kigali and share many social and economic characteristics, they fall within dif-ferent administrative districts of Kigali. Gatsata falls within the Gasabo District and Kimisagara falls in the Nyarugenge District.
Figure 4: View of the intersection of Gatsata and Kimisagara and Nyabugogo Taxi Park
The National Institute of Statistics District baseline study of 2008 reveals basic features of Gasabo and Nyarugenge, the districts in which the two sectors are located. The baseline surveys show that the two areas have a combined population of just over 56 000 (Kimisagara; 32587, Gatsata: 23 615) (National Institute of Statistics for Rwanda, 2008a, National Institute of Statistics for Rwanda, 2008b). While the baseline study is silent as to personal and household income levels, the poverty of the areas can be inferred from the low service levels and other data (Table 1). The two areas are very similar in terms of the basic demographics and service levels. With the exception of the mode of waste disposal, few of the differences indicated by the baseline studies are statistically significant. For example in Kimisagara, 15 per cent of households are headed by women. In Gatsata, 18 per cent are headed by women. In Kimisagara 67 per cent of the male-headed households rent their dwellings. In that area only 55 per cent of the female household heads rent. In Gatsata, the respective proportions are 55 per cent and 48 per cent (National Institute of Statistics for Rwanda, 2008a, National Institute of Statistics for Rwanda, 2008b).
In both areas, ownership of the dwellings could have been acquired in several ways including inheritance and purchase. When the characteristics of the owned dwellings that are headed by males are examined, we have found that in Kimisagara, 62 per cent of the properties were purchased. In Gatsata, 51 per cent of such properties were purchased. The physical construction of households in these two areas is similar. In Kimisagara, 56 per cent of households have brick walls. In Gatsata, the comparable figure is 57 per cent. In Kimisagara, 93 per cent of households have sheet metal roofing while in Gatsata 91 per cent of households have such roofing (National Institute of Statistics for Rwanda, 2008a, National Institute of
14
Statistics for Rwanda, 2008b). There is somewhat greater variation in service levels. The comparisons are tabulated in the Table 1.
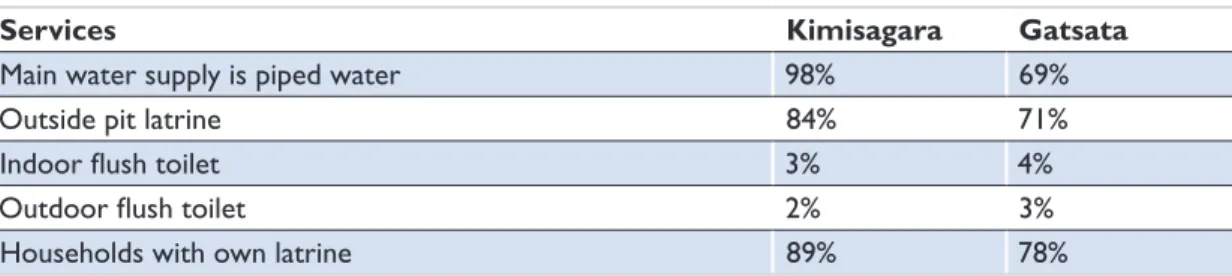
Table 1: Variation in service levels
Services Kimisagara Gatsata
Main water supply is piped water 98% 69%
Outside pit latrine 84% 71%
Indoor flush toilet 3% 4%
Outdoor flush toilet 2% 3%
Households with own latrine 89% 78%
Source: (National Institute of Statistics for Rwanda, 2008a, National Institute of Statistics for Rwanda, 2008b) The above figures indicate that Kimisagara tends to have better service levels than Gatsata. However the
asset levels in the two areas are very similar. In Kimisagara, 28 per cent of households own a television. In Gatsata, 30 per cent of households own a television. In Kimisagara, 3 per cent of households have a computer with internet access while in Gatsata; the comparable figure is 2 per cent. In both areas, 3 per cent of households have a car. Four per cent of Kimisagara households have a motor cycle. In Gatsata, only 2 per cent of households have a motor cycle. In Kimisagara, 57 per cent of male headed households have access to a bank account. In Gatsata a higher percentage of male headed households enjoy such access (67%). By contrast, only 47 per cent of female headed households in Kimisagara and 48 per cent of such households in Gatsata enjoy such access (National Institute of Statistics for Rwanda, 2008a, National Institute of Statistics for Rwanda, 2008b).
15
2 RWANDA AND KIGALI OVERVIEW
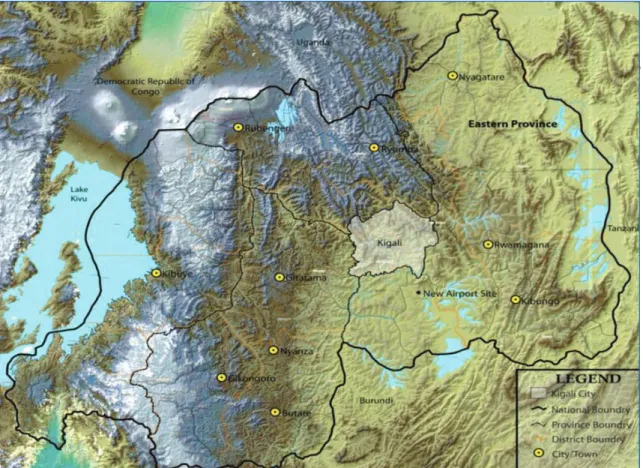
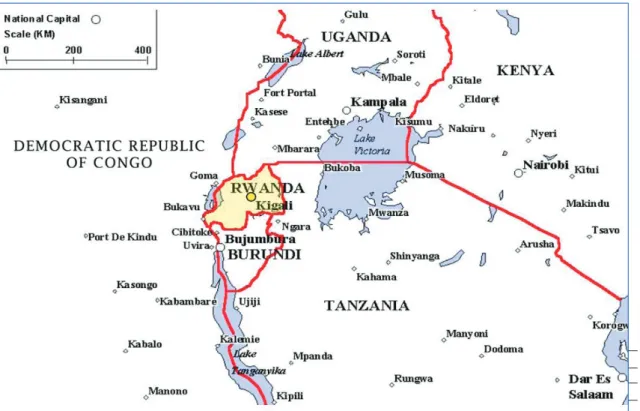
This section attempts to locate Rwanda geographically and economically in relation to the other 3K-SAN countries, namely Uganda and Kenya. They are all members of East Africa Community. Rwanda is a small, landlocked country in equatorial East Africa covering 26,338 km², bordering the Democratic Republic of Congo (DRC), Burundi, Uganda and Tanzania (Figure 5).
2.1 Country overview
Figure 5: Location of Rwanda in relation to its neighbouring countries
As the figure 5 shows, Rwanda has no physical border with Kenya, one country which this project is work-ing on. But, Kenya is not far from Rwanda especially, the City of Kisumu which one of the case-studies for this project (Figure 6).
16
Figure 6: The location of Rwanda (Kigali) and its physical relationship to Uganda (Kampala) and Kenya (Kisumu)
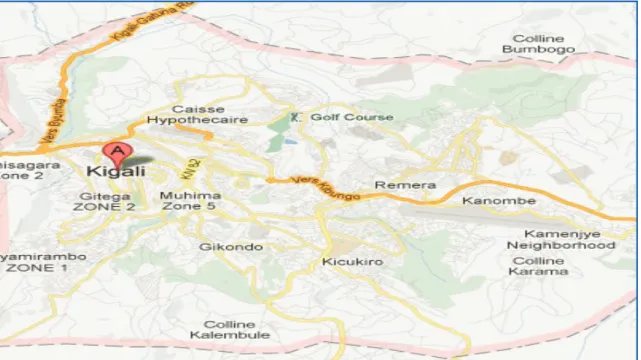
2.2 Kigali description
Kigali which is a focus of this report is a commercial city and capital of the Republic of Rwanda. Rwanda has approximately one million inhabitants. The City of Kigali is built on hills sprawling across ridges and wet valleys in between (Figure 7), with varying soil, vegetation and hydrological characteristics. Due to urban expansion, these wetlands are under increasing pressure from land use by industrial, commercial and residential development thus damaging the balance of the ecosystem services and increasing the like-lihood of flooding. The more affluent population tends to live on the higher ground while poorer people live close to or in the valley wetlands.
17
Figure 7: A satellite image of Kigali City showing its topography
Kigali’s landscape reflects the topography of Rwanda in general, situated on rolling hilly terrain. It exhibits two types of relief; gentle relief with depressions where wetlands are typically located and the more high relief due to tight rectilinear ridges oriented north-south and northwest to southeast. Such topography creates significant challenges such as soil erosion, drainage and the construction of infrastructure on steep slopes. These challenges may necessitate careful consideration for new development, including considerations of access and removal of waste, as well as expense of infrastructure development and construction. Because of its high altitude, its temperature and rainfall are more moderate than the surrounding hot and humid equatorial regions, even though the climate follows the same annual cycles. Average temperature on the central plateau is about 19-20° C and changes about 0.5° C with every 100 meter change in altitude and the average annual rainfall is between 1000 and 1100 mm.
2.3 Characteristics of Rwandan population
Rwanda has one of the fastest growing populations in Africa. According to the most recent estimates (2010/11) the population is 10.8 million (National Institute of Statistics for Rwanda, 2012b) compared to 7.5 million in 1992 (United Nations 1995). The population declined between 1994/5 due to the Genocide and the exile of thousands of people in the neighbouring countries but grew rapidly from 1995 with the population growth rate peaking at 10 per cent by the late 1990s. The increase was due to a high fertility rate and returning refugees including those who had fled during earlier periods of unrest. The rate of population increase has decline since 2000 and been stable since 2005 at just under three per cent. Population density is high across the country and has increased steadily and was 395 inhabitants per square kilometre in 2010 compared with 321 in 2002, 290 in 1992, 283 in 1991, and 191 in 1978. The population is essentially young, with 42.7 per cent of all Rwandans under the age of 15 (National Institute of Sta-tistics for Rwanda, 2012b). The EICV (2010/11) figures show that women constitute the majority of the population (52.6%), while men make up 47.4 per cent (National Institute of Statistics for Rwanda, 2012b). In Rwanda, there are a number of Christian dominations with the main one being Catholic. In the 1991 census, 90 per cent of the resident population identified themselves as Christian. This proportion has increased at the expense of those who profess no religion, who have declined from 6.8 per cent in 1991 to 3.6 per cent in 2002. The number of Muslim adherents has risen slightly, from 1.2 per cent of the
18
population in the 1991 census to 1.8 per cent in 2002 (National Institute of Statistics for Rwanda, 2012a). Nearly all Rwandans speak the same language, Kinyarwanda, which is the country’s national language. French and English are official languages with English having become the main language of education and government. Kiswahili, the third most common foreign language, is generally spoken in urban areas espe-cially in the City of Kigali.
2.4 Urbanisation in Rwanda
Urban development is a recent phenomenon starting at the beginning of the 20th century when the colonizers arrived in Rwanda. The absence of towns was partly due to scattered individual settlement across the whole country on the one hand and a decentralized economic system on the other. Before the colonial period, peddlers moved from one hill to another selling their goods (there was no established places for trade). The colonial administration did not encourage urban development in Rwanda because it was considered a country with very little economic interest. After independence, the governments opposed urban development and priority was given to the development of rural areas. However, since 2000, this situation changed and the government is now encouraging urbanization. However, rural-urban migration remains low with a higher proportion of the population living in rural areas in 2010/11 than in 2005/6 (National Institute of Statistics of Rwanda 2012).
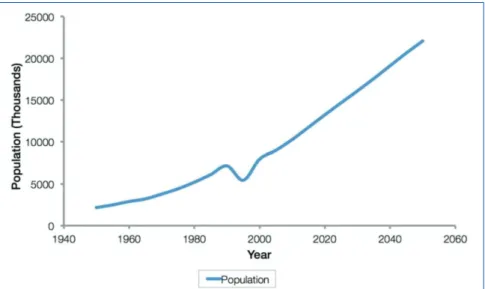
At independence in 1962, Kigali’s population was 6,000. Since then, the City of Kigali has experienced a high growth rate. According to EICV3 (2010/11), the urban population growth in Kigali has been expo-nential (National Institute of Statistics for Rwanda, 2012b) (Figure 8). This resulted in a concentration of the urban population in the capital estimated at 44 per cent of the total urban population in Rwanda. This situation confirms the phenomenon of urban monocephalism2 and highlights the imbalance between
the City of Kigali and other urban centres. Secondary centres still remain unable to offer a solid base for employment and services to their population because of the insufficiency of public and private investments.
Figure 8: Population growth in Kigali City
This growth in the City of Kigali has occurred, however, without adequate physical planning. Within the context of this rapid and unplanned urban growth, the most pressing sanitation problems with significant implications on public health, especially for the urban poor are: (i) inadequate and unsafe drinking water; (ii) poor drainage and sanitation conditions; (iii) solid waste disposal hazards; and (iv) construction in inappropriate and hazardous areas due to unplanned urban development.
2
It is a phenomenon where in a country there is both demographic and economic imbalance between the Capital and other urban centres. With our case, urban population and economic activities are concentrated mainly in Kigali City, the capital of Rwanda19
2.1 Urban poverty and employment ratesThe results from the Third Integrated Household Living Conditions Survey (EICV3) (NISR 20102) show a reduction in poverty at the national level of 12 percentage points between 2005/06 and 2010/11(National Institute of Statistics for Rwanda, 2012b) from 57 per cent to 45 per cent . Poverty is estimated to be 44.9 per cent nationally, with 22.1 per cent of the poor living in urban areas and 48.7 per cent of the poor living in rural areas. Since 2005/06, the poverty headcount has fallen by some four percentage points in the City of Kigali and by 10 percentage points or more in the other Provinces, with the fall highest by far being in the Northern Province (National Institute of Statistics for Rwanda, 2012b). Poverty is highest in all three EICV surveys in the Southern Province and lowest by far in the City of Kigali (Figure 9). Kigali has by far the lowest poverty rate, 16.8 per cent in 2010/11 but has witnessed a much smaller decline in poverty over the period of just four percentage points.
Figure 9: Poverty by province (2000/01, 2005/6, 2012/11) in percentages Source: (National Institute of Statistics for Rwanda, 2012b)
Figure 10: Extreme poverty in Rwanda 2000/1, 2005/6 and 2010/11 in percentages
Source: (National Institute of Statistics for Rwanda, 2012b)
20
Institute of Statistics for Rwanda, 2012b). This is again a substantial reduction over the recent five-year period following a modest fall in the first five-year period. The pattern of change by province is highlighted in figure 10. This shows large reductions in all provinces, all of which are statistically significant. Again, the greatest reduction is in the Northern Province. The Southern Province remains the area of the country with the highest levels of extreme poverty.
The urban poor are generally dependent on a monetized and informal economy unlike the vast majority of the rural poor who are dependent on subsistence agriculture. There is also a higher unemployment rate among poor people living in towns and they have poor living conditions in informal settlements (lack of basic socio-economic services such as water and sanitation, decent housing). However, 4.1 per cent of the population of Kigali are paid farm labourers and 19.1 per cent small scale farmers. Over 50 per cent of households (55.5%) grow crops and 34.5 per cent own livestock (National Institute of Statistics for Rwanda, 2012b).
Table 2: Population and economic activity rate changes
Survey Employed Unemployed Student Other inactive
EICV1 84.2% 0.8% 11.3% 3.6%
EICV2 84% 1.6% 10% 4.3%
EICV3 86.7% 1.4% 6.3% 5.5%
Source:(National Institute of Statistics for Rwanda, 2012b)
Official unemployment, it is very low as the vast majority of the adult population have to engage in income generating activities to survive. The officially unemployed are concentrated in the City of Kigali, tend to be female and live in households in the richer consumption quintiles (Abbott and Rwirahira, 2010). However, the percentage of the economically active population (employed and unemployed ) has declined since 2000/01 (Table 2) due to an increase in those still in education with the proportion having nearly doubled over the last 10 years. The increase in jobs has largely kept pace with the growth in the economically active population due mainly to young adults staying in education longer (National Institute of Statistics for Rwanda, 2012b). However, there are significant amounts of hidden unemployment and underemploy-ment and a growing recognition of the need to put more emphasis on job creation especially for those coming onto the labour market over the next 10 years.
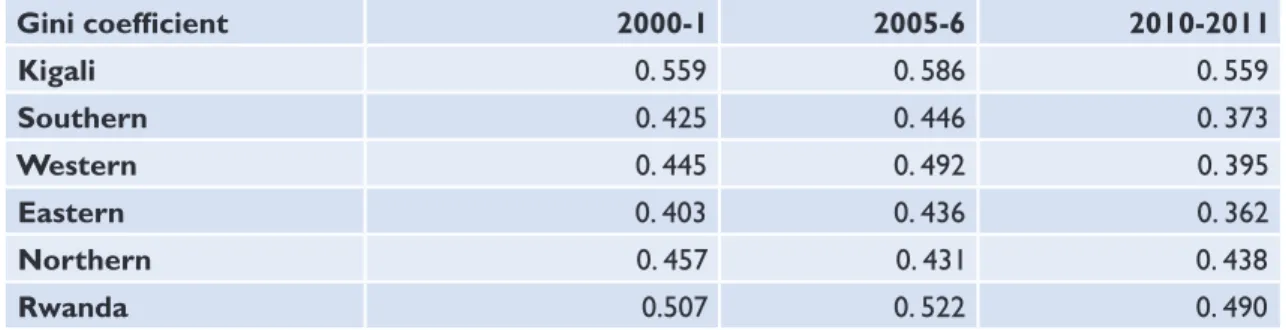
In short, Rwanda has had a remarkable record in translating its recent growth into poverty reduction across the country over the past five years. There has been not only poverty reduction but pro-poor growth with the Gini coefficient falling from 0.52 in 2005/06 to 0.49 in 2010/11, lower than its level in 2000/01. However, it is important to highlight that inequality remains high in the City of Kigali. Table 3 summarises the evolution of inequality in Rwanda as measured by the Gini coefficient.
Table 3: Evolution of inequality in Rwanda
Gini coefficient 2000-1 2005-6 2010-2011 Kigali 0. 559 0. 586 0. 559 Southern 0. 425 0. 446 0. 373 Western 0. 445 0. 492 0. 395 Eastern 0. 403 0. 436 0. 362 Northern 0. 457 0. 431 0. 438 Rwanda 0.507 0. 522 0. 490
21
2.1 Economic growth and transformationRwanda’s economy suffered heavily during the 1994 Genocide, with widespread loss of life and failure to maintain the infrastructure. This caused a large drop in GDP and destroyed the country’s ability to attract private and external investment. From the late 1990s, there has been sustained economic growth with GDP per capita increasing from US$ 248 in 1999 to US$ 520 in 2009 (Abbott and Rwirahira, 2010, Abbott et al., 2010) and a compounded annual growth rate of 17 per cent between 2001 and 2010 (Napier, 2010, Abbott et al., 2010). Much of this growth has been driven by the rapidly growing private sector. Over 75 per cent of GDP comes from services and the agricultural sector. In 2010 the service sector accounted for the largest share of Rwanda’s Gross Domestic Product (GDP) at 47 per cent, followed by the pri-mary sector at 32 per cent, the secondary sector at 15 per cent with the reminding six per cent from Financial Intermediation Services, Indirectly Measured (FISIM) and taxes (National Institute of Statistics for Rwanda, 2012a). Agricultural production rose by five per cent from 2009, to 2010 and this rise was due to the increase in production of food crops (5%) and export crops (14%), which recovered from a decrease of 15 per cent in 2009.
In 2010, industry value added grew by eight per cent, while mining exports registered a decrease for the second consecutive year-11 per cent in 2010, compared with 18 per cent in 2009 (National Institute of Statistics for Rwanda, 2012a). Manufacturing increased by nine per cent; electricity, gas, and water increased by 15 per cent; and construction grew by nine per cent. At the same time, services value added increased by 10 per cent in 2010 as a result of nine per cent growth in transport, storage, and communication; 8 per cent growth in wholesale and retail trade; and 24 per cent growth in finance and insurance, after a recovery from a decrease of nine per cent in 2009 (National Institute of Statistics for Rwanda, 2012a). However, Rwanda remains one of the poorest countries in the world and is heavily aid-dependent; about 44 per cent of revenues in 2010/11 were from Official Development Aid with other aid coming from New Donors and international NGOs (National Institute of Statistics for Rwanda, 2012b). The ODPs who contribute to the Water and Sanitation Sector are Belgium, African Development Bank, the European Community and the World Bank.
22
3 LEGAL, REGULATION AND POLICY FRAMEWORKS FOR SANITATION
The Legal, Regulation and Policy frameworks for sanitation reviews and analyses the existing legal, regulation and policy system relevant to the 3K-SAN Project and identifies the processes that are intended to facilitate sanitation delivery, as well as those that hinder progress. Rwanda being a signatory to different international conventions and protocols, it is important to review some of the relevant international conventions, protocols and treaties.
3.1 International conventions and protocols
Rwanda is a signatory to a number of conventions and protocols which are directly or indirectly relevant to the 3K-SAN Project.
3.1.1 Ramsar Convention on Wetlands
The Convention on Wetlands is an intergovernmental agreement that offers the framework for national action and international cooperation for the conservation and wise use of wetlands and their resources (Rwanda Environment Management Authority, 2011). This convention requires Governments to avoid pollution in wetlands.
3.1.2 Convention on the Protection and Use of Transboundary Watercourses
The Convention of the Protection and Use of Transboundary Watercourses is intended to reinforce national actions for the protection and ecologically sound management of transboundary surface waters and groundwater. The treaty requests parties to prevent, control and diminish water pollution from point and non-point sources through the application of environmental impact assessment (Rwanda Environment Management Authority, 2011).
3.1.3 EAC Protocol on Environment
The protocol was contracted by the partner states of the “East African Community” on 29th November 2003.
Article 5: Paragraph 4 states that countries should promote sustainable utilization of water resources and article 6, paragraph 1 puts emphasis on improving water quality and controlling pollution.
3.2 General Framework
3.2.1 Millennium Development Goals
A recent evaluation of Rwanda’s progress towards achieving the MDGs showed that progress was being made although not all targets will be met by 2015 (Abbott and Rwirahira, 2012). The MDGs include a target directly referring to Water and Sanitation services. Target 7C is to halve by 2015 the proportion of people without sustainable access to safe drinking water and basic sanitation (World Bank, 2008). Box 1 highlights MDG 7 and its targets. In 2010/11, the proportion of population in the City of Kigali using an improved drinking water source was 84.8 per cent and the proportion of population using an improved sanitation facility was 83.3 per cent (National Institute of Statistics for Rwanda, 2012b). However, the 2012 MDG update report has argued that Rwanda is off track to achieve MDG Target 7(Abbott and Rwirahira, 2012)
23
Box 1. Millennium Development GoalsGoal:
Ensure Environmental Sustainability Targets:
• Integrate the principles of Sustainable Development into country policies and pro-grammes; reverse loss of environmental resources;
• Reduce between 1990 and 2015 by half the proportion of the population without sustainable access to safe drinking water;
• Reduce between 1990 and 2015 by half the proportion of the population without access to improved sanitation
• Achieve significant improvement in the lives of at least 100 million slum dwellers by 2020.
Source: (Rwanda Environment Management Authority, 2010) 3.2.2 Rwanda Vision 2020 (2002-2020)
Rwanda’s Vision is to build a knowledge-based economy and to become a private sector led middle income country by 2020 (Abbott and Rwirahira, 2010). It is the long term development framework that sets out Rwanda’s development agenda. It targets to increase per capita Gross Domestic Product (GDP) from approximately US $ 250 in 2000 to at least US $ 900 by 2020. In February 2012, the Government retreat revised this to $1,240. Environment is a cross-cutting issue in Vision 2020 along with HIV/AIDS, gender, youth and social inclusion (including the inclusion of people living with disabilities). This means that all policies and programmes are expected to take them into consideration. With regards to the Water and Sanitation sector, the Vision 2020 states that all Rwandans will have access to safe drinking water in 2020 (Ministry of Finance and Economic Planning, 2002b). Some relevant paragraphs of “Vision 2020” are: “Waste Management: At least 80% of the Rwandan population will have easy access to adequate waste
manage-ment systems and will have mastered individual and community hygiene practices”.
Also, this vision states that by 2020, “the rural and urban areas will have sufficient sewerage and disposal sys-tems; each town will be endowed with an adequate unit for treating and compressing solid wastes for disposal”. Households will have mastered and be practicing measures of hygiene and waste disposal”. To achieve the Sanitation targets by 2020, the urban as well as rural areas are expected to mobilize sufficient investment for sewerage and disposal systems, in addition to which, each town will have adequate facilities for treating and compressing solid wastes for disposal. Although there there has been an increase in the proportion of households with access to sanitation, the Vision 2020, 2010 target of 80 per cent was not met (Ministry of Finance and Economic Planning, 2002b).
3.2.3 The Economic Development and Poverty Reduction Strategy (2008-2012)
EDPRS is Rwanda’s Medium Term Framework for achieving its long term development aspirations (Min-istry of Finance and Economic Planning, 2007). It is the second comprehensive national plan designed to implement Vision 2020. It incorporates the Millennium Development Goals. In contrast with the PRSP 1 (2002-2005) where national poverty reduction priorities focused on improving social indicators (access to education, health, water and sanitation), the context of this strategic plan focuses on economic devel-opment economic growth and transformation with private sector growth and the commercialisation of farming given higher priority (Ministry of Finance and Economic Planning, 2007). Much more pertinent
24
to this strategic plan, the EDPRS has included the environment as one of the critical cross-cutting issues along with HIV/AIDS, youth, people with disabilities, social inclusion and gender. EDPRS includes strategies and priorities for improving the living conditions of the poor, improving the infrastructure and governance.
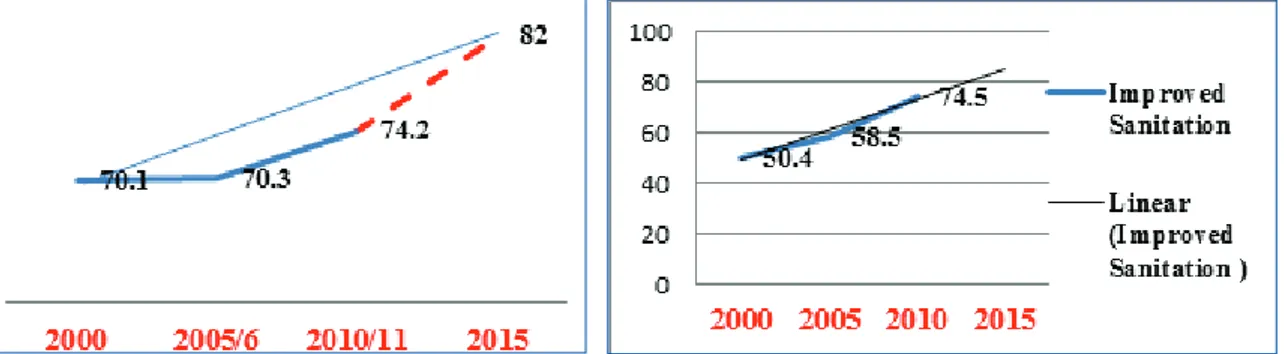
Figure 11: Access to safe drinking water and improved sanitation (2000-2010/11) and linear progression Source: (National Institute of Statistics for Rwanda, 2012b)
EDPRS specifies the priorities to be achieved during the five-year period 2008-2012. During the EDPRS period, the Water and Sanitation sector aimed to increase the proportion of the population accessing safe water from 64 per cent to 86 per cent, and the proportion with sanitation services from 38% to 65%. It is also planned to increase the proportion of the rural population living within 500m of an improved water source from 64 per cent to 85 per cent, and to raise the proportion of the urban population residing within 200m of an improved water source from 69 per cent to 100 per cent. As regards to Sanitation, the sector plans that the proportion of schools with latrines complying with health norms will rise from 10 per cent to 80 per cent, and that the corre-sponding proportion for rural households will increase from 38 per cent to 65 per cent (Ministry of Finance and Economic Planning, 2007).
There has been an increase in improved sanitation, with 74.5 per cent of households having an improved facility by 2010/11, up from 50.4 per cent in 2000 (Figure 11). Given that the total safe drinking water and improved sanitation are respectively 74.2 and 74.5 per cent in 2010/11, it is clear that EDPRS 2012/13 tar-get of 86 per cent of households having such access will not be met and for water the MDG 2015 tartar-get is unlikely to be met. It should be noted that EDPRS aimed to allocate 4.2 per cent of the budget to the Water and Sanitation Sector but it only allocated 3.72 per cent in 2008, 0.36 per cent in 2009 and 1.94 per cent in 2010/1.
3.3 Policy Framework relevant to sanitation
Besides National Decentralization Policy, Water and Sanitation Sector Policy, Environmental Health Policy, National Urban Housing Policy, Health Sector Policy and Land Policy, the National Gender Policy, the Girls Education Policy and Strategic Plan, Health Sector Policy which complement an Environmental Policy, provision of Water and Sanitation are very much emphasised in other major country’s policies and documents such as National Human Settlement Policy, National Water Resources Management, National Wetlands Conservation Program and National Investment Strategy Document and child friendly schools infrastructure standards and guidelines (Tsinda A, 2011).
3.3.1 The National Decentralisation Policy
The National Decentralisation Policy enables citizens to take part in making decisions about priorities for government and contributing to the planning process and to stand for election for committees at a local level (Ministry of Local Government, 2007).
3.3.2 Environmental Policy
This policy involves improvement of the population’s wellbeing, the judicious utilization of natural resources and the protection and rational management of ecosystems for a sustainable and fair development. This is achieved through improved health and quality of life for every citizen and promotion of sustainable
25
socio-economic development through a rational management and utilization of resources and environment, integrating environmental aspects into all the development policies, planning and in all activities carried out at the national, provincial and local level, with the full participation of the population in the activities for the improvement of environment with special attention to women and the youth; adoption of envi-ronmentally friendly technologies, role of private sector and civil society in coordinated and harmonious actions which favour the environment.3.3.3 National Water and Sanitation Sector Policy
The National Water and Sanitation Policy is a very important document which guides Water and Sanitation provision in the country. It is based on Vision 2020, Millennium Development Goals and Poverty Reduction Strategy (Ministry of Infrastructure, 2010). The Policy provides for Decentralization in line with the National Decentralization Policy, institutional aspects, integrated watershed management, monitoring and assessment and participatory approach to Water and Sanitation (Ministry of Infrastructure, 2010). The Policy proposes measures to achieve policy objectives of improving the living conditions of the population through optimal use of water resources and access of all to water and sanitation services. For instance, marshlands are a source of domestic water and development of these areas could have a bearing in water and sanitation of the communities. The Policy is oriented to achieving the Vision 2020, MDGs and other national and international policies and agreements such as National Investment Strategy, Agenda 21. The National Water and Sanitation Policy focuses on six sanitation related fronts: household sanitation,
insti-tutional sanitation, collective sanitation, storm water drainage, solid waste management, and instiinsti-tutional sector framework. This Policy draws greater focus to urban sanitation, defining a policy framework that supports the Sanitation Master Plan for Kigali city. This policy is formulated by giving priority to basic services, decen-tralisation, community participation, cost recovery and financial sustainability, private sector participation, operational efficiency and strengthening of accountability, emphasis on sanitation and hygiene, interests of women and children, grouped settlements, environment and water resources protection and inclusive programme approach.
It stresses on the importance for urban areas to have sanitation master plans which will identify zones for on-site sanitation and collective, off-site sewerage; focus on simplified, affordable solutions for collective sanitation; outline solutions for septic tank emptying services and sludge disposal; identify critical polluters such as industries, hospitals and slaughterhouses, and suggest solutions for treatment and identify type and locations of sludge disposal facilities and, if applicable, of treatment plants. The 3K-SAN Project is coherent with this policy as the project aims directly at improving sanitation in informal settlements and indirectly at poverty reduction and economic development through public health promotion.
3.3.4 Health Sector Policy
One of the objectives of Rwanda Health Sector Policy is to improve the quality of and demand for services in the control of disease through hygiene promotion (Ministry of Health, 2005). The Policy identifies the most common illnesses in Rwanda - most are hygiene related - and puts priority on addressing these diseases. This fits with the 3K-SAN project in improving hygiene and sanitation at the household level. The Policy calls for the strengthening of measures to prevent and improve the management of diseases (Ministry of Health, 2005).
This policy involves the diagnosis and treatment of cases; increase in the protection of individuals and communities using preventative methods like management of the environment, including vector control; marshlands having a role to play in malaria incidences and therefore the policy emphasises more on environmental control of the disease vector especially in marshy areas as opposed to curative services. It is also important to mention that there is a Health Sector Strategic Plan II (HSSP II) which promotes healthier lifestyles and prevention of diseases. This is coherent with 3K-SAN/SPLASH project since it seeks a cost effective strategy, not only to meet the sanitation MDG, but also to decrease the burden of disease and alleviate poverty throughout the three countries (Rwanda, Uganda and Kenya).
26
3.3.5 Environmental Health Policy
The Environmental Health Policy formalised the shift in the government’s strategy to improve health indica-tors from curative to preventive approaches (Ministry of Health, 2008). The Health Sector Strategic Plan 2009-2012 further supports this by identifying sanitation as a high impact intervention that the government will scale up (Ministry of Health, 2008). This fits with 3K-SAN/SPLASH project in the sense that it aims at catalysing self-sustaining chains in informal settlements where sanitation is an issue.
3.3.6 National Water Resources Management Policy
The National Water Resources Management Policy aims at fair and sustainable access to water, improvement of the management of water resources through reforestation on hillsides and water catchments areas (Rwanda Environment Management Authority, 2011). This Policy is relevant to 3K-SAN/SPLASH project as most of the project activities will be undertaken in informal settlements with unimproved sanitation and some of them are located near the swamps.
3.3.7 Land Policy
This policy provides a framework for the use and management of uplands and marshlands, the rational use and sound management of national land resources which is to be based on master plans and land use plans based on the suitability of the land for different purposes. Marshlands are subject to special protection and to be used only after adequate planning and environmental impact assessment has taken place. The policy also sets out the process for land tenure regulation whereby those with customary rights to land will be given a legal registration certificate (Ministry of Natural Resources, 2004a).
3.3.8 National Human Settlement Policy
This policy aims at improving the settlement conditions of the urban population (Ministry of Infrastructure, 2004b). It seems to be completely silent on sanitation issues in the sense that the policy does not guide land use for sanitation or solid waste management in urban areas.
3.3.9 National Urban Housing Policy
This Policy recognizes the need to ensure that people have access to potable water and adequate san-itation facilities. The process of upgrading and provision of services for urban areas will be carried out upon taking into account the income levels of households as well as infrastructure and services to be established (Ministry of Infrastructure, 2008). According to this policy, the upgrading is not synonymous with razing an entire neighbourhood; instead, it means rational redevelopment in order to improve the living conditions of the population. The intervention of 3K-SAN /SPLASH Project fits with the policy as it analyses all characteristics of informality including poor housing.
3.3.10 The National Gender Policy
The National Gender Policy provides a framework for the promotion of gender equality and the empower-ment of women and shows the Governempower-ment’s commitempower-ment to addressing all forms of gender inequality in the country (Abbott and Rucogoza, 2011). The National Gender Policy clearly sets out the process of mainstreaming gender in all public and private sectors, policies, programmes, projects and so on. It also concerned with the empowerment of women. The Ministry of Gender and Family Promotion coordinates the implementation of the policy (Ministry of Gender and Family Promotion, 2010). The Policy sets out the key objectives for ensuring the economic empowerment of women: for employment and growth; for health; in education and vocational training; in governance and justice; in environment protection and land use management; of the most vulnerable; for participating in the private sector; in water and sanitation; in infrastructure; in transport; and, in ICT. All of these are in line with the EDPRS priorities (Ministry of Gender and Family Promotion, 2010).
3.3.11 The Girls Education Policy and Strategic Plan
The Girls’ Education Policy and a Strategic Plan were approved in 2008. They are aimed at achieving gen-der equality in education at all levels. The Policy will be implemented through Girls Education Strategic Plans at District, school and institutional levels (Abbott and Rucogoza, 2011). The overall objective of
27
the Policy is to guide and promote action aimed at the progressive elimination of gender inequalities in education and training at all levels (Ministry of Education, 2008). As part of the implementation of the policy, separate toilets for girls and boys are being provided in all primary schools. This is very relevant to 3K-SAN/SPLASH as this implementation reduces the drop-out of girls from education.3.4 Programmes relevant to sanitation
3.4.1 Child Friendly Schools Infrastructure Standards and Guidelines
The Child friendly schools infrastructure standards and guidelines 2009 for Primary and Tronc Commun schools offers practical guidance on how to achieve the standards set in the Rwandan Education Quality Standards 2008 (Ministry of Education, 2009). Through this document, the Ministry of Education of Rwanda sets clear levels of acceptability as a standard and gives practical guidance on how to achieve them. There are four standards of Child Friendly Schools Infrastructure: “a school must have appropriate, sufficient and secure buildings”, “a school must be a healthy, clean, secure and learner protecting environment”, “a school must have a child-friendly, barrier free environment which promotes inclusive access and equal rights of every child”, “a school must have adequate and appropriate equipment that support the level of education” (Ministry of Education, 2009). This document is relevant to 3K-SAN Project as appropriate toilets standards are conducive to improved sanitation in schools.
3.4.2 National Wetlands Conservation Program
This program engages various government ministries in wetland conservation and ensures a holistic approach to wetland management (Rwanda Environment Management Authority, 2011). All authorities concerned will have proper coordination of activities concerning wetland management.
3.4.3 National Investment Strategy
The National Investment Strategy is a document which encourages the private sector to participate in the provision water and sanitation systems in urban and rural areas at affordable prices for the citizen (Min-istry of Finance and Economic Planning, 2002a). It states that the state will continue to play a leading role in the development of water and sanitation sector through the provision of the necessary infrastructure. According to this strategy, urban development must consequently be well planned in a progressive and participatory manner according to the capacities of various players in the sector. This is in line with the 3K-SAN project since the project gives emphasis on private sector in the sanitation promotion.
3.4.4 National Land Tenure Reform Programme
The National Land Tenure Reform Program is a country-led strategic program (Ministry of Natural Resources, 2007) in which the Government of Rwanda is engaged with national and international partners to ensure the implementation of the National Land Policy and the Organic Land Law in a transparent and efficient way. Land reform involves changes in land tenure that abolish complex dual system of statutory and traditional/customary rights with the intention to introduce more simple and streamlined mechanisms of land related transactions or transfers.
It is in this context that land titling and land registration have started. Land titling and land registration do not form a separate entity but are interlinked as they all aimed at ensuring security of tenure through recognition of land rights to the land owners. As stated by Experts from UN-Habitat, when land titling is the process of emphasizing the evidence of a person’s rights to land, land registration is the process of recording those rights (Rurangwa, 2007) . The benefits of land registration and titling and adjudication being the cornerstone of the whole process, as stated by the literature , include among others certainty of ownership, reduction in land disputes, stimulation of the land market, security for credit, facilitation of land reform, facilitation of land management, improvements in physical planning (Rurangwa, 2007). However, the process will have no impact on the residents of informal settlements as they do not have customary rights to the land on which their houses are built.
28
3.5 Legal and Regulatory Framework
The main elements of the legal and regulatory framework are the new Rwandan Constitution of 2003 (Official Gazette of the Republic of Rwanda, 2003), the Organic Law Determining the Modalities of Protection, Conservation and Promotion of Environment of April 2005, and different ministerial orders and acts. These underscore the right of the citizen to a healthy environment. They also underline the obligations of the state and of individual citizens to protect the environment. In addition, the organic law for environmental protection has preventive and punitive provisions for those who pollute or damage the Environment.
3.5.1 The Rwandan Constitution
The Constitution of the Republic of Rwanda was introduced in 2003 following approval by a referendum held on the 24th May 2003. The Constitution incorporates the articles of environment protection. For instance, article 4 states that each citizen has the right to healthy and satisfying environment; each person has the right to protect to conserve and promote the environment; the government will take care of the environment protection. An Act defines the procedures of protecting, conserving and promoting the envi-ronment. The right to sanitation within the constitution is indirectly recognised but it is not clearly stated. 3.5.2 Organic Law No 04/2005 of 08/04/2005 on Environment Protection and
Manage-ment
The Organic Law No 04/2005 of 08/04/2005 on Environment Protection and Management was adopted in 2005. It provides a strong legal framework for environmental protection. For instance, Chapter IV of the Organic Law article 3 states that every person has the duty to protect and promote the environment; article 60 states that REMA in collaboration with decentralised entities are responsible for the implementation of laws, policies, strategies, objectives and programmes relating to protection, conservation and promotion of the environment in Rwanda; article 62 stipules that decentralised entities have also responsibility of designing plans of collecting and treatment of domestic waste, collecting and piling domestic waste. They shall also put much emphasis on the removal of any other waste in any possible way depending on its nature and quantity, supervision and its treatment.; article 65 further specifies that every project shall be subjected to environmental impact assessment prior to its commencement; the organic law also puts in place the National Fund of the Environment in Rwanda (FONERWA); the article 66 specifies that it has created, to the level of the Provinces, of the City of Kigali, of the Districts, the Cities, the Sectors and the Cells, Committees responsible for the conservation and the protection of the environment (Official Gazette of the Republic of Rwanda, 2005b).
On initial inspection Kigali is now a clean city but while the cleanliness of roads, hotels, restaurants and some residential areas has been much improved this is not the case for informal settlements. If you travel around the City of Kigali, especially to the informal settlements, you will see that the laws on environ-mental protection and public health are not always enforced. Rwanda State of Environment Report states that Kigali is sinking under the weight of its rubbish and sewerage (Rwanda Environment Management Authority, 2010). This situation may be explained by several factors. The main point here is that the Rwanda Environment Management Authority and decentralised entities (City of Kigali, Districts and Sectors) which are responsible for laws enforcement do not have sufficient qualified staff to deal with technical issues. Another factor is that, REMA has not yet published clear standards and guidelines for discharging wastewater in the environment; they do not have legal instruments for law enforcement. In addition, through the Organic Law on Environmental Protection, Conservation and Management, Rwanda Environment Management Authority is mandated to establish modalities and regulations for the collection and use of the environment-protection fees.