1
Numerical Investigation of the Aerodynamic Properties of a
Flying Wing Configuration
Kerstin C. Huber1
DLR, German Aerospace Center, D-38108 Braunschweig, Germany Andreas Schütte2
DLR, German Aerospace Center, D-38108 Braunschweig, Germany Martin Rein3
DLR, German Aerospace Center, D-37073 Göttingen, Germany
The numerical investigations of a generic UCAV configuration are presented. These investigations are part of the DLR internal project UCAV-2010. Compressible speed conditions are considered and presented. The DLR-F17E UCAV configuration is a flying lambda delta wing with sweep angle of 53° and varying leading edge radius. The flow field of this UCAV configuration is dominated by vortex structures and vortex-to-vortex interaction. The paper aims to give a comparison between numerical- and experimental investigations in order to gain a deeper understanding of the complex flow physics. Furthermore, it will highlight the influence of Mach- and Reynolds number change on the flow and the overall aerodynamic behavior of the configuration. The DLR TAU-Code is used to simulate the flow field, using an unstructured grid and the turbulence model of Spalart-Allmaras. Forces and moment measurements taken in the DNW-TWG, Göttingen, on the DLR-F17E configuration serve as the experimental basis to validate the numerical findings. Findings on the SACCON configuration serve as a comparison case aiming to show possible portability between different model scales but also to find analogies between low speed (M=0.15) and compressible speed (M=0.5) scenarios. This paper builds up upon the finding within the NATO/RTO AVT-161 Research Task Group on “Assessment and Control Predictions for NATO Air and Sea Vehicles” and its findings shall serve as a basis for further experimental investigations of medium to high speed wind tunnel experiments. Furthermore, this paper addresses the importance of understanding and the ability to predict controlled- and uncontrolled flow separation and the interaction of vortex systems in order to estimate the aerodynamic behavior within the entire flight envelope and to meet Stability- and Control needs.
Nomenclature
= Angle of attack [°]
∞ = Far field conditions [-] µ = Dynamic viscosity [N s m-2]
= Density [kg m-3]
Cp = Pressure coefficient, Cp=(p-p∞)/(0.5V∞2S) [-]
cMRP = Location of the Moment Reference Point [m]
1 M.Sc., Research Scientist, DLR Institute of Aerodynamics and Flow Technology, Lilienthalplatz 7 D-38108 Braunschweig, Germany, kerstin.huber@dlr.de (Corresponding Author), Tel.: 0049 - (0)531 - 295 2892
2 Dipl.-Ing., Research Scientist, DLR Institute of Aerodynamics and Flow Technology, Lilienthalplatz 7 D-38108 Braunschweig, Germany, andreas.schuette@dlr.de, Tel.: 0049 - (0)531 - 295 2892
3 Prof. Dr., Research Scientist, DLR Institute of Aerodynamics and Flow Technology, Bunsenstraße 10 D-37073 Göttingen, Germany, martin.rein@dlr.de, Tel.: 0049 - (0)551 - 709 2671
30th AIAA Applied Aerodynamics Conference
cref = Reynolds number reference length [m] cr = Root chord [m]
CL = Lift coefficient, CL=L/(0.5V∞2S) [-]
CD = Drag coefficient, CD=D/(0.5V∞2S) [-]
CM = Pitching moment coefficient, CM=M/(0.5V∞2Scref) [-] p = Local pressure [Pa]
s = Half span [m]
S = Surface Area [m²]
V = Velocity [m s-1] AoA = Angle of Attack [°]
CFRP = Carbon Fiber Reinforced Plastic
DLR = German Aerospace Center (Deutsches Zentrum für Luft- und Raumfahrt) DNW = German-Dutch Wind Tunnels (Deutsch-Niederländische Windkanäle) lsting = Length of rear sting [m]
M = Mach number [-]
MPM = Model Positioning Mechanism MRP = Moment Reference Point
NLR = National Aerospace Laboratory of the Netherlands (Nationaal Lucht- en Ruimtevaartlaboratorium) NWB = Low Speed Wind Tunnel Braunschweig (Niedergeschwindigkeits Windkanal Braunschweig) PIV = Particle Image Velocimetry
PSP = Pressure Sensitive Paint
Re = Reynolds number, Re=(Vcref)/µ [-] RTO = Research and Technology Organization SACCON = Stability And Control CONfiguration TWG = Transonic Wind Tunnel Göttingen
I.
Introduction
n recent years increased attention has been drawn to the research and design of so called flying wings. Their conceptual layouts are dominated by delta- and lambda wing configurations. The different shapes are used for the design of Unmanned (Combat) Arial Vehicles (U(C)AV) but also for new additional developments on already existing fighter aircraft. UCAV configurations need to fulfill the requirements for stealth characteristics but also need to maintain high maneuverability as well as long duration flights. This gives rise to a number of aerodynamic challenges as the stealth characteristics impair the freedom of adding flow control devices.
The main objective of this study is to contribute towards a more comprehensive understanding of the vortex dominated flow over the DLR-F17E configuration with varying leading edge radius as part of the DLR internal project UCAV-2010.1 The vortical flow over sharp leading edge delta wings is mainly understood and described in various publications, dealing with the investigations undertaken during the First International Vortex Flow Experiment (VFE-1)2,3. The flow around delta wing configurations with rounded leading edges is not entirely described and understood. Further to mention is that the onset point of the vortex, the vortex location and the progression of the vortical flow around delta wings with round leading edges could be strongly influenced by the leading edge geometry, Reynolds and Mach numbers as well as transition effects. These issues gave rise to initiate the Second International Vortex Flow Experiment (VFE-2)4,5 in 2002, being one of the main parts of the NATO/RTO AVT-113 Research Task Group.6 The need to understand and to be able to numerically predict the aerodynamic behavior and flow structure over a lambda delta wing with a partly rounded leading edge radius is the motivation for this work. This work aims to determine the effect of Reynolds and Mach number variation over the DLR-F17E configuration. For the numerical investigation the DLR flow solver TAU, solving the three-dimensional, time-accurate Reynolds-Averaged Navier-Stokes equations, is used. The configuration was meshed using the unstructured-hybrid grid generator Centaur.7 Experimental data gathered on the DLR-F17E in the DNW-TWG, Göttingen, serves as comparative data for the numerical outcomes.
II.
DLR-F17E Configuration
The DLR-F17E configuration and its dimensions, including rear sting, is depicted in Figure 1.Its plan form is defined as a lambda shaped blended delta wing flat contour. The wing has a highly swept leading edge with a sweep angle of 53° and a leading edge with varying leading edge radius. The DLR-F17E is the 1:21.5 scale model of the full size SACCON. The wind tunnel model is a steel model, weighing around 15 kg. The DLR-F17E model is a
modular model. Beside the ability to apply a cover plate, for wind tunnel tests with engine intakes the model is also prepared to have exchangeable parts at the trailing edge to establish control devices. Within these investigations only the clean configuration is applied, as shown in Figure 2.
The leading edge geometry varies from sharp to round within the orange region, through which the relative thickness stays constant. Within the blue region the leading edge geometry stays round; however the relative thickness is decreasing with increasing wing span location. The leading edge radius changes from round to sharp within the green region, here the relative thickness starts to decrease rapidly towards the wing tip. Hence the flow approaching the configuration is subjected to different sharpnesses. A 5° twist is applied to the most outer profile to diminish the effect of induced wash up. The rear support is attached within the configuration at about 75% of the root chord. The wind tunnel model and setup will be explained in more detail in the following paragraph.
III.
Experimental Approach
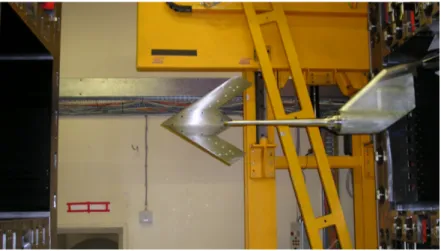
High speed wind tunnel experiments with the DLR-F17E have been conducted in the DNW-TWG, Göttingen, in 2010. The DNW-TWG is a closed circuit, continuous, sub-, trans- and supersonic wind tunnel. An adaptive wall test section was used, allowing for a two-dimensional adaptation of the flow field by means of adjustable upper and lower surfaces of the test section. The model was suspended by a rear sting on a sword with integrated roll support. In order to achieve higher angles of attack during the measurement an adapter with crank angle of 15° has been used, as it can be seen in Figure 3.
Figure 2. DLR-F17E configuration wind tunnel model.
A 6-component strain gage balance was used to determine the forces and moments. The flow condition quantities such as Mach number and Reynolds number were derived from pressure and temperature measurements in the settling chamber, the test section and the plenum.8
IV.
Numerical Approach
A. DLR CFD Solver TAU
The aerodynamic behavior and the flow conditions of the presented configuration were simulated using the DLR TAU-Code, a CFD tool developed by the DLR Institute of Aerodynamics and Flow Technology.9,10,11,12 The DLR TAU-Code solves the compressible, three-dimensional, steady or unsteady Reynolds-Averaged Navier-Stokes equations. Hereby it uses a finite volume discretisation. The code is based on a hybrid unstructured-grid approach. This combines the advantages from hexahedral as well as prismatic elements to resolve the viscous shear layer near the wall and the advantages of flexible grid generation offered by unstructured grids. The DLR TAU-Code has a modular set up and uses a dual grid approach such to be able to apply massive parallelization. The modules used during this numerical investigation are the following.
The Preprocessor - This module uses the information of the primary, initial grid to set up a dual-grid structure. The dual-grid structure is based on a fine- and coarse grid level structure.
The Partitioner - This module partitions the grid structure, supplied by the Preprocessor, as well as re-start solutions from previous calculations into a number of sub-grids, which are then used for parallelized flow calculations.
The Flow Solver - The DLR-TAU Solver performs flow calculations on the dual grid.
B. Computational Grid
In order to assess the agreement between computing costs and solution outcome two different computational unstructured hybrid grids are generated using the unstructured-hybrid grid generator Centaur. The grid topology and parameters are taken from a best practice approach at DLR applied on several configurations like VFE-2 delta wing, X-31 configuration and the generic UCAV SACCON.13,14,15
The surface of Grid I is resolved using a quadrilateral mesh, whereas the surface of Grid II is resolved using triangular elements. The near wall layer of Grid I, in which the boundary layer is present, is resolved by 30 layers using hexahedral elements. The far field is resolved by tetrahedral elements, hereby using pyramid elements to gain a smooth transition from hexahedral elements to tetrahedral elements.
Figure 3. DLR-F17E configuration suspended in the DNW-TWG wind
The flow field around the configuration in Grid II is resolved differently, illustrated in Figure 4 and Figure 5. The orange layer is a prism layer and is used to resolve the region in close vicinity to the surface of the configuration. This near wall layer is resolved by 28 prismatic layers.
The green elements in Fig. 4 are the tetrahedral, resolving the entire space between the final prismatic layer and the outer far-field boundary. Here the tetrahedral element size becomes gradually larger from the final prism layer towards the outer far-field boundary. The difference in number of grid elements is listed in Table 1.
Both grids have a highly discretised leading edge surface mesh, in order to capture all occurring flow phenomena and to predict the vortex onset along the leading edge. The high discretisation is important especially at the leading edge to avoid grid induced separations, caused by not sufficiently resolved round leading edges.
Considering now the convergence behavior illustrated in Figure 6 it can be seen that the convergence times are vary largely. Regarding computational times, the smaller grid was found to be less time consuming and as the numerical results will show later, the coarser Grid II is considered to be sufficient enough to represent the experimental outcomes well.
Monitoring plots of y+ indicate that the y+-value for all flow conditions dealt with in this paper lies between y+ =0 and y+ =2.4. Where y+ =2.4 occurs at the most inner body surface of the configuration. Figure 7 gives a representation of the y+ spread over the upper surface of the configuration. Hence the conclusion can be drawn that the boundary layer is resolved sufficiently enough over the surface where the vortex systems are assumed to occur.
Grid I Grid II
CL 6.51210-01 6.44610-01 CD 8.66710-02 8.27510-02 CM 3.64510-02 3.57010-02
Table 2. Final predicted aerodynamic coefficients.
Grid I Grid II
Support Rear sting Rear sting
BL resolving layers 30 28
Initial wall spacing 0.0210-3 m 0.0610-3 m Total Number of
Grid Points 16.7 Mio 7 Mio
Total Number of
Grid Elements 49.6 Mio 18 Mio
Table 1. Computational grid parameters.
Figure 4. Grid topology of Grid II. Figure 5. Grid topology of Grid II – zoom-in on the
V.
Numerical Results
Within this chapter the numerical results are presented. During the entire course of the numerical simulations a fully turbulent flow condition is assumed. As only changes in angle of attack, and no changes in sideslip- or roll- angle, are considered, calculations are conducted over a half model of the configuration. Hence symmetric boundary conditions are applied at y=0 m. The numerical calculations are carried out using the DLF-F17E configuration with a rear sting, as depicted in Fig. 1. The numerical results are of static nature. The numerical outcomes are compared to experimental values, gathered during the experiments described in Chapter III. The experimental values were also taken using a static approach; meaning that the angle of attack is adjusted, the model positioned and thereafter measurements are performed.
A. Background
This chapter shall give some background information on numerical as well as experimental investigations carried out using the generic UCAV SACCON configuration. The results and flow physics interpretation of the SACCON configuration is the base for the presented results the DLR-F17E model.
First low speed wind tunnel experiments on the SACCON have been carried out in the low speed facility DNW-NWB in Braunschweig and the 14’x22’ low speed facility at NASA LaRC. The low speed experiments were carried out with the DLR-F17/SACCON CFRP lightweight model, which is of 1:8 scale of the full scale SACCON, hence has a wing span of 1.6 m. This model is suspended from a belly sting during the low speed experiments. The outcome as well as the complete set of investigations undertaken during the experiments can be found in the paper by Loeser et al.16and Vicroy et al..17 This work is undertaken as part of the AVT-161 Task Group on “Assessment of Stability and Control Prediction Methods for NATO Air and Sea Vehicles”. The findings of these low speed experiments with regards to the pitching moment coefficient curve, serve as comparison data for the presented numerical results.
Results carried out within the AVT-161 Task Group are documented in Schütte et al..15 These results shall be presented in the following paragraph. In Figure 8 the CFD predictions of the coefficients for lift, drag and pitching moment are displayed versus the experimental data carried out with the low speed wind tunnel model. In Figure 9
the corresponding interpretation of the flow physics and longitudinal stability behavior is presented out of the integrated experimental and numerical approach. During the low speed numerical investigations it was shown that the pitching moment curve gains its characteristic appearance due to the vortex systems behavior on the upper surface of the configuration. With increasing angles of attack a tip vortex is being created, becoming stronger and its onset point, initially being fixed to one point and moves upstream beyond a certain AoA. As shown in Fig. 8 and Fig. 9 a characteristic discontinuity is present caused by the different vortex locations and interactions.
In Figure 10 the basic flow topology is shown before this discontinuity (CM dip)at =17° and the situation at the bottom of the dip and beyond at =19°. During the upstream movement of the tip vortex the area of attached flow is defeated and the tip vortex eventually collects the thickness vortex. The thickness vortex and tip vortex
Figure 7. y+-distribution of Grid II, M=0.5, Re=1.59106 and =15°.
combination acts as a huge outer vortex on the configuration and creates a huge suction area aft the MRP introducing a nose-down pitching moment. Finally all the attached flow region has been defeated by the huge outer vortex, which has moved well upstream of the MRP. Now the nose up pitching moment is regenerated. With further increase in angle of attack the nose-up pitching moment rapidly increases and a non-linear pitching moment part occurs due to vortex breakdown onset within the huge tip vortex.
In the following chapter the described flow physics and pitching moment behavior shall be discussed, introducing the DLR-F17E model configuration with respect to compressible flow conditions, Mach number and Reynolds number variation.
0 5 10 15 20 25 0.02 0.03 0.04 0.05 0.06 0.07 0.08 CM [°] 1 2 Additional nose-up moment due to the vortex breakdown on-set within the tip vortex Formation of tip vortex Tip vortex onset point remains Attached flow region present Vortex break-down onset point moves upstream of the MRP
Tip vortex onset point moves upstream, defeats the area of attached flow and collects the thickness vortex
Attached flow region vanished
Figure 9. Interpretation of the possible vortex flow topology and its effects on the behavior on the pitching moment coefficient, depicted as a function of AoA.15
Figure 8. Lift, drag and pitching moment coefficient versus AoA. Comparison of CFD (Spalart-Allmaras) versus Experiment, M = 0.15, Re = 1.6 · 106.15
Figure 10. Surface pressure distributions and streamlines in the flow field on the upper side of the SACCON model for AOA 17° and 19°. M = 0.15, Re = 1.6 · 106.15
B. Compressible Mach Number Results
In order to determine the overall aerodynamic behavior during a range of angles of attack of the configuration and the flow field around the configuration an angle of attack sweep at Mach M=0.5 and Reynolds number Re=1.6106 is conducted. These calculations were done prior to wind tunnel tests in the DNW-TWG. The effect of the angle of attack on the aerodynamic coefficients can be seen inFehler! Verweisquelle konnte nicht gefunden werden.Figure 11 In order to visualize the vortex systems on the upper surface of the wing a set of surface pressure plots including surface skin friction lines have been created, which are illustrated in Figure 12.
Considering Fig. 11 it can be seen that not only the linear part of the experimental lift curve is represented well by the numerical findings, indicated in red, but also that the numerical findings give an indication of a non linear lifting part, created by the vortex systems on the upper surface of the configuration at =17° up to =19°. The lift is continuously increased due to the continuous increase in strength of the apex vortex as well as the large attached flow region being present. The course of the drag coefficient of the experiments is also very well presented by the numerical values. Continuing with the consideration of the pitching moment coefficient it can be seen that there are differences in the pitching moment values; however the overall characteristic curve of the experiment is well represented by the numerical investigation. The pitching moment coefficient values from the numerical calculations underestimate the pitching moment coefficient values from the experiment for =10° up to =13°, but for values between =13° and =15° the pitching moment matches the CM coefficient very well. The experimental values are overestimated by the numerical values from =15° up to =19°. This effect is well known and applies as well in the investigations by Schuette et al.15 for the SACCON model. The Spalart-Allmaras turbulence model is not able predict vortex systems at higher AoA where vortex breakdown occurs. For this AoA range higher order turbulence models shall be applied, in order to capture non-linear flow phenomena in more detail. Future numerical investigations aim to introduce different higher order turbulence models in order to investigate the non-linear flow phenomena happening at higher AoA.
Using Fig. 9 in combination with the surface pressure plots in Fig. 12 the authors would like to give an interpretation of the development of the vortex system for ten different angle of attack values, hereby explaining their strong influence on the pitching moment coefficient. This evaluation shall also show the strong similarities in the flow structure, as seen in the previous sub-chapter, between the low speed experiments on the SACCON and the compressible speed experiments with the DLR-F17E configuration.
From =10° to =13° the pitching moment increases continuously, due to the continuous increase in strength of the apex vortex, located at the apex and hence also located in front of the MRP.
Figure 11. Lift, drag and pitching moment coefficient verses AoA. Comparison of CFD (Spalart-Allmaras) versus wind tunnel Experiments, M = 0.5, Re = 1.6 · 106.
The surface pressure distribution and the corresponding skin friction lines for AoA from =10° up to =13° indicate the fixed location of the apex vortex and the tip vortex, traveling towards the apex along the leading edge with increasing angle of attack. The originally large region of attached flow spanning the upper surface decreases considerably with increasing angle of attack. The tip vortex traveling towards the apex along the leading edge and the thickness vortex moving further upstream towards the leading edge, defeat the area of the healthy, attached flow. The configuration experiences a nose-down pitching moment between =13° and =16°, seen in Fig. 11.
The tip vortex has moved even further towards the apex and at =14° the region of attached flow has further considerably reduced. Also the thickness vortex has moved in close vicinity of the tip vortex. At this point the tip vortex spans over a much larger area of the outer wing and has already gained enough strength to create a suction overacting the strength of the apex vortex. These forces are acting aft the MRP and hence the model experiences a nose-down moment. At =15° and =16° there is barely an attached flow region present. The tip vortex, which has largely increased in strength, spanning a large area of the outer wing, introduces an even higher nose-down moment on the configuration.
From =17° the pitching moment starts to increase rapidly up until =19°. This is due to the large moment created by the huge outer vortex traveling further towards the apex, upstream the MRP and the onset of vortex breakdown within the tip vortex. This huge outer vortex is created by the tip vortex collecting the thickness vortex, and combining to one single vortex acting upon the configuration, this can also be seen in Fig. 12.
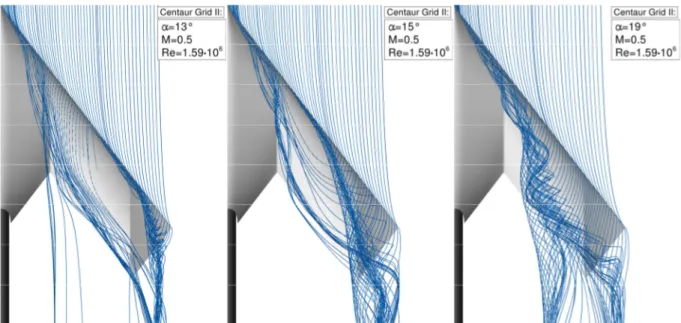
For clarification purposes and to emphasize on the strong similarities between the compressible speed case of the DLR-F17E and the low speed case with the SACCON skin friction lines are plotted, as seen in Figure 13. Here it can clearly be seen that at =13° the apex, thickness and tip vortex are present alongside the attached flow region, comparable to the field streamlines presented in Fig. 10 for =17° for the low speed case. This condition changes when looking at =15° in Fig. 13. Here the tip vortex has moved towards the front starting to collect the thickness vortex. The attached flow region decreases rapidly and the moment created aft the MRP introduces a large nose-down pitching moment. At =19° the attached flow region has completely vanished and the tip and thickness vortex have combined to a huge outer vortex. Its onset point has moved upstream of the MRP, hence the pitching moment is rapidly increasing. This results corresponds also quite well with the topology presented for the low speed case in Fig. 8 for the same AoA.
This chapter has shown that the dip in the pitching moment curve occurs for the experiments as well as the numerical investigation at the same angle of attack. Hence, the numerical approach has been verified by the experiments and will be used for further investigations on the effects of the Mach and Reynolds number variation.
Furthermore, it was shown that for the case of M=0.5 with the smaller DLR-F17E configuration the same characteristic pitching moment curve occurs as for the large SACCON model. However, the pitching moment coefficient dip occurs at lower angles of attack for speeds of M=0.5.
Figure 12. Influence of Angle of attack change at M=0.5 – surface pressure distribution and skin friction surface lines: =10° to =19°.
C. Mach Number Influence
The Mach number effect of the flow field over the configuration for four different Mach numbers is investigated. During this investigation the angle of incidence is kept constant at =15° and a constant Reynolds number of Re=1.6106 is chosen. Figure 14 represents the corresponding effects of Mach number change on the aerodynamic coefficients and Figure 15 illustrates the surface pressuredistribution and the skin friction lines.
Considering the effect of Mach number change on the aerodynamic coefficients it can be observed that with increasing Mach number the lift coefficient increases and with it also the drag coefficient due to the increased induced drag on the configuration.
When looking at the development of the pitching moment coefficient it can be seen, that an increase in Mach
Figure 14. Mach number influence - aerodynamic coefficients:CL , CD and CM.
Figure 13. Field streamlines above the upper side of the DLR-F17E model for =13°, =15° and =19°, at M = 0.5 and Re = 1.59 · 106.
At M=0.3 the apex vortex, as well as the thickness- and the tip vortex can be seen. Also an area of attached flow is present, located between the apex vortex and the tip vortex onset. However when considering the flow structure at M=0.4 it can be seen that the attached flow region has become very small, comparable to the surface pressure distribution at M=0.5 and =14° in Fig.12. Previously it was shown, that the pitching moment decreases due to the large reduction in attached flow region. The same condition occurs at M=0.4, =15°. The tip vortex has moved towards the apex along the leading edge and the thickness vortex is in close vicinity.
At M=0.5 the attached flow region is barely present, though the tip vortex has still not collected the thickness vortex. Hence another reduction in pitching moment occurs. At M=0.6 the tip vortex and thickness vortex have combined to a huge outer vortex, as the pitching moment still continues to decrease, it can be assumed that the attached flow region has still not fully vanished, when leaning on the ideas described in the background chapter.
The change of the on flow Mach number has a significant influence on the longitudinal behavior of the configuration. The vortex system is moved towards the apex with increasing Mach number and for the applied AoA this leads to an increase of the surface loading behind the defined MRP. As seen in the results presented in section V-A. and B. the increase of the on flow Mach number moves the discontinuity to lower angles of attack. The dip in the pitching moment curve occurs earlier. Taking also into account the data from the low speed case it shows that the overall pitching moment values are decreasing with increasing Mach number.
The fact that the pitching moment is decreasing with increasing Mach number is an effect of the specific variation of the nose radius along the leading edge. Looking at the topology at an AoA attack of =10° in Fig. 9, an apex and a tip vortex are present. With increasing Mach number the circulation increases as well as the overall lift coefficient. The balance between the loading of the front and rear part of the wing is influenced by this as well. At the apex the wing has a sharp leading edge and at the tip a small round leading edge is present. At the apex the vortex at the sharp leading edge is getting stronger due to higher circulation feeding the tip vortex caused by a higher Mach number. At the tip the suction peak due to the curved leading edge is significantly increasing with increasing Mach number. This causes a higher outboard pressure gradient within the vortex flow and a stronger tip vortex. This is causing the additional loading beyond the MRP or the different pitching moment coefficient. Finally, this effect has to be verified by additional numerical simulations.
D. Reynolds Number Influence
Evaluating the influence of Reynolds number change the values are varied between Re=1.3106 and Re=6.04106 at a given Mach number of =15°. Figure 16 shows the numerical outcomes, in various colors, compared to the findings discussed in prior, indicated in grey. It can be seen that the numerical outcomes does not show a change in the value of the aerodynamic coefficients when changing the Reynolds number in this range. It seems that the configuration is not affected by small changes in Reynolds number variation. It is interesting that the pitching moment coefficient is not affected either, although we have shown that this aerodynamic coefficient is very sensitive to changes in on flow condition. Figure 17 illustrates the surface pressure distribution and the skin friction lines for
Figure 15. Mach number Influence – surface pressure distribution and skin friction surface lines: M=0.3, M=0.4, M=0.5, and M=0.6.
the four different Reynolds numbers. As expected there can be are no differences seen in the pressure distribution or skin friction line pattern representing the vortical flow structure on the upper wing surface.
Although we do not see any major differences when applying different Reynolds numbers, further investigations have to be done. Work undertaken by Chu and Luckring18 show that the flow around round leading edged delta wings is highly sensitive to variations in Mach number as well as variations in Reynolds number. It was shown that the effect is reversed regarding the movement of the vortex systems in comparison to the Mach number effect. Within the VFE-2 these effects were predicted by various numerical investigations.6
However, it has to be investigated further what the effect of a multiple million variation in Reynolds number, on this specific configuration, is.
Conclusion
The results presented in the current paper are part of investigations on generic flying wing configurations to estimate the aerodynamic behavior of high swept, round leading edge configurations at various flight conditions. Thus the paper presents the numerical investigations applying the DLR TAU-Code on the generic UCAV configuration DLR-F17E. The numerical findings are verified by experiments carried out in the Transonic Wind
Figure 17. Reynolds number influence – surface pressure distribution and skin friction surface lines: Re=1.59106, Re=2.65106, Re=4.06106, and Re=6.04106.
It is shown that the aerodynamic characteristics are predicted well by the DLR TAU-Code at a Mach number of M=0.5 in comparison to the experimental data. Furthermore, the flow topology and aerodynamic behavior carried out with a different scaled model at low speed on flow conditions are reproduced completely.
Mach number and Reynolds number variations are applied to determine the influence of different flight conditions. It is found that with changing Mach number the pitching moment coefficient and with is the longitudinal behavior is influenced significantly. This is caused by a major change of the vortex systems on the upper surface of the wing.
The Reynolds number effect on the configuration is found to be minor regarding the applied changes in Reynolds number values. However, further investigations have to be undertaken to determine the effect of very large Reynolds number variations on the configuration.
Future numerical investigations will follow and aim to include higher order turbulence models in order to capture and give a closer representation of non-linear flow phenomena. During the compressible speed experiments in the DNW-TWG, PIV measurements were also undertaken. This data will be available soon and the numerical results can then also be evaluated using surface pressure cut representations. This will make it possible to give a more detailed interpretation and also evaluation of the vortex structures found in the numerical results.
Further investigations are currently being planned to equip the configuration with possible control surfaces, in order to investigate the control surface derivatives and its overall effect on the configuration and the vortex systems. All these investigations are being conducted and planned in order to create an experimental database for these kinds of configurations which serve as verification data for numerical investigations. The final aim is to systematically identify and predict the vortex structures and its sensitivities on the aerodynamic behavior for a more into depth stability- and control evaluation.
Acknowledgement
The authors would like to thank the team of DNW-TWG in Göttingen for there excellent work and support of the experiments. Furthermore the authors will thank Okko Boelens from NLR for several fruitful discussions.
References
1 Huber, K.C., “Numerical Investigation of the Aerodynamic Performance of a Flying Wing Configuration“, Master Thesis and DLR Internal Report IB 124-2010/4, 2010.
2 Drougge, G., “The international vortex flow experiment for computer code validation,” ICAS-Proceedings 1988, Vol. 1, pp. XXXV-XLI.
3 Elsenaar, A., Hjelmberg, L., Bütefisch, K.-A., and Bannink, W.J., “The international Vortex Flow Experiment,” AGARD-CP437, Vol.1, pp. 9-1 to 9-23, 1988.
4 Hummel, D., “The second international vortex flow experiment (VFE-2): Objectives and first results,” 2nd International Symposium on "Integrating CFD and Experiments in Aerodynamics", 5 - 6 September 2005, Cranfield University, UK. J. of Aerospace Engineering, Vol. 220 (2006), Nr. 6: 559 - 568.
5 Hummel, D., “Review of the Second International Vortex Flow Experiment (VFE-2),” AIAA Paper 2008-377, 46th AIAA Aerospace Sciences Meeting and Exhibit, Reno, Nevada, Jan. 7-10, 2008.
6 Lamar, J., Hummel, D., “Understanding and Modeling Vortical Flows to Improve the Technology Readiness Level for Military Aircraft,” NATO/RTO AVT Final Report, RTO-TR-AVT-113 AC/323 (AVT-113) TP/246, Oct. 2009.
7 Centaur Soft, http://www.centaursoft.com.
8 Rein, M., “Measurements of aerodynamic forces and moments on the DLR.F17E Model in low- and high speed flows“, DLR Internal Report, IB 224-2011 A61, 2011.
9 Galle, M., Gerhold, T., Evans, J., “Technical Documentation of the DLR TAU-Code,” DLR-IB 233-97/A43, 1997. 10Gerhold, T., Galle, M., Friedrich, O., Evans, J., “Calculation of Complex Three-Dimensional Configurations employing the DLR TAU-Code,” AIAA Paper 97-0167, Jan. 1997.
11Gerhold, T., “Overview of the Hybrid RANS Code TAU,” in N. Kroll, J. Fassbender (Eds.) MEGAFLOW – Numerical Flow Simulations for Aircraft, NNFM, Vol. 89, Berlin, 2005, pp. 81-92.
12Schwamborn, D.; Gerhold, T.; Heinrich, R., “The DLR TAU-Code: Recent Applications in Research and Industry,” In proceedings of European Conference on Computational Fluid Dynamics - ECCOMAS CDF 2006, Delft The Netherland, 2006.
13Schütte, A. and Lüdeke, H., “Numerical investigations on the VFE 2 65-degree rounded leading edge delta wing using the unstructured DLR-TAU-Code,” AIAA Paper 2008-0398, 2008.
14Schütte, A., Boelens, Okko J., Oehlke, M., Jirásek, A., Loeser, T., ”Prediction of the flow around the X-31 aircraft using three different CFD methods”, Journal of Aerospace Science and Technology, ISSN 1270-9638
15Schütte, A., Hummel, D., and Hitzel, S.M., „Numerical and Experimental Analyses of the Vortical Flow Around the SACCON Configuration”, AIAA 2010-4690, 28th AIAA Applied Aerodynamics Conference, Chicago, 2010.
16Loeser, T., Vicroy, D., and Schuette, A.., “SACCON Static Wind Tunnel Tests at DNW-NWB and 14´x22´NASA LaRC,” AIAA Paper 2010-4393, 2010.
17Vicroy, D., and Loeser, T., “SACCON Dynamic Wind Tunnel Tests at DNW-NWB and 14´x22´NASA LaRC,” AIAA Paper 2010-4394, 2010.
18Chu, J., Luckring, J.M., “Experimental Surface Pressure Data Obtained on a 65° Delta Wing Across Reynolds and Mach Number Ranges,” NASA Technical Report 4645, Vol. 1-4, 1966.