PIDE Working Papers
2007:26
Impact of Export Subsidies on
Pakistan’s Exports
Nadeem Ul Haque
Vice-Chancellor
Pakistan Institute of Development Economics, Islamabad
and
M. Ali Kemal
Research Economist
Pakistan Institute of Development Economics, Islamabad
PAKISTAN INSTITUTE OF DEVELOPMENT ECONOMICS
ISLAMABAD
2
All rights reserved. No part of this publication may be reproduced, stored in a retrieval system or transmitted in any form or by any means—electronic, mechanical, photocopying, recording or otherwise—without prior permission of the author(s) and or the Pakistan Institute of Development Economics, P. O. Box 1091, Islamabad 44000.
© Pakistan Institute of Development Economics, 2007.
Pakistan Institute of Development Economics Islamabad, Pakistan
E-mail: publications@pide.org.pk
Website: http://www.pide.org.pk
Fax: +92-51-9210886
C O N T E N T S
Page
Abstract v
Abbreviations vii
1. Introduction 1
2. Export Subsidy Schemes: How Well Have They Worked? 1
3. Estimating the Impact of Export Subsidy Schemes 5
4. Conclusion 9
Appendixes 10
References 17
List of Tables
Table 1. Correlation of Exports as a Percentage of GDP with
Export Subsidies 4
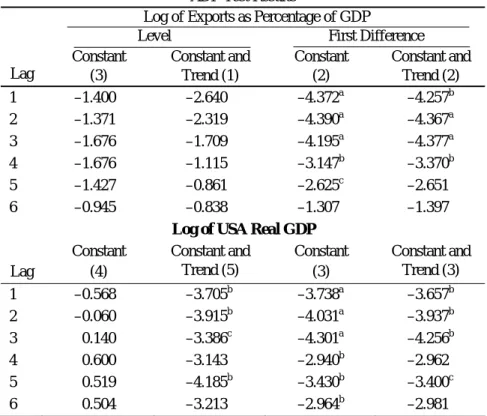
Table 2. ADF Test Results 6
Table 3. PP Test Results 6
Table 4. Normalised Long-run Coefficients 7 Table 5. Vector Error Correction Model 8 Table 6. Normalised Long-run Coefficients Using Dummy Variable 8 Table 7. Vector Error Correction Model 9
List of Figures
Figure 1. Exports and Export Financing as Percentages of GDP 3 Figure 2. Exports and Rebate/Refunds as Percentages of GDP 5
List of Appendixes
Appendix A. Facilities/Incentives Provided to Exporters 10
Appendix B. Data and Methodology 14
ABBREVIATIONS
ADF Augmented Dickey Fuller (test) AIC Akaike Information Criterion ARDL Auto-regressive Distributed Lag CBR Central Board of Revenue CPI Consumer Price Index DDR Duty Drawback Rate DE Direct Exporter
DTRE Duty and Tax Remission for Export EFS Export Financing Scheme
ELC Export Letter of Credit
FCEF Foreign Currency Export Finance FEO Firm Export Order FOB Freight on Board GDP Gross Domestic Product IDE Indirect Exporter IFS International Financial Statistics ILC Import Letter of Credit
IMF International Monetary Fund IOC Input-Output Coefficient IOCO Input-Output Coefficient Organisation PEFG Pre-shipment Export Finance Guarantee PEFGA Pakistan Export Finance Guarantee Agency
PEMPUF Pioneering Export Marketing and Product Upgradation Fund PIDE Pakistan Institute of Development Economics
PP Philip-Perron (test) SBC Schwarz Basian Criterion SBP State Bank of Pakistan SRO Statutory Regulatory Order ECM Error Correction Model WDI World Development Indicators
ABSTRACT
Throughout Pakistan’s history, policy has sought to promote exports through government support and incentives. The government machinery is geared to export promotion especially through direct and indirect subsidies. Surprisingly, these policies have been continued without serious examination. This paper makes a first attempt to evaluate these policies by estimating the impact of two such schemes—export financing and rebate/refund schemes—on export performance. Our analysis shows that, over the long run, the export financing scheme had a negative effect on exports while the rebate/refund scheme affected exports insignificantly. Subsidy schemes clearly do not seem to work, yet they have been retained for many years.
JEL classification: C32; F13; F14; F31
Keywords: Rebate, Duty Drawback, Export Financing, Exports, Trade,
Exchange Rate, Co-integration, Vector Error Correction, Pakistan.
1. INTRODUCTION*
Export promotion has appropriately been an important policy objective of all Pakistan’s governments for many years. Policies made for this purpose have all sought to subsidise exports or push exports through government intervention (see Appendix A).1 Instead, these incentive systems have led to illicit export practices such as export over-invoicing due to weak policy implementation. Such practices have resulted in significant financial loss to the country and undermined the effectiveness of export-promoting policy [Mahmood and Azhar (2001)].
Two subsidies have been maintained to promote export in 1973, the export finance scheme (EFS) was introduced2 with a view to promoting non-traditional exports. Later, it was applied to all commodities. In October 1977, all commodities except raw cotton, rice, wool, and hides and skins were included in this scheme. Duty drawback or the rebate scheme has been applied to various selected commodities since the 1960s. The objective of this duty drawback is to make Pakistan’s exports more competitive in world markets by providing raw materials and intermediate goods at zero duty.
This paper evaluates the impact of export finance and duty drawback (rebate/refunds) schemes on the growth of exports. The organisation of the paper is as follows: Section 2 describes the two schemes, and their importance and trends; Section 3 presents and explains empirical findings; and Section 4 draws conclusions from the study.
2. EXPORT SUBSIDY SCHEMES: HOW WELL HAVE THEY WORKED?
The State Bank of Pakistan (SBP)’s EFS was introduced in 1973 with a view to facilitating non-traditional and emerging commodities. Four years later, all manufactured goods were included in the scheme,3 under which, exporters could borrow at concessionary rates. The difference between rates on EFS and the market lending rate varied between 0.5 percent in December 1994 and 7.4
Aknowledgements: The authors would like to thank Dr A. R. Kemal, Mr Arshad Khan, Mr Sajawal Khan and participants of the Pakistan Institute of Development Economics (PIDE) ‘Nurturing Minds’ seminar for valuable suggestions and comments on earlier drafts of the paper. Mr Safdarullah and Ms Irem Batool also provided research assistance. All errors remain the authors’ responsibility.
1For further details on export promotion policies, see http://www.epb.gov.pk/epb/jsp/faq.jsp. 2The exchange rate was fixed at PRs 9.90/$ in1973.
3Concessional credit was not available for exporters of raw cotton, rice, wool, and hides and
2
percent in December 1998 [Janjua (2004)]. However, under the reforms process these margins were rationalised afterwards. Currently, the gap between the SBP’s announced EFS rate and the market lending rate is fixed at 2 percent.4
Under the rebate/refunds scheme, custom duties, sales tax, and excise duty, etc. paid on raw materials were refundable if the goods made of these raw materials were exported afterwards.5 As under the EFS, the primary objective of this scheme was also to encourage taxpayers/exporters to export more. Procedures were rationalised by standardising rates and linking the drawback to the FOB value of exports.6
These export promotion subsidy schemes are difficult to administer and are subject to manipulation for rent-seeking purposes. For example, export financing is available on production of an irrevocable letter of credit, which can easily be falsely obtained. It is difficult to check whether funds that have been obtained are being used for the purpose intended, while exporters complain of procedural delays. It is because of rent-seeking possibilities and procedural difficulties that many economists have called for these policies to be discontinued.
The Central Board of Revenue (CBR) (2000) addresses the problem of fake invoices and delays in refunds cause by the need to manually verify documentation. The study concluded that the prevailing duty drawback rates (DDRs) were higher than the actual incidence of custom duty on those items.7 The report also concluded that DDR procedures were complex and in some parts even anomalous, but that this was typical of DDR schemes in other parts of the world8 as well.9
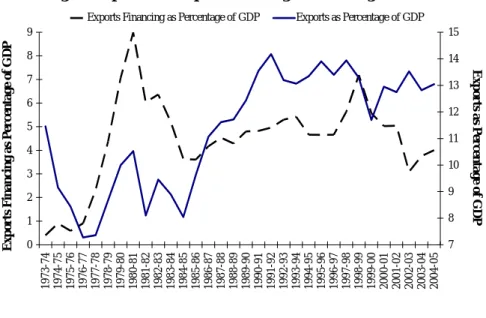
Pakistan’s export performance over the last 35 years has been less than spectacular, especially when we account for extensive government efforts to boost exports (see Figure 1).10 Through the 1970s and 1980s, exports as a
4For more details on export financing, see Janjua (2004).
5Rebate/refunds were 2 percent of total exports in 2003–04 (4.77 percent in 2001–02),
meaning that exporters were earning 2 percent profit directly.
6See http://www.epb.gov.pk/epb/jsp/faqans.jsp?faq_id=8.
7The abolishment of the refund scheme last year for the textiles sector was based on the
same fact because (i) most cottage industries are outside the tax net but generally claim rebate, and (ii) documentation problems prevent authorities from streamlining these industries.
8See the following websites: http://www.asmara.com/drawback.htm, http://dateyvs.com/
custom07.htm, http://www.dutydrawback. info, and http://icsbroker.com/ Drawback% 20definitions.htm
9While policy intends well, political economy considerations point to the possibility of
misuse.
10The government devotes an extraordinary effort to promoting exports, based on the large
number of official visits for this purpose to the entire commerce ministry doing nothing else but promoting exports. In addition, there a number of agencies, such as the Export Promotion Bureau, that devote substantial resources to export promotion. There are also a large number of civil servants who are placed as commercial officers in most Pakistani embassies at considerable expense. Given the static export/GDP ratio over the last decade and a half, there is urgent need to examine the efficacy of these efforts.
3 percentage of gross domestic product (GDP) declined even from the low level of 5 percent in 1970. In the late 1980s, we see the ratio of exports to GDP picking up as some liberalisation policies were put in place.11 The ratio of exports to GDP increased to about 14 percent in 1992 and has remained at about 13–14 percent since then.
Figure 1 also shows that there might not be any clear relationship between the EFS and export performance. The introduction of the EFS in 1973 does not appear to have had any immediate impact. Even though the EFS/GDP ratio started rising sharply in 1977 when all manufactured products were allowed to take concessionary credit under the scheme, export performance did not show such improvement. The ratio declined to 3.62 percent in 1985 and then remained at around 4.75 percent on average till 1998. Interestingly, from 1985 to 1998, exports as a percentage of GDP rose from 8 to 14 percent. The decline in export financing as a percentage of exports after 1999 was mainly associated to the FE-25 scheme of foreign exchange loans [Janjua (2004)].12 From this analysis, it is straightforward to conclude that the impact of the EFS on exports is insignificant.
Fig. 1. Exports and Export Financing as Percentages of GDP
0 1 2 3 4 5 6 7 8 9 1973-7 4 1974-7 5 1975-7 6 1976-7 7 1977-7 8 1978-7 9 1979-8 0 1980-8 1 1981-8 2 1982-8 3 1983-8 4 1984-8 5 1985-8 6 1986-8 7 1987-8 8 1988-8 9 1989-9 0 1990-9 1 1991-9 2 1992-9 3 1993-9 4 1994-9 5 1995-9 6 1996-9 7 1997-9 8 1998-9 9 1999-0 0 2000-0 1 2001-0 2 2002-0 3 2003-0 4 2004-0 5 E x p o rt s F ina nci n g a s percent a g e o f G D P 7 8 9 10 11 12 13 14 15 E x por ts as p er ce n tage of G D P
Exports Financing as percetnage of GDP Exports as percentage of GDP
11A managed float was adopted in 1981 and a largely sensible exchange system that
eliminated substantial periods of overvaluation was established by the mid-1980s.
12
The FE-25 scheme was introduced in 1998 to facilitate home remittances and mobilise foreign exchange resources. Foreign currency deposits were allowed freely (without asking) to any authorised commercial banks/NBFIs that were free to accept foreign currency deposits from any party in any one of the major four currencies, i.e., US dollars, Japanese yen, Deutsche marks, and British pounds sterling. Parties are then also allowed to invest/lend the same in Pakistan or keep/invest abroad subject to their observing regulations [Janjua (2004)].
Exports Financing as Percentage of GDP Exports as Percentage of GDP
Exports Financin
g as Percen
tage of GDP
Exports as Perce
4
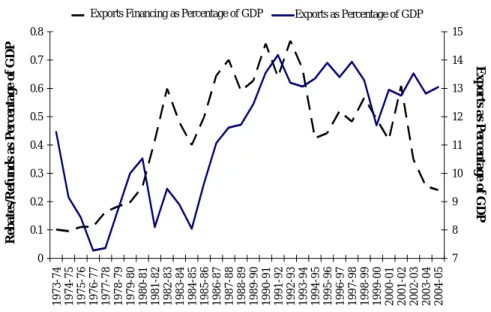
Rebate/refunds followed an increasing trend in the first few years when the negative list took effect in 1981.13 It was 0.6 percent of GDP (6.3 percent of total exports) in 1982–83 and 0.64 percent of GDP (6 percent of total exports) in 1987–88 when the International Monetary Fund (IMF)-funded structural adjustment programme was started. Due to tariff rationalisation in 1987–88, the rebate/refunds scheme was expected to decline. However, it continued to grow till 1992–93 when it reached 0.77 percent of GDP (5.82 percent of exports). It started falling in 1993–94 and sank as low as 0.42 percent of GDP (3.18 percent of exports) in 1994–95. There is, overall, a positive relationship between rebate/refunds as a percentage of GDP and exports as percentage of GDP. Moreover, the decrease in rebate/refunds as a percentage of GDP could be associated with the decline in tariff on imports (the correlation between average tariff and rebate/refunds as a percentage of exports has been 73 percent since tariff rationalisation started).14
Manufacturers use raw materials or machinery to produce foods for export. This implies that rebate/refunds on raw materials or machinery may have a lagged impact on exports. Table 1 shows a strong positive correlation between exports as a percentage of GDP and rebate/refunds as percentage of GDP. The correlation between the two variables increases and becomes significant when we analyse it using lags. On the other hand, the correlation between exports as a percentage of GDP and export financing as a percentage of GDP at all lags and levels is around 30 percent, which is quite low and insignificant.
Table 1
Correlation of Exports as a Percentage of GDP with Export Subsidies
Export Financing as Percentage of GDP Rebates/Refunds as Percentage of GDP Level 0.316 (0.34) 0.528 (0.63) 1 0.315 (0.34) 0.659 (0.90) 2 0.309 (0.33) 0.717 (1.05) 3 0.319 (0.34) 0.790 (1.31) 4 0.282 (0.30) 0.863 (1.74)b 5 0.292 (0.31) 0.896 (2.06)a
Notes: a, b Indicate significance levels of 5 and 10 percent, respectively. Values in parentheses
indicate t-values.
13Trade liberalisation started in 1981 with a decline in the ban and quota list.
14Overall, the total rebate/refunds amount has increased each year except over the last few
5
3. ESTIMATING THE IMPACT OF EXPORT SUBSIDY SCHEMES
In order to estimate the impact of the two schemes on exports, we need to examine the time series properties of the variables. Figures 1 and 2 show that all three variables that need to be examined are heavily trended. The subsidy element has been in constant decline as a matter of policy while exports have increased over the long period as is to be expected. In order to derive an unbiased estimate of the impact of the two policies on exports, we need to ensure that this trend in the two variables does not contaminate our estimates. This requires some econometric testing and data manipulation.
Fig. 2. Exports and Rebate/Refunds as Percentages of GDP
0 0.1 0.2 0.3 0.4 0.5 0.6 0.7 0.8 1973-74 1974-75 1975-76 1976-77 1977-78 1978-79 1979-80 1980-81 1981-82 1982-83 1983-84 1984-85 1985-86 1986-87 1987-88 1988-89 1989-90 1990-91 1991-92 1992-93 1993-94 1994-95 1995-96 1996-97 1997-98 1998-99 1999-00 2000-01 2001-02 2002-03 2003-04 2004-05 R eb a te s/ R ef u n d s a s p ercen ta g e o f G D P 7 8 9 10 11 12 13 14 15 E x p o rt s a s p ercen ta g e o f G D P
Rebates/Refunds as percentage of GDP Exports as percentage of GDP
To check the unit root, we apply the Augmented Dickey Fuller (ADF) test using both constant and trend on the log of USA real GDP and the log of exports as a percentage of GDP (Table 2). The Philip-Perron (PP) test is applied using the constant term on the log of the real exchange rate because there are structural breaks in the series. Each series is checked at various lagged differences in ADF and at various truncated lags in the PP test (Table 2). Results on unit root test show that log of exports as a percentage of GDP and log of the real exchange rate are difference stationary i.e. I(1), while log of USA real GDP is stationary at level i.e. I(0). We then proceed to check the long-run and short-run impact of both policies on exports using a co-integration and error correction mechanism, respectively.
Exports Financing as Percentage of GDP Exports as Percentage of GDP
Rebates/Re funds as Percen tage of GDP Exports as Perce ntage of GDP
6
Table 2
ADF Test Results
Log of Exports as Percentage of GDP
Level First Difference
Lag Constant (3) Constant and Trend (1) Constant (2) Constant and Trend (2) 1 –1.400 –2.640 –4.372a –4.257b 2 –1.371 –2.319 –4.390a –4.367a 3 –1.676 –1.709 –4.195a –4.377a 4 –1.676 –1.115 –3.147b –3.370b 5 –1.427 –0.861 –2.625c –2.651 6 –0.945 –0.838 –1.307 –1.397
Log of USA Real GDP
Lag Constant (4) Constant and Trend (5) Constant (3) Constant and Trend (3) 1 –0.568 –3.705b –3.738a –3.657b 2 –0.060 –3.915b –4.031a –3.937b 3 0.140 –3.386c –4.301a –4.256b 4 0.600 –3.143 –2.940b –2.962 5 0.519 –4.185b –3.430b –3.400c 6 0.504 –3.213 –2.964b –2.981
Notes: a,b,c Indicate significance levels of 1, 5, and 10 percent, respectively. Values in parentheses
indicate lags where the Akaike Information Criterion (AIC) is at a minimum.
Table 3
PP Test Results
Log of Real Exchange Rate
Truncated Lag Level (1) First Difference (1)
1 0.812 –3.464b 2 0.669 –3.564b 3 0.589 –3.640b 4 0.542 –3.707a 5 0.520 –3.740a 6 0.514 –3.752a
Notes: a, b Indicate significance levels of 1 and 5 respectively. Values in parentheses indicate lags
7 Various methods of co-integration are available: the two most popular are (i) the Engle-Granger single equation two-step co-integration approach and (ii) the multiple equation Johansen co-integration approach. In this paper, we need to assess the impact of export subsidies on exports. Therefore, the multiple co-integration approach is not required. The most popular and widely used single equation co-integration approach, the Engle-Granger approach, has certain shortcomings, which can generally be overcome by using a technique proposed by Pesaran and Shin (1997)15 known as the Auto-Regressive distributed lag (ARDL) co-integration approach [see Khan, Qayyum, and Sheikh (2005)]. The estimates from the ARDL approach yield consistent estimates of the long-run coefficients irrespective of the order of integration of variable, i.e., whether I(0) or I(1) (see Appendix B for details of the estimate procedure).
Based on the methodology given in Appendix B, the estimate results (Appendix C) show that there is a long-run relationship among the variables.16 Normalised co-integrating vectors in Table 4 show that, in the long run, export financing has a negative impact on exports, which is somewhat surprising. The DDR effect on exports seems to be positive but insignificant, that the data appears to support the hypothesis of anomalies and procedural delays and the capture of the scheme by rent-seekers. The statistical analysis clearly shows that subsidy schemes achieve their objective of increasing exports. Error Correction model is used to check the short-run impact of the subsidy schemes (see Table 5). The short-run impact of the EFS on exports is insignificant, while the coefficient of the DDR scheme is significant at 6 percent, which implies that it has some impact on exports in the short run.
Table 4
Normalised Long-run Coefficients
Variable Coefficient t-value
LXY(–1) 1.00
LR(–1) 0.30 0.95
LYUSA(–1) –1.74 –1.31
LXFX(–1) 0.16 2.93a
LDDX(–1) –0.10 –0.70
Note: a indicates significance level of 10 percent.
15The first version of this study came out in 1995. 16
8
Table 5
Vector Error Correction Model
Variable Coefficient t-statistic Prob.
C –0.045 –1.22 0.24 Error Termt-1 1.000 3.85a 0.00 D(LXY(–1)) 0.103 0.76 0.46 D(LXY(–2)) –0.153 –1.33 0.20 D(LR(–1)) 0.118 0.61 0.55 D(LR(–2)) –0.277 –1.46 0.16 D(LYUSA(–1)) –1.681 –2.24b 0.04 D(LYUSA(–2)) 4.198 5.65a 0.00 D(LXFY(–1)) –0.048 –0.88 0.39 D(LXFY(–2)) –0.025 –0.60 0.56 D(LDDY(–1)) 0.117 2.03c 0.06 D(LDDY(–2)) 0.010 0.20 0.84 R2 0.780 F-stat 5.44a
Note: a,b,c Indicate significance levels of 1, 5, and 10 percent, respectively.
As discussed in the previous section, exports have been eligible for foreign currency loans under the FE-25 scheme since 1998–99. However, there is no data available on foreign currency loans since the FE-25 scheme was started. Thus, to capture the impact of foreign loans under the EFS, we use a dummy variable which takes a value of 1 up until 1998–99 and zero afterwards. Similar to previous results, co-integration exists among the variables when we use the slope dummy with the EFS and the lag order 2. Results obtained in Table 6 show that, in the long run, export financing has a negative impact on exports while the rebate/refunds scheme has a positive but insignificant impact. Error correction results (Table 7) show that, in the short run, the rebate/refunds scheme has some positive impact on exports but the EFS is insignificant to export growth in the short run.
Table 6
Normalised Long-run Coefficients Using Dummy Variable
Variable Coefficient t-value
LXY(–1) 1.00 LR(–1) 0.25 1.17 LYUSA(–1) –1.95 –2.09c LXFX(–1) 0.04 0.75 LXFX(–1)aDUMFE25 0.07 2.48b LDDX(–1) –0.01 0.09
9 Table 7
Vector Error Correction Model
Variable Coefficient t-statistic Prob.
C –0.097 –1.76c 0.10
Error Term with Dummyt–1 1.000 2.55b 0.02
D(LXY(–1)) 0.026 0.16 0.88 D(LR(–1)) 0.308 1.24 0.23 D(LYUSA(–1)) –1.410 –1.61 0.13 D(LXFY(–1)) –0.269 –1.80c 0.09 D(LXFY(–1))aDUMFE25 0.259 1.60 0.13 D(LDDY(–1)) 0.173 2.31b 0.04 D(LXY(–2)) –0.100 –0.74 0.47 D(LR(–2)) –0.169 –0.74 0.47 D(LYUSA(–2)) 4.433 4.97a 0.00 D(LXFY(–2)) –0.171 –1.14 0.27 D(LXFY(–2))aDUMFE25 0.177 1.05 0.31 D(LDDY(–2)) –0.006 –0.09 0.93 R2 0.740 F-stat 3.35a
Note: a,b,c Indicate significance levels of 1, 5, and 10 percent, respectively.
4. CONCLUSION
We have assessed the impact of subsidy schemes on exports over the last three decades. Our econometric investigation shows that both subsidy mechanisms—export financing and rebate/refunds—have an insignificant impact on exports in the long run. In the short run, the rebate/refunds scheme seems to have a small positive impact.
Economists are mostly opposed to these outmoded subsidy schemes because they are (i) not well targeted, (ii) not easy to administer, and (iii) open to rent-seeking. In the case of Pakistan, subsidy schemes have not achieved their objective to increase exports, suggesting that one or all the conjectures put forward by economists could be operative.
It is interesting to note that these schemes have been in place for about three decades with little systematic evaluation, perhaps out of policy inertia. Meanwhile, the share of exports in GDP has been stagnant for a while. Given this, and the results of the study, suggests that there is urgent need to evaluate the various government initiatives for export promotion.
10
Appendixes APPENDIX A
FACILITIES/INCENTIVES PROVIDED TO EXPORTERS
This appendix describes what facilities/incentives are provided to exporters.17 In order to improve and enhance exports from Pakistan, exporters have been given calculated facilities/incentives. The objective of these facilities/incentives is to make exports zero-rated, which means that the exporter does not pay any tax on sales abroad. The major facilities/incentives available to exporters at present are:
• Export financing at the rate of 13 percent under the SBP’s EFS.
• Export financing under the foreign currency export finance facility (FCEF/$.Window) for the purchase of inputs domestically or import of foreign inputs for exportable goods.
• Export credit guarantees under Pakistan Export Finance Guarantee Agency (PEFGA) to those able to fulfil collateral requirements for obtaining export finance.
• Income tax at the rate of 0.75–1.25 percent for different commodities under the Income Tax Ordinance 1979.
• Facilities under the Temporary Importation Scheme.
• Facilities under the Common Bonded Warehouse Scheme.
• Facilities under the Pioneering Export Marketing and Product Upgradation Fund (PEMPUF) (currently in its development phase).
• Duty Drawback Scheme.
• Export House Scheme.
• Payment of commission to agents abroad.
• Opening of offices abroad.
• Protocol passes to leading exporters for access to lounges at national airports, etc.
Export Finance Scheme18
The SBP introduced the Refinance Scheme in 1973 to provide concessionary export finance to promote the export of non-traditional and emerging commodities. Subsequently, the scope of the scheme was enlarged to include all manufactured goods. Commodities such as raw cotton, rice, wool, and hides and skins remained ineligible for concessionary export finance (see Appendix Table 1). The scheme witnessed a further operational change in
17This section is based on the Export Promotion Bureau website. See http://www.epb.
gov.pk/epb/jsp/faqans.jsp?faq_id=10.
18This section is based on the Export Promotion Bureau website. See http://www.epb.
11 October 1977 when it was divided into two parts, I and II, the underlying systems of each being quite distinct from one other.
Under Part I of the scheme, finance was admissible on a case-to-case basis. An exporter with a contract or letter of credit for the export of any eligible commodity could obtain pre-shipment loan finance from his or her bank for 150 days; this period was extended to 180 days. On request to the SBP, the loan-disbursing bank was eligible for refinance provided that it had already disbursed finance to the exporter. Further, exporters were eligible for post-shipment finance till realisation of exports proceeds or 180 days, whichever is earlier. Exporters were under obligation to produce the relevant shipping documents within the prescribed period, failing which a fine was levied as prescribed under the scheme for non-shipment. In case an exporter was unable to export goods for any reason, he or she could substitute a new contract or letter of credit for an old contract or letter of credit and export the same or different eligible goods to the same or other buyers, provided they had not availed finance against the new contract or letter of credit.
Under Part II of the scheme, a limit equal to 5/12 of the proceeds realised during the previous year was allowed on a revolving basis against such realisations reported on the export finance EE statement duly verified by the Foreign Exchange Department. Exporters were under obligation to realise export proceeds equal to 2.4 times during the relevant financial year on the EF statement prescribed for that purpose. In case of failure to realise matching export proceeds, exporters would then be required to pay a fine as prescribed for non-performance.
The above provisions of the scheme have not provided sufficient incentive to the entities that are responsible for completion of a product actually meant for export by the exporter against a contract/letter of credit received from abroad. In order to provide incentives to all sectors of the economy, the EFS was revised, under the new modus operandi of which, banks are to ensure that the financing facilities offered by the scheme are made available to the other entity generating exports, i.e., indirect exporters, instead restricting finance to only one entity directly exporting eligible commodities.
Under the revised procedures, efforts have also been made to ensure that small, medium, and emerging exporters as well as indirect exporters have adequate access to the EFS’s credit facilities, if otherwise eligible. As an important tool to ensure this, the government also intends to introduce a pre-shipment export finance guarantee (PEFG) scheme to be administered through a new corporate entity. The cover obtained by exporters under the said scheme, particularly by small and medium exporters, will substitute for the collateral requirements of banks and thus hedge the financing risk of commercial banks against manufacturing non-performance, non-delivery risk, and non-payment by exporters.
The maximum rate of finance that banks can charge their borrowers under this scheme remains 13 percent at present.
12
Appendix Table 1
List of Commodities Ineligible for Concessionary Export Finance Under the Export Financing Scheme
1 Raw cotton (excluding surgical bleached/absorbent)
2 Cotton yarn (excluding cotton sewing thread, blended yarn containing 49 percent cotton, dyed yarn, and yarn of Count 30 and above) 3 Fish other than frozen and preserved
4 Mutton and beef (excluding frogs’ legs) 5 Petroleum products
6 Crude vegetable materials (excluding floricultural and horticultural products, rosebuds/flower, sassafras, and guar gum extract/guar protein) 7 Wool and animal hair (excluding wool tops)
8 Crude animal materials (excluding animal casings and fat-ends) 9 Animal feed
10 All grains including grain flour (excluding Irri/basmati rice with brand names in packets of 1–50 kg)
11 Stone, sand, and gravel 12 Waste and scrap of all kinds 13 Crude fertiliser
14 Oil seeds, nuts, and kernels
15 Jewellery exported under the Entrustment Scheme
16 Live animals (excluding hatching eggs and day-old chicks) 17 Hides and skins
18 Leather (wet blue)
19 Inorganic elements and oxides, etc.
20 Crude minerals(excluding refined/treated salt) 21 Works of art and antiques
22 All metals (excluding Magnesite in processed form, blister copper, and chrome concentrates in processed form)
23 Furs
24 Wood in rough or squared cubes
Source: http://www.epb.gov.pk/epb/jsp/faqans.jsp?faq_id=19?
Export Finance under Part I
Under Part I of the scheme, commercial banks shall provide finance to direct exporters (DEs), against a firm export order (FEO)/export letter of credit (ELC). They will also provide finance to those parties (indirect exporters or IDEs) who supply eligible inputs to DEs for further processing, provided that the DE has established an inland letter of credit/issued a standardised purchase order in favour of the IDE where applicable.
13
Export Finance under Part II
Under Part II of the scheme, a DE is entitled to avail a finance limit equivalent to 50 percent of his or her export performance during the preceding year (July–June) in respect of eligible commodities by furnishing an undertaking to the bank as per form UT-DE-II. The DE may authorise his or her banker to open an import letter of credit (ILC)/issue an SRO(s) in favour of the IDE(s) for supplying inputs as per the procedure laid down within the prescribed limits in form DE-3. The amount of the limit availed by the DE as well as the amount of ILC(s) opened/SPO(s) issued in favour of the IDE(s) for the supply of domestic inputs, when taken together, should not exceed the DE’s entitled limit. The bank may, however, sanction a foreign currency loan in respect of the imported inputs in accordance with the procedure.
Refund/Rebate Scheme 19
The primary objective of the refund/rebates schemes is to facilitate taxpayers by paying back the amount of tax paid in excess of liability or as advance payment by them or, in the case of exports, taxes paid at the import stage or at stages of local manufacture. Although the duty drawback regime with the sole objective of export facilitation and promotion has been in operation since the 1970s, entertaining significant refund payments on account of sales tax has been a relatively recent phenomenon that is linked to the introduction of sales tax such as value-added tax since the mid-1990s. The expansion of the quantum of refunds is linked to the ever-expanding scope of sales tax by removing item-wise, sector-wise, and area-wise exemptions. Similarly, wide variations in refund claims against various subheads of direct taxes are an ongoing experience.
Section 21(c) of the Customs Act 1969 allows repayment, in whole or part of the customs duties paid on the import of any goods that have been used in the production, manufacture, or processing of goods meant for export. Similarly, central excise duty paid on any imported material or components or excisable material used in the production, manufacture, or processing of exported goods is also refundable. The exporter files the rebate claim at the respective customs or export collectorate along with all supporting documents, including a calculation sheet, bank credit advice, airway bills, and bills of lading. The receiving officer, after determining that the claim is within time and legitimate and that the calculation sheet is correct, places it before the sanctioning authority. The sanctioning authority, i.e., the assistant collector/deputy collector/additional collector/collector (depending on the amount to be sanctioned) ensures that the claim is genuine in all respects and that there are no recoveries outstanding against the claimant. The refund claim is then sanctioned.
19
14
Under Section 10 of the Sales Tax Act 1990, a taxpayer can adjust the tax paid on inputs and claim a refund if his or her input tax exceeds output tax. Similarly, since exports are zero-rated under Section 4 of the Sales Tax Act 1990, it entitles exporters to claim refunds.
The rebate wing of the CBR used to prescribe standard (non-company-specific) and individual ((non-company-specific) DDRs. It allowed the refund of import duty, central excise duty, and sales tax paid on the import of goods used in the production, manufacture, or processing of goods exported from Pakistan. However, with time it was realised that the scheme had failed to produce the desired results. There was no systematic estimate or update of input-output coefficients (IOCs) and the process of fixing and administering rates lacked transparency. DDRs were often higher than the incidence of taxes actually incurred. Exporters were understandably content with this and confined their complaints mainly to delays in the payment process, etc. Data for the last 18 years manifest that DDRs have been much higher than they should have been.
The Input-Output Coefficient Organisation (IOCO) was established in 2001 with the objective of devising a systematic method to determine IOCs and DDRs in consultation with trade bodies, and to review and revise these rates periodically. It was believed that with the systematic calculation of IOCs and the resulting DDRs reflecting the incidence of duty actually paid would strengthen free trade policy by increasing the take-up of DTRE procedures, since setting accurate DDRs would remove the current attraction to drawbacks. Now, the IOCO determines the quantity of imported material required for use in a given quantity of manufactured end-product, and notifies standard or specific DDRs. Based on these notifications, export/customs collectorates issue rebates to exporters.
APPENDIX B
DATA AND METHODOLOGY
Annual data on exports (both in US dollars and Pakistan rupees) are taken from various issues of the Pakistan Economic Survey. Data on exchange rates, the domestic consumer price index (CPI), USA CPI, USA nominal and real GDP, and USA GDP deflators are taken from International Financial Statistics
(IFS) and World Development Indicators (WDI). Data on USA real GDP are available till 2003 in WDI 2005, therefore, the last two values have been computed by using the USA’s nominal GDP (as given in IFS) divided by its GDP deflator. Data on export financing is taken from the SBP and on duty drawback from various issues of the CBR Annual Year Book and quarterly reports of the CBR. This study covers the period 1974 (when export financing started) to 2005.
15
Construction of Variables
A simple export demand model is estimated below. The log20 of exports as a percentage of GDP is taken as the dependant variable while the log of the real exchange rate and log of the USA real GDP are taken as explanatory variables. The USA real GDP is used as a proxy to world GDP because Pakistan’s largest share of trade is with the USA. Both duty drawback and export refinance variables are taken in log form as a percentage of total exports.
Exports as a percentage of GDP (XY): X100 GDP Exports
Real exchange rate (RER): Xnominalexchangerate CPI
Domestic CPI USA
USA real GDP (Y):
deflators GDP terms nominal in GDP
Duty drawback as a percentage of total exports (DDX): X100 Exports
drawback Duty
Export financing as a percentage of GDP (XFX): X100 Exports
financing Export
It is necessary to make sure that the Johansen methodology used is superior if there are more than one co-integrating vectors and we are interested in checking multiple co-integrating vectors. However, the ARDL approach is better than other approaches if we need to check a single equation co-integrating relationship among variables [see Khan, Qayyum, and Sheikh (2005)] for more details). Similar to other approaches to co-integration, we initially need to check the order of integration for each variable. A detailed methodology is given below.
A stochastic process is said to be stationary if it satisfies three conditions. First, the series exhibits mean reversion; it fluctuates around a constant long-run mean. Second, the variance of the series should be constant over time. Third, the value of auto-covariance between two time periods depends on the distance or lag between these periods and not on the actual time at which the covariance was computed. Other conditions that need to be satisfied for the series to be stationary are that the initial condition is not given, that no major random shock takes place, and that the sample size is quite large.21
20Log implies natural log.
21A series is said to be stationary if the it exhibits mean reversion and fluctuates around the
long-run equilibrium value. It has constant, finite, and time-invariant variance, and has a correlogram that diminishes as lag length increases [Enders (1995)].
16
Co-integration
A long-run equation is estimated using the following Equation (1) and the significance of the variables in lag-level forms checked jointly using an F-statistic, i.e., Ho is β1 = β2 = 0. If the F-statistic is significant, we can say that
there could be a long-run relationship between the variables.
ARDL Representation (Two-variable Case)
t n i i t n i i t t t t y x y x y =β +β +β + β ∆ + β ∆ +ε ∆
∑
∑
= − = − − − 1 4 1 3 1 2 1 1 0 … … (1)The number of lagged differences is determined using AIC or SBC. This can be done by using a general to specific methodology, i.e., by checking the significance of all the differenced variables jointly at each lag. For example, if we regress the equation including four lags (lagged differences) of each variable and check all the terms of lag 4 jointly using the F-statistic, if it is insignificant we would again regress the equation using three lags and continue this process until it showed statistically significant results. Wald test is used to confirm the existence of co-integration.
The next step involves generating an error/residual (εt) from Equation 1.
The final step is to estimate an error correction model (ECM) to check the short-run dynamics.
Error Correction Representation
t t n i i t n i i t t y x y =β + β∆ + β ∆ +β ε +η ∆ − = − = −
∑
∑
3 1 1 2 1 1 0 … … (2) Variable Labelling Appendix Table 2 Variable LabellingLXY Log of exports as percentage of GDP LR Log of real exchange rates
LYUSA Log of USA GDP
LXFX Log of export financing as percentage of GDP LDDX Log of rebate/refunds as percentage of GDP DUMFE25 Define 1 till 1998–99 and zero afterwards
Error Term Error term from equation estimated without dummy Error Term with Dummy Error term from equation estimated using dummy
17
APPENDIX C ESTIMATE RESULTS
Appendix Table 3
Results of ARDL Approach
Variable Coefficient t-statistic Prob.
C –24.49 –1.37 0.19 D(LXY(–1)) 0.22 1.27 0.22 D(LR(–1)) 0.85c 1.81 0.09 D(LYUSA(–1)) –4.40a –3.51 0.00 D(LXFX(–1)) 0.15c 1.88 0.08 D(LDDX(–1)) –0.06 –0.46 0.65 D(LXY(–2)) 0.17 0.74 0.47 D(LR(–2)) 0.12 0.31 0.76 D(LYUSA(–2)) 0.74 0.56 0.59 D(LXFX(–2)) 0.14b 2.20 0.05 D(LDDX(–2)) –0.04 –0.43 0.68 LXY(–1) –0.91a –2.87 0.01 LR(–1) –0.26 –0.95 0.36 LYUSA(–1) 1.48 1.31 0.21 LXFX(–1) –0.14a –2.93 0.01 LDDX(–1) 0.09 0.70 0.50 R2 0.8069 F-statistic 3.62
Note: a,b,c Indicate significance levels of 1, 5, and 10 percent, respectively.
Appendix Table 4
Evidence of Co-integration Using Wald Test
F-statistic 2.98 Probability 0.0522
Chi-square 14.90 Probability 0.0107
REFERENCES
Ahmed, A. M., and R. A. Ahmed (2002) Addressing the Refunds and Rebates Conundrum. CBR Quarterly Review July–September 2:1. Islamabad: CBR. Enders, Walter (1995) Applied Econometric Time Series. John Wiley & Sons,
Inc.: United States
IMF (Various Issues) International Financial Statistics. International Monetary Fund.
Janjua, M. A. (2004) History of the State Bank of Pakistan. Karachi: State Bank of Pakistan.
Khan, M. A., A. Qayyum, and A. A. Sheikh (2005) Financial Development and Economic Growth: The Case of Pakistan. The Pakistan Development Review
18
Mahmood, Z., and M. Azhar (2001) On Overinvoicing of Exports in Pakistan.
The Pakistan Development Review 40:3, 173–85.
Pakistan, Government of (Various Issues) Annual Yearbook. Islamabad: Central Board of Revenue.
Pakistan, Government of (Various Issues) Quarterly Reports. Islamabad: Central Board of Revenue.
Pesaran, M. H., and Y. Shin (1997) An Autoregressive Distributed Lag Modelling Approach of Cointegration Analysis. Revised version of a paper presented at a symposium at the Centennial of Ragnar Frisch, Norwegian Academy of Sciences and Letters, Oslo, 3–5 March 1995. Also available at http://www.econ.cam.ac.uk/faculty/pesaran/ardl.pdf
World Bank (Various Issues) World Development Indicators. Washington, D.C.: The World Bank.