MŰHELYTANULMÁNYOK DISCUSSION PAPERS
INSTITUTE OF ECONOMICS, HUNGARIAN ACADEMY OF SCIENCES BUDAPEST, 2011
MT-DP – 2011/26
Capital allocation in financial
institutions: the Euler method
Discussion papers MT-DP – 2011/26
Institute of Economics, Hungarian Academy of Sciences
KTI/IE Discussion Papers are circulated to promote discussion and provoque comments. Any references to discussion papers should clearly state that the paper is preliminary.
Materials published in this series may subject to further publication.
Capital allocation in financial institutions: the Euler method
Author: Dóra Balog Department of Finance Corvinus University of Budapest E-mail: [email protected]
June 2011
ISBN 978-615-5024-63-4 ISSN 1785 377X
Capital allocation in financial institutions:
the Euler method
Dóra Balog Abstract
Capital allocation is used for many purposes in financial institutions and for this purpose several methods are known. The aim of this paper is to review possible methods (we present six of them) and to help financial companies to choose between the methods. There are some properties that an allocation method should satisfy: full allocation, core compatibility, riskless allocation, symmetry and suitability for performance measurement (compatibility with Return on Risk Adjusted Capital calculation). If we think about practical application we should also consider simplicity of the methods. First we examine the methods from the point of view if they are satisfying core compatibility. We test this with simulation where we add to the existing literature that we test core compatibility with different assumptions on returns: on normal and t-distributed returns and also on returns generated from a copula. We find that if we measure risk by a coherent risk measure, the Expected Shortfall there are two methods satisfying core compatibility: the Euler method (that always fulfills the criteria) and cost gap method (obeys it around in about 99%). As Euler method is very easy to calculate even for many players while cost gap method becomes very complicated as the number of the players increases we examine further the properties of Euler method. We find that it fulfills all the above given criteria but symmetry and as aforementioned it is also very easy to calculate. Therefore we believe that the method might be suggested for practical applications.
Keywords: Capital Allocation, Coherent Measures of Risk, Core, Simulation
T
ő
keallokáció a pénzügyi intézményekben:
az Euler-módszer
Balog Dóra Összefoglaló
A tőkeallokációt számos célra használják a pénzügyi intézményekben, melyhez különféle módszereket használhatnak. A tanulmány célja, hogy áttekintse a lehetséges módszereket (melyek közül hatot mutatunk be), valamint az, hogy megkönnyítse az egyes módszerek közötti választást.
Vannak bizonyos tulajdonságok, melyek teljesítését elvárhatjuk a különféle módszerektől: ilyen a teljes allokáció, a kockázatmentes allokáció és a magelosztás követelménye, a szimmetria, valamint a teljesítménymérésben való alkalmazhatóság. Ha a módszereket a gyakorlatban is szeretnénk alkalmazni, akkor a fentiek mellett a számítás egyszerűségét is figyelembe kell vennünk.
Először abból a szempontból vizsgáljuk a módszereket, hogy magbeli elosztást eredményeznek-e. Ezt szimuláció segítségével teszteljük, a korábbi irodalmakhoz képest annyiban lépve tovább, hogy különböző feltételezésekkel élünk a hozamokra vonatkozóan: normális eloszlás, t-eloszlás és kopula segítségével generált hozamokat is vizsgálunk. Két olyan módszert találunk, melyek a szimuláció során közel 100%-ban magallokációt eredményeznek: a cost gap módszert és az Euler-módszert (amely minden esetben magbeli elosztást ad).
Mivel azonban a kettő közül az Euler-módszerrel való számítás jelentősen egyszerűbb, a továbbiakban az Euler-módszer tulajdonságait vizsgáljuk, melynek során azt találjuk, hogy a szimmetrián kívül minden kritériumnak eleget tesz. Ez alapján úgy gondoljuk, hogy ez a módszer javasolható lenne a gyakorlati alkalmazásokban való felhasználásra.
Tárgyszavak: tőkeallokáció, koherens kockázatmérték, mag, szimuláció
1
Capital allocation in financial institutions: the Euler method
Dóra Balog
1Abstract
Capital allocation is used for many purposes in financial institutions and for this purpose several methods are known. The aim of this paper is to review possible methods (we present six of them) and to help financial companies to choose between the methods.
There are some properties that an allocation method should satisfy: full allocation, core compatibility, riskless allocation, symmetry and suitability for performance measurement (compatibility with Return on Risk Adjusted Capital calculation). If we think about practical application we should also consider simplicity of the methods.
First we examine the methods from the point of view if they are satisfying core compatibility. We test this with simulation where we add to the existing literature that we test core compatibility with different assumptions on returns: on normal and t-distributed returns and also on returns generated from a copula. We find that if we measure risk by a coherent risk measure, the Expected Shortfall there are two methods satisfying core compatibility: the Euler method (that always fulfills the criteria) and cost gap method (obeys it around in about 99%). As Euler method is very easy to calculate even for many players while cost gap method becomes very complicated as the number of the players increases we examine further the properties of Euler method. We find that it fulfills all the above given criteria but symmetry and as aforementioned it is also very easy to calculate. Therefore we believe that the method might be suggested for practical applications.
Keywords: Capital Allocation, Coherent Measures of Risk, Core, Simulation
JEL Classification: C60, C70, G20
1
Introduction
Capital allocation means the process of distributing the capital to different business lines or portfolio elements. As financial markets are getting more and more rigorously regulated the importance of capital allocation is also increasing. In the article we are going to analyze six possible allocation methods and try to find out if there is any of them that both results allocation satisfying some reasonable requirements and also easy to employ – so it can be suggested for practical purposes. As both Hungarian and international studies are showing that capital allocation is not yet a very common practice at financial institutions, finding such
2
a method might be a real benefit. We will show that if we use Expected Shortfall as risk measure Euler method has many desirable properties as it fulfills the requirements of full allocation, core compatibility, riskless allocation and it is suitable for performance measurement (see Denault, 2001 and Tasche, 2008). Furthermore it is really easy to calculate independently from the number of considered business lines. The paper is organized as follows: in the next Section we present application areas of capital allocation to emphasize how important this process is at financial enterprises. In Section 3 we review the properties that an allocation method should satisfy and give six possible methods in Section 4. In Section 5 we examine using simulation the fulfillment of core compatibility first in portfolios consisting of three elements. We test this with different assumptions: on normal and t-distributed returns and also on returns generated from a copula. We also examine what happens if we increase the number of players and run the simulation for normal and t-distributed returns with four players too. The simulation shows that best results belong to the Euler and cost gap methods. As cost gap method gets very complicated to calculate with larger number of divisions, we examine further properties of Euler method in Section 6. In the last Section we summarize our results.
2
Motivation
The allocation of capital is a process that is applied by most of the financial institutions in their operation. We summarize the most important application areas to present why we think that the comparison of the methods detailed in Section 3 might be useful in practice too. The most obvious application is allocation of capital among different lines of business in banks or other financial institutions. As capital means cost for the banks (as it must be held in risk free assets, generating no or very low interest) it is important to know the contribution of the different lines of business to this cost. Most common targets of the allocation are the following divisions: retail, corporate and investment banking, leasing, treasury etc.
Capital allocation is used in performance measurement too. When someone wants to compare revenue earned by different business lines it is also necessary to take their capital needs into account. The most widely applied indicators are Return on Risk Adjusted Capital (RORAC), Risk Adjusted Return on Capital (RAROC) and Risk Adjusted Return or Risk Adjusted Capital (RARORAC). For the exact definition of RORAC see Section 3.
3
It is also possible to allocate capital among individuals or products instead of lines of business. This way capital allocation might be used for individual performance measurement in case of managers and also to define limits in case of traders. If we talk about managers then the same indicators can be used as for measuring performance of lines of business. This is usually done in order to decide on their bonuses or just to evaluate them. In case of traders limits can be set up using capital allocation methods to limit the exposure of trading in the treasury. Limits can also be set for portfolios instead of traders.
Another application area is in strategic decision making process. The methods we present here can also be used when a bank wants to extend its activity with a new business line. In this situation revenues and capital need must be forecasted and performance measurement indicators should be calculated but it also has to be considered how the new business line will affect the capital need of the existing ones. When we think about products instead of new divisions the same process can be used for pricing new products.
We also should not forget insurance companies as capital allocation is also an important tool there. In this case it is also applied for defining capital needs of different business lines (life, non-life etc.), but it might be useful too when more insurers underwrite a risk together that would be too large for any of them alone. In this case premium and risk sharing can also be done via methods described in this paper.
Regarding the question to what extent are these methods used in practice we are aware of only two papers, one of them regarding Hungarian, the other German banks. Balogh (2006) has found that capital allocation is rather only performed on regulatory basis (i.e. regulatory capital requirement is calculated for each lines of business and these are aggregated than) and risk based capital allocation is not a common tool in Hungary. According to Homburg and Scherpereel (2005) the situation was better in Germany as the same was true for only 56% of the German banks. But 17% used incremental method, 11% the beta method, and 16% other methods to allocate risk capital. We assume that this situation has improved in the years passed since these studies were written and therefore we think that our paper can really have benefits in practice.
4
3
The allocation of capital
To discuss the allocation methods first we have to define what capital is. In our approach capital will be considered as economic capital. Let us suppose a financial institution has n divisions and let denote the set of divisions, and let be random variables, standing for the profits on the assets in a division. This way the company is represented by a vector and let denote the aggregated profit. Economic capital means the reserve that a financial company needs to cover its losses and it is determined by a risk measure denoted by :
According to Artzner et al. [1999] a risk measure is coherent if it satisfies the following properties:
Subadditivity: .
Monotonicity: if then .
Positive homogeneity: for all we have .
Translation invariance: for all we have that .
For further reading on coherent measures of risk we suggest Csóka et al. [2007]. The most common risk measure is Value at Risk (VaR). Given the significance level α it is calculated as:
Even though VaR is very popular it is not a coherent measure of risk, as it is well known that it violates the criterion of subadditivity. Therefore we are going to use another risk measure, Expected Shortfall (from now on ES):
,
where stands for the generalized inverse function. Given the significance level (1-α) ES results the average loss in α% of the worst cases (while VaR shows the best outcome among them). Apart from the fact that coherent risk measures (be definition) satisfy the four criteria given above it has another one desirable property to measure risk with them, as it was shown by Denault [2001] that there always exists a core compatible allocation if we use a coherent risk measure. Furthermore Csóka et al. [2009]
5
proved that the class of risk allocation games coincides with the class of totally balanced games, that is all risk allocation games are totally balanced and all totally balanced games can be generated by a risk allocation game with a properly specified risk environment.
As we already defined capital we can move on to its allocation. It seems quite natural to consider capital allocation as a cost sharing game well know from cooperative game theory. There are several examples in the literature, for example Csóka and Pintér [2011]. This way we look at capital as a total cost, that has to be shared between the players, the divisions. Now we can say that an allocation rule is a function that assigns the vector
) to the portfolios of the divisions where the
element of the vector denotes the capital allocated to ith division, given a specific risk measure, . Similarly to the coherent properties of a risk measure there are some requirements that an allocation rule should satisfy (following Denault, 2001 and Tasche, 2008).
Full allocation:
Core compatibility: for all subsets we have
Symmetry: If by joining any subset , portfolios i and j both make the same contribution to the risk capital, then
Riskless allocation:
RORAC-compatibility: let us define the RORAC (Return On Risk Adjusted Capital) of the ith division by:
where denotes the expected return on division i. The risk contributions are RORAC-compatible if there exists some ε > 0 so that
for all 0 < h < ε. A capital allocation rule is RORAC-compatible if all the risk contributions, fulfill the above given criterion.
The interpretation of the axioms is as follows. Full allocation represents the natural requirement that the sum of the allocated capitals of the divisions must be equal to the risk of the main unit. Core compatibility means that a portfolio should not have any subset that is allocated more capital than the risk capital it would face as a separate entity. Symmetry ensures that the capital allocated to the elements should only depend on its contribution to the risk of the portfolio and nothing else. The meaning of the riskless allocation axiom is also
6
clear: to a riskless portfolio its risk measure should be allocated. RORAC-compatibility becomes relevant if we would like to use the result of the allocation in performance measurement. It says that if we add a new element to the portfolio having a higher RORAC (better performance) then the new portfolio’s RORAC also has to increase (should perform better). An allocation rule satisfying core compatibility, symmetry and riskless allocation principles is often referred as coherent (Denault, 2001).
4
Capital allocation methods
Let us overview some of the most common capital allocation methods. We are going to present these methods without the specification of the risk measure so they can be easily applied with other kinds of risk measures, not only ES that we are going to use for risk measurement. When we introduce the first five methods we will follow the article of Homburg and Scherpereel [2008] and on the top of that we will also analyze the Euler method. We only take into account allocation rules that satisfy full allocation property.
4.1 Activity based method
Activity based method is a long known and popular allocation scheme (see e.g. Hamlen et al., 1977) that allocates the joint capital to the portfolio elements in proportion to their own risk:
A really serious drawback of the method is that it does not consider the dependence structure between the portfolio elements. This means it does not ‘reward’ those elements with smaller units of risk allocated that are correlated negatively with the rest of the portfolio.
4.2 Beta method
Beta method – also known as covariance-based allocation – is discussed for example at Panjer [2002]. Let denote the covariance of the portfolio X and the ith division. As we know the beta of the ith division can be calculated as . This way the risk allocated to is:
7
If we consider a financial institution and we would like to allocate its risk to its divisions we can assume that the weight of each division is one. In this case the sum of the betas equals one, but otherwise we have to modify the method in order to satisfy the full allocation axiom as follows:
4.3 Incremental method
For further reading on the method we suggest Jorion [2007]. Let us define the increment caused by a division given the coalition S as for all coalitions and for all where Now we can define the allocated capital similarly to the activity based method:
where the second definition is only necessary to enable us for easier comparison with the cost gap method.
4.4 Cost gap method
After a smaller amendment on the above given method we get the cost gap allocation rule, first introduced by Tijs and Driessen [1986]:
(5)
where . This means that if the sum of
8
Otherwise by both methods there’s a correction factor that guarantees that the full allocation principle is fulfilled and the difference between the two methods is only the way of correction. However – as we will see – this apparently small modification makes one much better in core allocation percentage than the other.
4.5 Shapley method
The Shapley method is a well-known tool in cost allocation games with a number of favorable properties (for example it always results core allocation in case of convex games). Nevertheless a serious drawback of the method is that it can be calculated easily when we have only a few players but with more calculation becomes fairly complicated (this holds for the incremental and cost gap methods too). Shapley [1953] investigated if there exists a value that represents the utility that is caused for the player by taking part in the game. The rule calculates the cost by the weighted average of cost increments caused by the given division (we still use the same definition of increments given above):
for all i=1, …, n, where denotes the number of divisions in coalition S.
4.6 Euler- (or gradient) method
Euler (or gradient) method is a very old allocation scheme known in game theory as Aumann-Shapley value (see Aumann and Aumann-Shapley, 1974). Throughout the discussion we are going to use the following notations. First let us calculate the value of a portfolio by the sum product of the value of its elements and their weights: . Let be positively homogenous (that does not mean any restriction as we only concern coherent risk measures). The per unit allocated risk is given by:
assuming that is continuously differentiable.
For a continuously differentiable and positively homogenous we can apply Euler’s theorem:
9
so – getting back to our former notation – the following holds:
The differentiability of the risk measure Expected Shortfall is discussed by Tasche [2000]. According to his results the derivative – if exists – can be calculated as:
5
Examination of the different allocation methods – core compatibility
When it comes to practical application it is important to know the properties of the above presented methods in order to choose between them. In this section we are going to examine the methods from the point of view if they are core compatible and if not to what extent (probability) they obey the criterion. We believe that core compatibility is the most important property of an allocation rule as it captures fairness of the allocation. It is also confirmed by the survey of Homburg and Scherpereel [2005] where fairness was evaluated to be a very momentous criterion.
Our aim was to perform a study similar to Homburg’s and Scherpereel’s [2008] but we made some modifications as follows. We also performed simulations but we used ES as risk measure while they chose VaR, because as we mentioned earlier VaR is not a coherent measure of risk contrary to ES. The second significant difference was that we used historic method counter to the authors who applied delta-normal method. This means that we generated sample return data and calculated ES from these ‘time series’ while Homburg and Scherpereel generated only covariance matrices to calculate VaR. This way they only considered normally distributed returns, while we also generated returns from t-distribution and from a copula. We also added Euler method that the authors did not consider in their article.
During the simulation we assumed to have a portfolio (bank) consisting of for first three, then four elements (divisions) and used two different approaches in the simulation. First we generated return time series using random correlation matrices. As the most simple case of the first approach we used normal distribution, but we also ran the simulation with Student
t-10
distribution. T-distribution describes the behavior of real returns better as they are well known to be heavy tailed, observed first by Mandelbrot back in 1963. We generated correlation matrices (more precisely, first Cholesky matrices) and the standard deviation of each asset, that was chosen randomly from U(0,1). We also created the random independent return time series from normal and t-distribution. We used t-distribution with 5 degrees of freedom, that means pretty fat tails, similarly to that we can observe in real asset returns. This way we got multivariate normal and t-distributed time series. At this stage we could calculate the allocated capital applying the methods discussed above. Finally we examined if the allocations resulted from the different rules were core compatible or not: we calculated the allocated risk of every possible coalitions and the single assets and examined if there was a coalition (or single element) that was allocated higher risk than it had on a stand-alone basis. We generated 5000 correlation matrices (considering both running time and the stability of the result) and to all of them random time series of 500 elements (that means two years data if we assume to have 250 trading days a year).
As a second approach we generated return time series from a copula. Because of the presence of simultaneous extreme returns in real life copulas should be even better in modeling the returns of financial assets. We chose Clayton-copula for this purpose as it assumes lower tail dependence and that is what we normally observe on financial markets. The problem we faced was that using Clayton-copula we could only generate positively correlated variables. So we modified this method by multiplying all simulated time series by randomly plus or minus one (we will denote this by Clayton-copula II later). This way we could handle the problem of positive correlation but meanwhile we lost the property that it results higher correlation in periods of turmoil. Even though if for example we look at what has happened when the crisis reached Hungary we could observe that equity and currency exchange rates were falling dramatically at the same. Considering a portfolio consisting of Hungarian equities and foreign currency the value of the former was steeply decreasing while the other remarkably appreciated. Because of the unfavorable results that we got from the simulation with copulas (detailed later in this Section) we only ran this type of simulation for three players.
Of course, in both cases we wanted to know how many percent of the examined cases resulted core compatible allocation. The closer is the ratio of core compatible outcomes to one the better the method is, naturally.
First of all let us present a graph that shows how different methods allocate risk to make the purpose of the simulation clearer (Graph 1). In the case illustrated on the Graph we had three
11
players (divisions). It is generated from t-distribution, applying 99% significance level and the following (arbitrarily chosen) correlation coefficients: , and standard deviation for all the three assets.
Graph 1: Comparison of the allocations resulted by different methods
In this case Euler- and cost gap methods resulted core compatible allocations but not the others (the graph shows that the risk of the grand coalition is the same for all cases as it was computed uniformly with ES). The condition of core compatibility was violated by asset 2 in case of the incremental method, by the coalition consisting of asset 1 and 3 in case of Shapley and activity based method and by coalition consisting of asset 1 and 2 in case of beta method. On the graph this can be observed from the fact that the red column (that shows the stand-alone risk of the asset or coalition) is shorter than the column belonging to a specific method. The graph also shows that in our example Euler and cost gap methods are allocating the risk quite similarly (they both result the same order respect to the value of the allocated capital, but form the remaining four methods only one, the Shapley-method results the same order). This will be in line with our results. So let us now move to them.
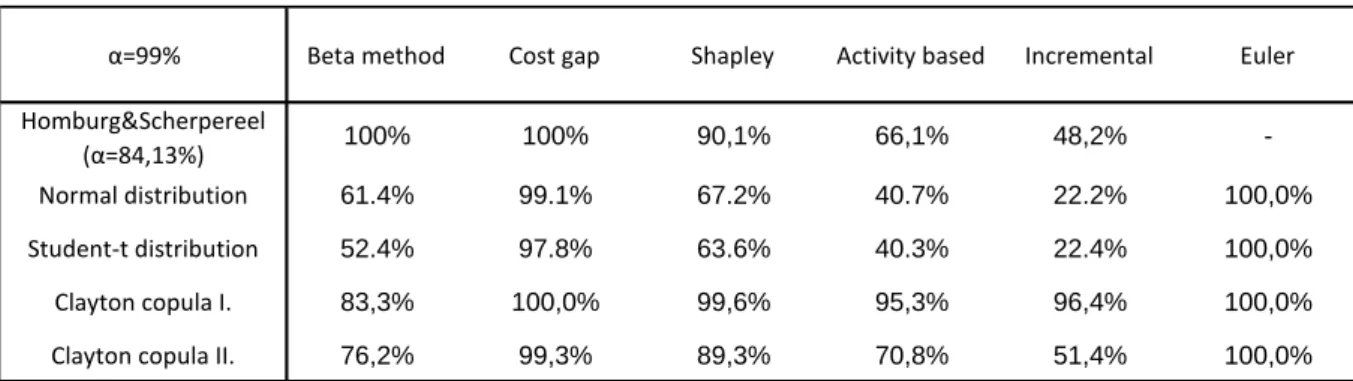
We illustrate the results of our simulations for three players in Table 1. As we mentioned earlier, the closer the ratio of core compatible outcomes is to one the better the method is. We ran every simulation using three different significance levels (84.13%, 95% and 99%) but as we could not observe a remarkable difference we will only give the results for 99% here. The table also contains the results of Homburg and Scherpereel [2008] that enables us for
0,0 1,0 2,0 3,0 4,0 5,0 6,0 7,0 8,0 9,0 Stand-alone risk Activity based Incremental Shapley Beta Cost Gap Euler
12
comparison of the results. They used α=84.13% confidence level but as aforementioned it did not mean problem as ratios did not significantly change when we chose another significance level.
Table 1: The ratio of core-compatible allocations with three players
As the table shows we found that cost gap and Euler methods were much better than the others when we employed ES as risk measure. In most cases incremental and activity based methods showed relatively poor performance. The Shapley and the beta methods performed better than the former two that means they obeyed the criterion of core compatibility around 60% of the cases. We believe that this is still too weak performance for practical application. We also would like to draw attention briefly to the fact the when we used Clayton copula (I) the results were significantly different from normal or t-distribution: even the worst result was more than 83%. This shows us how dangerous it is to use copulas in modeling. The reason of this is that during risk estimation we concentrated only on the lower tail of the distribution and that is where the correlation coefficient is very close to 1. This is why we also needed the Clayton copula II denoted running (where we multiplied the time series randomly by 1 and -1). Therefore we did not run the simulation with copulas for four players.
The results of the simulation with four players are presented in Table 2. Here we also added the results of Homburg and Scherpereel [2008].
Table 2: The ratio of core-compatible allocations with four players
α=99% Beta method Cost gap Shapley Activity based Incremental Euler Homburg&Scherpereel
(α=84,13%) 100% 100% 90,1% 66,1% 48,2% -Normal distribution 61.4% 99.1% 67.2% 40.7% 22.2% 100,0%
Student-t distribution 52.4% 97.8% 63.6% 40.3% 22.4% 100,0%
Clayton copula I. 83,3% 100,0% 99,6% 95,3% 96,4% 100,0%
Clayton copula II. 76,2% 99,3% 89,3% 70,8% 51,4% 100,0%
α=99% Beta method Cost gap Shapley Activity based Incremental Euler Homburg&Scherpereel
(α=84,13%) 100% 99.9% 85.4% 50.1% 34.8% -Normal distribution 47,6% 96,7% 44,9% 17,5% 8,1% 100,0%
13
Comparing the ratios of core compatible allocations with four players to the result we got with three players we can generally say that the ratio of core compatible allocations is decreasing as we increase the number of players. The only exception is Euler method that still satisfies the criteria in all cases. Cost gap method also still performs well. Its results have only worsened slightly (around 3%) compared to the other methods’ performances that have decreased by at least 14%. The results of the simulation with four players outline the fact the Euler method and cost gap method are the only possible candidates for capital allocation if we would like to get core compatible allocations.
6
Further properties of the Euler method
The simulation showed that the best performing methods were cost gap and Euler method. Nevertheless between these two methods a big difference can be observed if we also consider how easy is the application of a method – that is also a very important practical standpoint. No doubt that from this point of view Euler method is the better one, as it can be calculated by the average return of the assets in the α% of the worst cases (regarding the grand coalition). This can be done easily even if we have a large number of portfolio elements. However if we choose cost gap method the increments and the correction factors can be easily calculated as long as we consider three or four assets but it becomes very complicated and time-consuming when we want to count it in case of more assets.
On this basis Euler method seems a hopeful candidate for practical application. In this section we will have a look at its other properties to decide if it indeed can be suggested for that purpose. First of all Buch and Dorfleitner [2008] showed that – using gradient method for capital allocation – there are links connecting the axioms of coherent measures of risk and capital allocation rules:
subadditivity of the risk measure implies core compatibility of the allocation (that is confirmed by our simulation) and
translation invariance of the risk measure implies the fulfillment of riskless allocation. As Expected Shortfall is a coherent measure of risk the capital allocation resulted by ES based Euler method also satisfies the axiom of riskless allocation. Nevertheless it is shown by Tasche [2008] that this is the only RORAC-compatible capital allocation method.
14
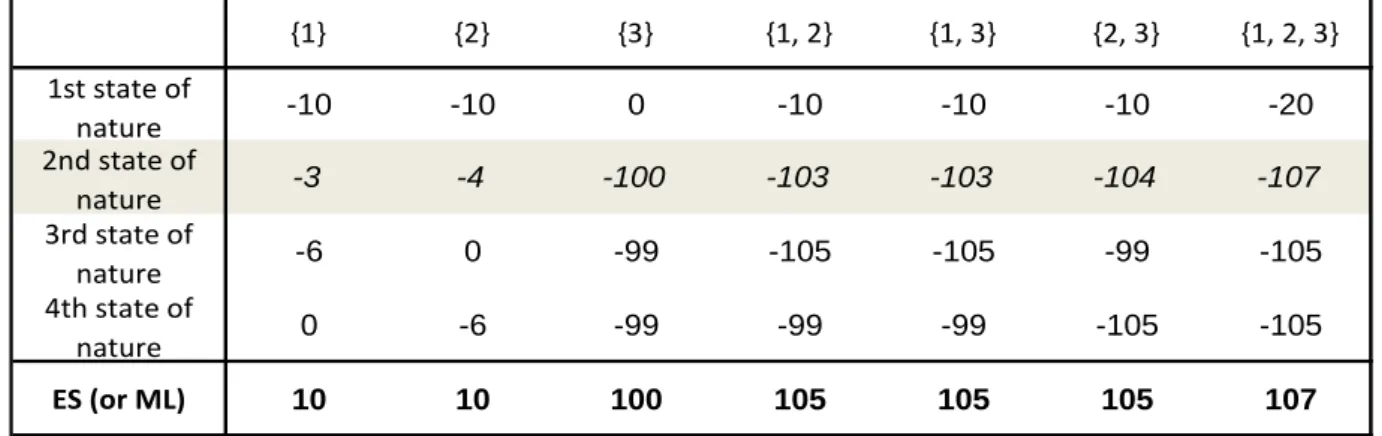
Regarding symmetry, the only criterion left, Buch and Dorfleitner [2008] showed that if we use the gradient allocation principle symmetry property implies linearity of the underlying risk measure, that do not allow for diversification effects. As ES is not linear, symmetry is the only criterion that is not fulfilled by the Euler method on ES basis. To illustrate the situation where the Euler method is not symmetric let us consider the following situation. We only have four possible states of nature (just for simplicity) and three players. The first three columns of the Table 3 contain the payoffs of the players in the different states of nature. In the following columns these are added to calculate payoffs of the coalitions consisting of two players and the large coalition. As we only have four states of nature, ES calculated on any significance level higher than 75% coincides with the maximum loss.
Table 3: The example for Euler method being not symmetric
In this situation players 1 and 2 are symmetric as they add the same risk to the empty coalition (10) and to player 3 also (5). However if we allocate the risk of the grand coalition (107) Euler method allocates 3 units on player 1 and 4 units on player 2, so the allocation does not fulfill the criterion of symmetry.
7
Summary
The subject of the paper was to find out if there is any capital allocation method that results optimal allocation from every point of view that means it both satisfies the axioms of full allocation, core compatibility, symmetry, riskless allocation and it is also simple enough to be used in real life. We presented six different methods and examined using simulation if they satisfy core compatibility when we consider portfolios consisting of first three, then four elements. We found that Euler and cost gap method obey core compatibility in nearly 100% of the cases, but when we compare them we see that Euler method is much easier to employ as calculation of cost gap method becomes extremely difficult when we have many divisions.
{1} {2} {3} {1, 2} {1, 3} {2, 3} {1, 2, 3} 1st state of nature -10 -10 0 -10 -10 -10 -20 2nd state of nature -3 -4 -100 -103 -103 -104 -107 3rd state of nature -6 0 -99 -105 -105 -99 -105 4th state of nature 0 -6 -99 -99 -99 -105 -105 ES (or ML) 10 10 100 105 105 105 107
15
Therefore we investigated further properties of our only left candidate, Euler method. Summarizing its properties we can say that:
ES is a coherent measure of risk i.e. it is subadditive, monotone, positive homogenous and translation invariant;
the allocation is core compatible, satisfies the riskless allocation axiom;
it is the only method suitable for performance measurement (RORAC-compatible); and it is easy to apply even if we have an arbitrary large number of divisions and therefore has all the desirable properties but symmetry.
As we found that Euler method does not satisfy the symmetry property the answer to our question is negative, as none of the methods fulfill all the five examined criteria. Even though we believe that we presented a method that might be suggested for practical application in financial institutions.
References
Artzner, P. – Delbaen, F. – Eber, J.-M. – Heath, D. (1999): Coherent Measures of Risk.
Mathematical Finance Vol. 9. No. 3. pp. 203-228.
Aumann R.J. – Shapley L. S. (1974): Value of Non-atomic Games. Princeton University Press, Princeton.
Balogh, Cs. (2006). Felmérés a banki belső tőkeallokáció hazai alkalmazásáról (Survey on the application of internal capital allocation methods in Hungary). Hitelintézeti Szemle, Vol 5. No 4. pp. 32-34.
Buch, A. – Dorfleitner, G. (2008): Coherent Risk Measures, Coherent Capital Allocation and the Gradient Allocation Principle. Insurance: Mathematics and Economics Vol. 42. No. 1. pp. 235-242.
Csóka, P. – Herings, P. J. J. – Kóczy, L. Á. (2007): Coherent Measures of Risk from a General Equilibrium Perspective. Journal of Banking and Finance Vol. 31. No. 8. pp. 2517-2534.
Csóka, P. – Herings, P. J. J. – Kóczy, L. Á. (2009): Stable allocations of risk. Games and Economic Behaviour Vol. 67. pp. 266-276.
16
Csóka, P. – Pintér, M. (2011): On the Impossibility of Fair Risk Allocation. Working paper. http://econ.core.hu/file/download/mtdp/MTDP1117.pdf
Denault, M. (2001): Coherent Allocation of Risk Capital. Journal of Risk Vol. 4. No. 1. pp. 1-34.
Hamlen S. S. – Hamlen W. A. – Tschirthart J. T. (1977): The Use of Core Theory in Evaluating Joint Cost Allocation Games. The Accounting Review Vol. 52, pp. 616-627.
Homburg, C. – Scherpereel, P. (2005): Risikokapitalallokation in deutschen Banken: Ergebnisse einer Umfrage. Zeitschrift für Controlling & Management Vol. 49. No. 4. pp. 296-301.
Homburg, C. – Scherpereel, P. (2008): How Should the Joint Capital be Allocated for Performance Measurement? European Journal of Operational Research Vol. 187. No. 1. pp. 208-217.
Jorion, P. (2007): Value at Risk: The New Benchmark for Managing Financial Risk. McGraw-Hill.
Panjer, H. H. (2002): Measurement of risk, solvency requirements and allocation of capital within financial conglomerates. Research Report 01-14. Institute of Insurance and Pension Research, University of Waterloo.
Shapley, L.S. (1953): A value for n-person games. In: Kuhn, H. W. – Tucker, A.W. (eds.)
Contributions to the Theory of Games II. Princeton University Press, Princeton. pp. 307-317. Tasche, D. (2000): Risk contributions and performance measurement. Working Paper.
http://www-m4.ma.tum.de/pers/tasche/riskcon.pdf
Tasche, D. (2008): Capital Allocation to Business Units and Sub-Portfolios: the Euler Principle. In: Resti, A. (ed.) Pillar II in the Basel Accord:The Challenge of Economic Capital. Risk Books, 2008. Preprint available from
http://arxiv.org/PScache/arxiv/pdf/0708/0708.2542v3.pdf
Tijs, S.H. – Driessen, T.S.H. (1986): Game theory and cost allocation problems. Management Science Vol. 32. pp. 1015-1028.
Discussion Papers published in 2011
Mihályi Péter: Utolérési kísérletek Magyarországon, 1870-2030. MT-DP 2011/1
Zsolt Darvas - Jean Pisani-Ferry: The Threat of 'Currency Wars': A European Perspective. MT-DP 2011/2
Zsolt Darvas: Beyond the Crisis: Prospects for Emerging Europe. MT-DP 2011/3
Barnabás M. Garay - András Simonovits - János Tóth: Local Interaction in Tax Evasion.
MT-DP 2011/4
Maria Csanadi: Varieties of System Transformations and Their Structural Background Based on the IPS Model. MT-DP 2011/5
Mária Lackó: The Poor Health Status of the Hungarians; Comparative Macro-Analysis of the Likely Explanatory Factors on Hungarian and Austrian Data, 1960-2004. MT-DP 2011/6
Fazekas Károly: Közgazdasági kutatások szerepe az oktatási rendszerek fejlesztésében. MT-DP 2011/7
Gábor Kézdi - Gergely Csorba: Estimating the Lock-in Effects of Switching Costs from Firm-Level Data. MT-DP 2011/8
Antal-Pomázi Krisztina: A kis- és középvállalkozások növekedését meghatározó tényezők - A különböző finanszírozási formák hatása a vállalati növekedésre. MT-DP 2011/9
Zsolt Darvas - Jean Pisani-Ferry - André Sapir: A Comprehensive Approach to the Euro-Area Debt Crisis. MT-DP 2011/10
András Simonovits: International Economic Crisis and the Hungarian Pension Reform. MT-DP 2011/11
András Simonovits: The Mandatory Private Pension Pillar in Hungary: An Obituary. MT-DP 2011/12
Horn Dániel: Az oktatási elszámoltathatósági rendszerek elmélete. MT-DP 2011/13 Miklós Koren - Márton Csillag: Machines and machinists: Capital-skill
complementarity from an international trade perspective. MT-DP 2011/14 Áron Kiss: Divisive Politics and Accountability. MT-DP 2011/15
Áron Kiss: Minimum Taxes and Repeated Tax Competition. MT-DP 2011/16
Péter Csóka - Miklós Pintér: On the Impossibility of Fair Risk Allocation. MT-DP 2011/17
Gergely Csorba - Gábor Koltay - Dávid Farkas: Separating the ex post effects of mergers: an analysis of structural changes on the Hungarian retail gasoline market. MT-DP 2011/18
Helga Habis and P. Jean-Jacques Herings: Core Concepts for Incomplete Market Economies. MT-DP 2011/19
Helga Habis and P. Jean-Jacques Herings: Transferable Utility Games with Uncertainty. MT-DP 2011/20
Valentiny Pál: Árukapcsolás és csomagban történő értékesítés: jogesetek és közgazdasági elmélet. MT-DP 2011/21
Seres Antal – Felföldi János – Kozak Anita – Szabó Márton: Termelői szervezetek zöldség-gyümölcs kisárutermelőket integráló szerepe a nagy kereskedelmi láncoknak történő értékesítésben. MT-DP 2011/22
Tamás Fleiner – Balázs Sziklai: Notes on the Bankruptcy Problem: an Application of Hydraulic Rationing. MT-DP 2011/23
Zoltán Hermann – Dániel Horn: How inequality of opportunity and mean student performance are related? A quantile regression approach using PISA data. MT-DP 2011/24
Dávid Csercsik - László Á. Kóczy: Externalities in the games over electrical power transmission networks. MT-DP 2011/25
Discussion Papers are available at the website of Institute of Economics Hungarian Academy of Sciences: http://econ.core.hu