85th Annual Conference of the Agricultural Economics Society Warwick University
18 - 20 April 2011
The Economic Role of Nigeria’s Subsistence Agriculture in the Transition
Process: Implications for Rural Development
By
Apata, T.G*., Folayan, A*, Apata, O.M**. and Akinlua, J* *Department of Agricultural Economics and Extension Services, Joseph Ayo Babalola University, Ikeji Arakeji, P.M,B. 5006 Ilesa, Nigeria
e-mail: [email protected]
**Department of Agricultural Economics and Extension Services, University of Ado-Ekiti, Ekiti State.
Copyright 2011 by Apata, T.G., Folayan, A, Apata, O.M. and Akinlua, J.
All rights reserved. Readers may make verbatim copies of this document for non-commercial purposes by any means, provided that this copyright notice appears on all such copies.
Abstract
This study examined the role of subsistence-oriented agriculture in Nigeria in the 1990s to 2000s. The start out by discussing the diverging economic effects of the growth of subsistence agriculture in Nigeria since the transition process started. The quantitative analysis of this sector’s role is carried out by means of an applied Computable General Equilibrium (CGE) model applying a 1994 Social Accounting Matrix (SAM) as base year data. The innovation of the article is to disaggregate primary agricultural production not by products but by farm types, which enables us to distinguish their institutional and economic characteristics. The study simulates two Structural Adjustment Programme (SAP) of the government. The results of the post SAP period highlight that Nigeria’s subsistence agriculture was an important shock absorber against further agricultural output declines during transition. A simulation, which looks into the effects of a devaluation of the Nigeria Naira, shows that the financial crisis should have increased the relative competitiveness particularly of large-scale crop farms versus small-scale farms. The reforms of successive governments show that efficiency enhancing institutional change would benefit both large-scale and small-scale farms. However, within small-scale agriculture, a shift from subsistence to commercial agriculture would take place.
Keywords: Subsistence agriculture; CGE model; Exchange rate; Institutional Development, Structural Constraints, Nigeria
1. Introduction
The debate on the relationship between subsistence agriculture and rural development in Nigeria has gone through a complete circle (Spencer, 2002; Poulton et al, 2005; Lipton, 2005). Evidence from literature and past studies have identified this region as one of the world’s poorest, and the region’s economies are heavily depended on agriculture as the primary source of income and food. Researchers have also shown that most of the poorest households in SSA are found in agriculture (Ikpi, 1989; Okunmadewa, 2002; Spencer, 2002; Alayande and Alayande, 2004; Poulton et al, 2005;Apata, 2006). However, these subsistence farmers play an important role for food security with an average farm size ranges between 0.7-2.2 hectares. In spite of the existence of a well-articulated agricultural policy document for Nigeria since 1988 and transitional processes put in place by successive governments, the country has never established a systematic focus in her agricultural planning history that shows a conscious effort to purposely prioritize her agricultural
and rural development based on the generally identified components that constitute modern agriculture (Sanusi, 2010, ANAP, 2006). A substantial share of agricultural production was produced in small-scale production units. During the transitional period of Structural Adjustment Programme (SAP) and post SAP the production share of the small-scale agricultural producers were mainly subsistence (CBN, 2008). It is evidenced that in the transition process this sector has played a buffer role against food insecurity and thus prevented households from falling into absolute poverty. This study examined the role of subsistence-oriented agriculture in Nigeria in the 1990s to 2000s. The study start out by discussing the diverging economic effects of the growth of subsistence agriculture in Nigeria since the transition process started. In addition, the study presented an applied Computable General Equilibrium (CGE) model to simulate two Structural Adjustment Programme (SAP) adopted by government, which has been tailored to address the diverging role of subsistence agriculture in Nigeria’s transition process. The originality of the model is to distinguish various agricultural sectors not by production but by institutional characteristics. One of these farm sectors explicitly represents Nigeria’s vast number of subsistence plots.
The economy-wide models such as CGE models have been identified by past studies to analyze macroeconomic policies and strategies for the development of agriculture in developing countries where subsistence agriculture plays an essential role (Hassine, et al, 2010; Nwafor et al, 2005; Wobst, 2001; Bautista and Thomas, 2000). Though, there are few such CGE models for transition countries thus far. For instance, the work of Beckmann and Pavel (2001) developed a stylized CGE model for Bulgaria agriculture with 2 production sectors and a household sector producing food. Wehrheim and Wobst, (2005) work represents subsistence agriculture as a separate model in an applied CGE model. These studies examined the competiveness of small-scale farms and the relative importance in the transitional process in rural development. In Nigeria, CGE models have been widely used to analyze the macroeconomics policies and strategies. Nwafor et al, (2005) used micro simulations in a CGE model to capture the impacts of trade liberalization on poverty in Nigeria. Also, the work of Omoke (2007) used CGE model to analyze trade policy reforms and rural development in Nigeria. However, no study in Nigeria (to the knowledge of the authors) that have applied CGE model to analyze the macroeconomic policies and strategies for the development of agriculture where subsistence agricultural plays a pivotal. The uniqueness of this article is to disaggregate agriculture not by production sector but by different types of farms. In so doing, we will be able to analyze quantitatively the role of subsistence agriculture in Nigeria’s transition process.
2. Nigeria’s Agricultural Sector in the Transition Period
Nigeria is the single largest geographical unit in West Africa. It occupies a land area of 923,768 square kilometres and lies entirely within the tropics with two main vegetation zones; the rain forest and Savannah zones, reflecting the amount of rainfall and its spatial distribution. Structurally, the Nigerian economy can be classified into three major sectors namely primary/agriculture and natural resources; secondary—processing and manufacturing; and tertiary/services sectors. The economy is characterized by structural dualism. The agricultural sector is an admixture of subsistence and modern farming, while the industrial sector comprises modern business enterprises which co-exist with a large number of micro-enterprises employing less than 10 persons mainly located in the informal sector. The agricultural sector has not been able to fulfil its traditional role of feeding the population, meeting the raw material needs of industries, and providing substantial surplus for export. Indeed, the contribution of the sector to total GDP has fallen over the decades, from a very dominant position of 55.8 per cent of the GDP in 1960-70 to 28.4 per cent in 1971-80, before rising to 32.3, 34.2 and 40.3 per cent during the decades 1981-90, 1991-2000 and 2001 – 2009, respectively (Table 1). The fall is not because a strong industrial sector is displacing agriculture but largely as a result of low productivity, owing to the dominance of subsistence farmers and their reliance on rudimentary farm equipment and low technology. Another feature of the sector is
under-capitalization which results in low yield and declining output, among others (Sanusi, 2010; CBN, 2008).
Table 1: Sectoral Contribution to GDP
Activity Sector 1960-1970 1971-1980 1981-1990 1991-2000 2001-2009 1. Agriculture 55.8 28.4 32.3 34.2 40.3 2. Industry 11.3 29.1 41.0 38.6 28.4 3. Manufacturing 6.6 7.3 6.1 4.9 3.9 4. Building & Construction 4.8 8.3 2.3 1.8 1.8 5. Wholesale
& Retail Trade 12.8 17.6 14.5 13.8 14.0 6. Services 15.3 16.5 9.8 11.5 15.5 TOTAL Value Added 100.0 100.0 100.0 100.0 100.0 Diversification Index 0.2 0.4 0.4 0.4 0.3 Source: National Bureau of Statistics (2011)
The size-distribution of farm holdings in Nigeria are categorized as: Small-scale farms, ranges from 0.10 to 5.99-hectares, medium scale, 6.0-9.99 and large scale above 10 hectares. These classes constituted 84.49 percent, 11.28 percent and 4.23 percent respectively in 2004 (Olayide et al, 1980, Oksana, 2005, Antman and Mckenzie, 2005, Dorward et al, 2005, NBS, 2006). When judged by international standards, whereby all farms less than 10.00 hectares are classed as small, then 95.77 percent of all farm holdings in Nigeria as at 2004 (or a total of 46.08 million holdings) must be classified as small-scale farms, while the remaining 4.23 percent of all holdings (or 2.033 million holdings) as medium-scale. Table 2 revealed that marginal and small farms in Nigeria constitute about 80 percent of all the Total farm holdings.
Table 2: Farm Size Demographics, Nigeria
Category Size (ha) Average Size (ha) Total Holdings (%) Area (%) Irrigated Area (%) Marginal Farms < 1.0 23 56 23 0.3 Small Farms 1-2 1.42 24 36 2.2 Semi-medium 2-4 2.69 11 21 21.8 Medium 4-10 4.87 06 11 33.7 Large > 10 13.51 03 9 42.2 All farms 2.25 100 100 100.0 Source : Federal Ministry of Agriculture and Water Resources, F.C.T. Abuja, 2009 : National Bureau of Statistics, Abuja, Nigeria, 2009 (www.nigerianstat.gov.ng)
:Akinyosoye, 2006 : ANAP, 2005 :Olayide et al, 1980 3. Conceptual Framework
Computable General Equilibrium (CGE) models are a class of economic models that use actual economic data to estimate how an economy might react to changes in policy, technology or other external factors. A CGE model consists of (a) equations describing model variables and (b) a database (usually very detailed) consistent with the model equations. The equations tend to be neo-classical in spirit, often assuming cost-minimizing behaviour by producers, average-cost pricing, and household demands based on optimizing behaviour. However, most CGE models conform only loosely to the theoretical general equilibrium paradigm. The CGE model for Nigeria is developed along the lines of models as described in Lofgren et al. (2002) and used by Wehrheim and Wobst, (2005). To reflect some of the features characteristic for the Nigerian economy in transition, the study have modified the standard CGE model by reducing the full mobility of economic resources. Therefore, the study combine standard neoclassical behaviour with economic features that are the
result of imperfect markets or structural rigidities, because of which our model can best be classified by “neo- classical structuralism” (Robinson, 1989).
Various features of the Nigerian economy in the transition has displayed that the use of purely neoclassical model for economic analyses would be inappropriate (Sanusi, 2010). The neoclassical theory assumes that producers minimize their costs under the conditions of a neoclassical production function. Furthermore, it is assumed that producers maximize their revenues from domestic sales and exports under the restriction of a constant elasticity of transformation/CET function. On the other hand Consumers maximize their utility subject to a budget constraint. Final demand of households for consumption goods is determined through a Linear Expenditure System (LES) using fixed minimum expenditure quantities and fixed marginal expenditure shares.
4. Methodology
The study describes the development of a dynamic CGE model of the Nigerian economy to analyse the impacts of different policy scenarios over time. The dynamic model is an extension of the static, standard CGE model in Lofgren et al. (2002). Apart from tracing the growth in population and production factors (labour, capital and land) over time, it also extends the earlier model by endogenizing the process of technical change, incorporating links between, on the one hand, factor productivity and, on the other hand, government spending and openness to foreign trade. The model is described in terms of a ‘within-period’ module, modelling the behaviour of the economy across a particular year, and a ‘between period’ module linking the behaviour of the economy between years. The ‘within-period’ module is based on a 1994 Social Accounting Matrix (SAM) derived from data obtained from National Bureau Statistics (NBS). The SAM was used disaggregate primary agricultural production not by products but by farm types, which enables the study to distinguish institutional and economic characteristics. The study simulates two Structural Adjustment Programme (SAP) pre and post SAP era.
4.1 Econometric Estimation
The growth rate of agricultural productivity in country i at time t is then given by: Qit = βi + β1Kit + β2ITitβax KitβH + (-GAPit) + Vit (1)
where Q is agricultural total factor productivity (TFP); K is the human capital level measured by average years of schooling in the population over age 25; IT is an index of international trade captured by two alternative variables namely, total agricultural trade as a share of GDP and agricultural tariff barriers; and GAP is the technology gap measured by the distance from the technological frontier to capture the potential for technology transfer, and β are parameters to be estimated. is a country-specific constant and Vit is an error term. The dot indicates the growth rate. 1 2 op Kit.
In order to estimate equation (1), measures of agricultural TFP and of technology gap are required. The common approach to estimating agricultural efficiency and multifactor productivity is the stochastic frontier model. Based on the econometric estimation of the production frontier, the efficiency of each producer is measured as the deviation from maximum potential output. Evenly productivity change is computed as the sum of technology change, factor accumulation, and changes in efficiency. A major limitation of this method is that all producers are assumed to use a common production technology. However, farmers that operate in different countries under various environmental conditions and resources endowments might not share the same production technologies. Ignoring the technological differences in the stochastic frontier model may result in biased efficiency and productivity estimates as unmeasured technological heterogeneity might be confounded with producer-specific inefficiency (Orea and Kumbhakar, 2004). The recently proposed latent class stochastic frontier model (LCSFM) has been suggested as suitable for
modeling technological heterogeneity. This approach combines the stochastic frontier model with a latent sorting of farmers (or countries) in the data into discrete groups. Individuals within a specific group are assumed to share the same production possibilities, but these are allowed to differ between groups. Heterogeneity across countries is accommodated through the simultaneous estimation of the probability for class membership and a mixture of several technologies (Orea and Kumbhakar, 2004; Greene, 2005). The latent class framework assumes the simultaneous coexistence of J different production technologies. There is a latent clustering of the countries in the sample into J classes, unobserved by the analyst. We assume that a country from class j is using a technology of the Cobb Douglas form:
In (yit) = In f (βitβj) + Vit/j – Uit/j (2)
subscript i indexes countries (i: 1…N), t (t: 1…T) indicates time and j (j: 1, …, J) represents the different groups. j is the vector of parameters for group j, yit and xit are, respectively, the production level and the vector of inputs. vit|j is a two-sided random error term which is independently distributed of the non-negative inefficiency component uit|j.8
Q = TC + TE + Scale (3)
The productivity change can be estimated using the tri-partite decomposition (Kumbhakar and Lovell, 2000): where is the growth rate of agricultural TFP, is technical change which measures the rate of outward shift of the best-practice frontier, represents the change in the inefficiency component over time, and is the scale effect when inputs expand over time. is the sum of all the input elasticities .
Qagr = Qagrya (QagrLPpre) (QagrDPpost) (4)
We express agricultural TFP as a function of labor augmenting technical progress, AL, and land augmenting technical progress
Qj = β1 ( Gpre)βH + β2(Gpre ) (Total)βH ( 1 – Qj)
GDP GDP Xij Qf (5) In the case of non agriculture sectors, TFP is simply a function of the labor augmenting technical progress: where Qj is the proportional change in sectoral domestic TFP, QF is the level of productivity in the frontier country, G is public expenditure, Tradej is total trade of sector J, GDP is gross domestic product and XSj is sectoral output. The ratio of public expenditure to GDP captures the share of public expenditures on education and is used to proxy the level of human capital. The share of trade to output measures the degree of the sector openness. Qj/QF is the technology gap and captures the potential for technology transfer. β1, β2, βH, βop and QF are estimated
econometrically from equation (1).
The inefficiency effect model and the productivity growth equation incorporate an array of control variables representing trade openness, human capital, land holdings, agricultural research effort, land quality, and institutional quality.
Two different measures are used to proxy the degree of trade openness of each country: the ratio of agricultural exports plus imports to GDP and agricultural trade barriers. Agricultural commodities are currently protected with a complex system of ad-valorem tariffs, specific tariffs, tariff quotas, and are subject to preferential agreements. The determination of the appropriate level of protection is a fairly complex task. The MacMap database constructed by the CEPII provides ad-valorem tariffs, and estimates of ad-valorem equivalent of applied agricultural protection, taking into
account trade arrangements (Bouët et al. 2004). Our data on agricultural trade barriers are drawn from this database.21
Human capital is proxied by the average years of schooling in the population over age 25 and is included to capture the impact of labour quality and the ability to absorb advanced technology. Land holdings include land fragmentation, which is controlled for by the percent of holdings under five hectares; inequality in operational holdings, measured by the land Gini coefficient; and average holdings approximated by the average farm size. Agricultural research effort is measured by public and private R&D expenditures. Land quality is measured by the percent of land under irrigation. Institutional quality includes various institutional variables considered as indicators of a country’s governance, namely, political stability, government effectiveness and control of corruption. These variables reflect the ability of the government to provide sound macroeconomic policies and impartial authority to protect property rights and enforce contracts. Improved institutional quality is thought to enhance farming efficiency and productivity, as it may facilitate human capital accumulation, appropriate technology adoption and provision of rural infrastructure (Self and Grabowski, 2007; Vollrath, 2007).
As determinants of the latent class probabilities, we consider country averages of five separating variables: total agricultural machinery, total applied fertilizers, agricultural land, average holdings and rainfall levels. Machinery and fertilizers help to identify countries endowed with modern inputs. Average farm size captures the differences in the scale of agricultural holdings across countries and distinguishes countries with an important proportion of small farms (Vollrath, 2007). Agricultural land and rainfall levels capture the influence of resources endowments and climatic conditions on class membership.
5. Results and Discussion
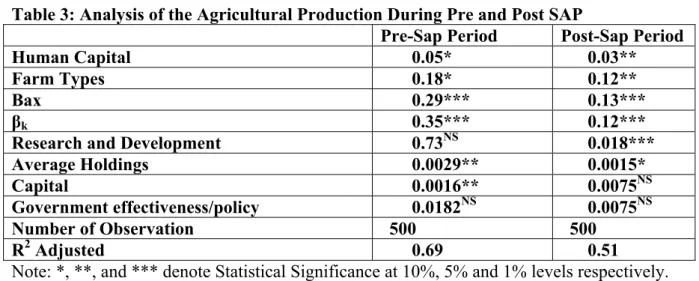
Table 3 reports the estimation of the agricultural production during the pre and post SAP using SAM base of 1994. The results lend strong support to the positive effect of trade openness on agricultural productivity growth. Across the regressions, TFP growth rate increases with higher trade shares and decreases with more trade barriers. These estimates provide interesting insights into the agricultural productivity dynamics. The interaction term highlights the role of international trade in promoting technology transfer and point to the importance of education in facilitating the assimilation of foreign improvement of technology. The findings suggest that subsistence farmers lying behind the frontier enjoy greater potential for TFP growth through the speed of technology transfer. The linear effect of human capital on TFP provides also some support to the role of educational attainment in enhancing domestic innovation in agriculture.
There are also interesting results regarding the effect of the control variables on agricultural productivity growth. The findings provide evidence on the positive contribution of agricultural research efforts and larger farm sizes to productivity improvement. Control of government effectiveness/policy and political stability enter with positive and statistically significant coefficients, indicating a positive role of institutional quality in enhancing agricultural growth. In summary, government support and complete removal of agricultural tariffs as well as the full liberalization of trade in all sectors result in a reduction of domestic prices, an increase in import demand and a decline of domestic demand for local production. With a downward rigidity of nominal wages and given the rise in the real wage rate, output and employment decrease resulting in a lower GDP. While local producers respond to the price variations by reorienting their production toward the export market, the export expansion is not enough to offset the reduction in local sales.
Table 3: Analysis of the Agricultural Production During Pre and Post SAP
Pre-Sap Period Post-Sap Period
Human Capital 0.05* 0.03**
Farm Types 0.18* 0.12**
Βax 0.29*** 0.13***
βk 0.35*** 0.12***
Research and Development 0.73NS 0.018***
Average Holdings 0.0029** 0.0015*
Capital 0.0016** 0.0075NS
Government effectiveness/policy 0.0182NS 0.0075NS
Number of Observation 500 500
R2 Adjusted 0.69 0.51
Note: *, **, and *** denote Statistical Significance at 10%, 5% and 1% levels respectively. NS: Not Significance
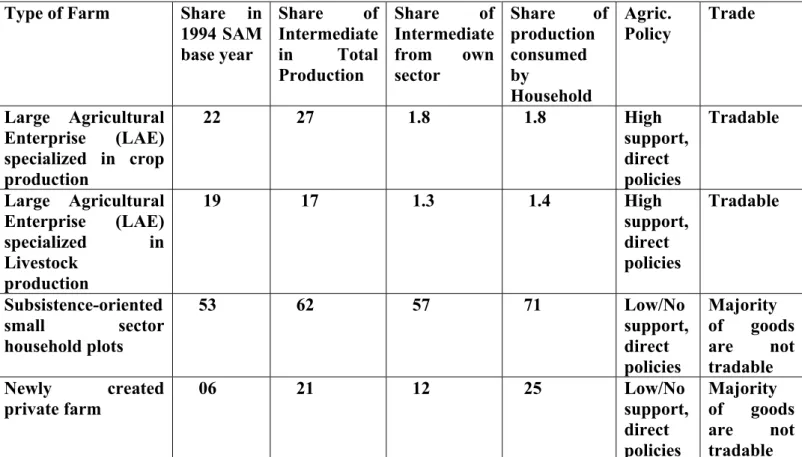
Table 4 provides an overview of the key features that characterize the structure of the four farm types in our model and, hence, points out the major differences among them. First, there are differences in size and input–output structure (columns 2–4). For instance, the share of intermediates is much higher in the two sectors representing the LAEs. This reveals the fact that these enterprises are more market-oriented, also with respect to inputs, at least when compared to the small-scale producers in the household sector and the private farms, which often suffer from insufficient access to input markets due to various market imperfections (e.g., for the Russia: Wehrhein and Wobst, 2005). Additionally, about half of the intermediate inputs (12.5% of total production costs) used in the subsistence sector’s production process stem from the sector itself. In contrast, there are at least some private farms that attempted early on in the transition period to improve their efficiency by buying inputs and new machines from the market.
Second, the four farm sectors rely on different marketing channels. While the two large-scale sectors channel most of their produce through the formal market, the two small-large-scale sectors do not. Particularly the household plot sector circumvents the formal market. A major share of the output of the small-scale agricultural sector (71% in Table 4) does not reach the formal market. Instead households “buy” the commodity directly from the activity account of the house- hold plot sector. The share of the subsistence goods in total household demand in non-agricultural, non-food industry sectors has been kept at 0 because reliable information about the share of self-produced goods for instance in the service sector were not available when the model was developed.
Therefore, any changes in terms of trade will directly affect the large-scale sectors. In contrast, the two small sectors will be affected only indirectly, for instance, via income effects. The data reveal the difference between households’ market demand (from commodities markets) and subsistence demand (from activities). Households spend 71% of share of production that is consumed. Consequently, food prices are highly decisive for households’ welfare. The increase in own-household consumption also indicates that subsistence agriculture has indeed been a buffer for households against falling food security because of rising prices for food commodities produced in the domestic large-scale sector and imported food. In contrast, the increase in domestic output of subsistence agriculture does not translate into higher formal domestic sales because in this marketing channel higher transaction costs are encountered.
Table 4: Classification of Agricultural Production in Nigeria and Major Characteristics in the Model
Type of Farm Share in 1994 SAM base year Share of Intermediate in Total Production Share of Intermediate from own sector Share of production consumed by Household Agric. Policy Trade Large Agricultural Enterprise (LAE) specialized in crop production 22 27 1.8 1.8 High support, direct policies Tradable Large Agricultural Enterprise (LAE) specialized in Livestock production 19 17 1.3 1.4 High support, direct policies Tradable Subsistence-oriented small sector household plots 53 62 57 71 Low/No support, direct policies Majority of goods are not tradable Newly created private farm 06 21 12 25 Low/No support, direct policies Majority of goods are not tradable
CGE Model applying a 1994 SAM as base year data on which Model Simulation are based Source: Central Bank of Nigeria, Statistical Bulletin 2008
National Bureau of Statistics, 2011 6. Conclusion
The results of the post SAP period highlight that Nigeria’s subsistence agriculture was an important shock absorber against further agricultural output declines during transition. A simulation, which looks into the effects of a devaluation of the Nigeria Naira, shows that the financial crisis should have increased the relative competitiveness particularly of large-scale crop farms versus small-scale farms. The reforms of successive governments show that efficiency enhancing institutional change would benefit both large-scale and small-scale farms. However, within small-scale agriculture, a shift from subsistence to commercial agriculture would take place.
Specifically, the results of the simulations resembled the relative output growth in subsistence agriculture, on the one hand, and the relative output decline in large-scale agriculture, on the other. Both developments were observed in the 1990s. Further- more, the model replicates the output increase in small-scale.
Findings from this study also indicated that the response of the agricultural sectors to the real devaluation is mixed. The increased competitiveness of subsistence agriculture and domestic production does not result in sufficient restructuring that would induce overall growth in Nigeria’s agricultural sector. Constrains to agricultural policy effectiveness are identified to include those of policy instability, policy inconsistencies, narrow base of policy formulation, poor policy implementation, and weak institutional framework for policy coordination.
.
References
Akinyosoye, V.O., 2006. Government and Agriculture in Nigeria: Analysis of Policies, Programme and Administration. Macmillian Nigeria Publishers Limited, Ibadan, Nigeria.
Alayande,B., Alayande, O., 2004. A quantitative and qualitative assessment of vulnerability to poverty in Nigeria. Being paper submitted for presentation of CSAE Conference on poverty reduction, growth and human development in Africa, March, 2004
Antman, F., Mckenzie, D., 2005. “Poverty traps and non-linear dynamics with measurement error and individual heterogeneity”, mimeo, Stanford University.
Assessment of Nigeria Agricultural Policy (ANAP) study, 2005. Agriculture in Nigeria: Identifying Opportunities for increased commercialization and investment. IITA press, IITA Ibadan.
Apata, T.G., 2006.Income and Livelihood Diversification Strategies of Farming Households In Crude-oil Polluted Areas of Ondo State, Nigeria. Unpublished PhD Thesis in the Department of Agricultural Economics, University of Ibadan, Nigeria xi + 255 pages Bautista, R., Thomas, M., 2000. Macroeconomic and agricultural reforms in
Zimbabwe. IFPRI discussion papers, Washington, DC.
Beckmann, V., Pavel, F., 2001. The logic and future of subsistence farming in transition economies: the case of Bulgaria. In: Mattas, K., Karagiannis, I., Galanopoulos, K. (Eds.), Problems and Prospects of Balkan Agriculture in a Restructuring
Environment. 70th EEAE Seminar Proceedings, Athens. Central Bank of Nigeria (CBN), 2008: Statistical Bulletin
Dorward,A., Kydd, J.,Poulton, 2005. Coordination risk and cost impacts on Economic Development in Poor Rural Areas. Agricultural Economic Society Conference, April 2005, Nottingham.
Greene, W. (2005). Reconsidering heterogeneity in panel data estimators of the stochastic frontier model. Journal of Econometrics 126: 269–303. 36
Hassine, N.B., Robichaud, V., and Decaluwe, B (2010) Agricultural Trade Liberalization, Productivity Gain and Poverty Alleviation: A CGE Analysis. Centre For Political Economy (CIRPEE) Quebec, Working paper, 10-22
Kumbhakar, S.C. and Lovell, K. C. A. (2000). Stochastic Frontier Analysis. Cambridge: Cambridge University Press.
Goskomstat (Statistical Office of the Russian Federation), 2001. Russia in Figures. Official Publication, Moscow.
Ikpi, A.E., 1995: Policy relevance of research for sustainable development in Nigeria’s agriculture: Proceedings of a workshop on Nigeria’s Agricultural Research, Policy, Planning and Plan Implementation Experience and Relevance to Development. Held at the University of Ibadan Conference Center, Ibadan, Nigeria May 31 and June 1, 1994. Edited by Ikpi,A.E and Olayemi, J.K.
Lipton, M., 2005. Can Small Farms Survive, Prosper, or be the key Channel to Cut Mass Poverty? Presentation to FAO Symposiums on Agricultural Commercialization and the Small Farmer, Rome, 4-5 May 2005.
Lofgren, H., Harris, R. L. and Robinson, S. (2002). A Standard Computable General Equilibrium (CGE) Model in GAMS. Microcomputers in Policy Research 5. Washington D.C., International Food Policy Research Institute.
National Bureau of Statistics (NBS), 2011
Nwafor, M (2005): The impacts of Trade liberalization on poverty in Nigeria:
Network
Okunmadewa, F., 2002. Poverty and Agricultural Sector. Poverty reduction and the Agricultural sector in Nigeria, edited by Foluso Okunmadewa, Elshaddai Global Ventures Ltd. Ibadan, Nigeria.
Oksana, N., 2005. Small farms: Current Status and Key Trends. In Proceedings of Research Workshop on the future of small farms Wye, Uk Organised by International Food Policy research institute (IFPRI)/2020 initiative and Overseas Development Institute (ODI) Imperial College, London
Olayide, S., Eweka, J., Bello-Osagie, V.,1980: Nigerian Small Farmers: Problems and Prospects in Integrated Rural Development in Nigeria. Centre for agricultural rural and development (CARD), University of Ibadan, Nigeria publisher.
Omoke, P.C.(2007): Trade policy reforms and rural poverty in Nigeria. Department of Economics, Ebonyi State University, Ebonyi, Nigeria
Orea, L., and Kumbhakar, S.C. (2004). Efficiency measurement using a latent class stochastic frontier model. Empirical Economics 29: 169-183.
Poulton,C., Dorward, A., Kydd, J., 2005. The Future of Small Farms: New Directions for Services, Institutions and Intermediation. In Proceedings of Research Workshop on the future of small farms Wye, Uk Organised by International Food policy research institute (IFPRI)/2020 initiative and Overseas Development Institute (ODI) Imperial College, London
Robinson, S., 1989. Multisectoral models. In: Chenery, H., Srinivasan, T. N. (Eds.), Handbook of Development Economics, vol. 2, Chapter 18. North- Holland, Amsterdam.
Sanusi, L.S. (2010): Growth Prospects for the Nigerian Economy. Paper presented at the eight convocation lecture of Igbinedion University, Okada, Edo State, Nigeria, November, 20, 37pp
Spencer, D., 2002. The future of Agriculture in Sub-Saharan Africa and South Asia. In Sustainable Food Security for All by 2020. Proceedings of an International Conference, September 4-6, 2001, Bonn, Germany. International Food Policy Research Institute, Washington, D.C.
Wehrheim, P and Wobst, P. (2005). The economy role of Russia’s subsistence agriculture in the transition process. Agricultural Economics, 33:91-105
Wobst, P., 2001. Structural adjustment and intersectoral shifts in Tanzania: a computable general equilibrium analysis. Research report 117, International Food Policy Research Institute, Washington, DC.