Alcohol Consumption and the
Burden of Disease
IC
AP
P
OL
IC
Y
TO
OL
S S
ER
IES
ISS
UE
S B
RI
EF
IN
GS
ICAP Issues Briefings address specific topics relevant to alcohol policy, providing a succinct overview of key evidence. Where appropriate, they include an analysis of intended and unintended outcomes, country-level case studies, and main positions around a particular debate.
The Issue in Brief
The Global Burden of Disease (GBD) study assesses the relative contribution of major diseases and injuries—and the risk factors that cause them—to premature death and disability.
The debate around alcohol’s involvement in GBD assessment relates, in particular, to whether all drinking or only alcohol abuse should be included, and to implications for policy.
The evidence:
Calculating the burden of disease
z Many diseases, injuries, or deaths are related to
exposure to certain risk factors or hazards. Their contribution to the burden of disease is calculated in terms of so-called Disability Adjusted Life Years (DALYs).
z DALYs allow different risk factors and different diseases
to be compared in terms of their public health impact.
Alcohol as a risk factor
z The GBD study lists alcohol among the 10 leading risk
factors.
z Although alcohol may be a risk factor for certain
diseases, it does not necessarily cause them.
z Certain diseases to which alcohol contributes occur
and develop without the involvement of alcohol.
The distribution of alcohol-attributable disease burden
z The alcohol-attributable burden of disease varies by
age and gender, with a higher burden for males and younger age groups.
z The proportion of alcohol-attributable deaths varies
between regions, as does the burden of disease.
z It has been estimated that the burden of disease
attributable to alcohol is higher in low-income countries than in high-income countries.
Limitations:
z Alcohol is inherently different from other risk factors in
the GBD study: Its outcomes include benefits as well as harms and are strongly related to drinking patterns.
z To account for drinking patterns, it has been proposed
that GBD estimates should include alcohol abuse—not simply “alcohol”—as a risk factor.
z Calculations of GBD depend largely on aggregate
measures of volume, which do not account for different drinking behaviors or for unrecorded alcohol consumption.
z The quality of survey data used to estimate alcohol
consumption, as well as disease and death rates, is variable across countries.
z Confounding factors cannot always be accounted
and controlled for when determining the effect of a particular risk factor.
z Most conditions involving alcohol can also be caused
by other risk factors, and many diseases involve multiple factors and have different etiologies.
z The involvement of alcohol as a causal factor is
particularly difficult to estimate in regard to social harms.
z Attribution of risk is not always objective, which may
further confound the issue. Relevant ICAP publications:
Ellison, R. C. (Ed.). (2007, May). Health risks and benefits of moderate alcohol consumption: Proceedings of an international symposium.Annals of Epidemiology,
17(Suppl.), S1–S116.
Grant, M., & Litvak, J. (Eds.). (1998). Drinking patterns and their consequences. Washington, DC: Taylor & Francis. Stimson, G. V., Grant, M., Choquet, M., & Garrison, P. (Eds.).
(2007). Drinking in context: Patterns, interventions, and partnerships. New York: Routledge.
ICAP ISSUES BRIEFINGS Alcohol Consumption and the Burden of Disease | 2
What Is the Issue?
The Global Burden of Disease (GBD) study assesses the relative contribution of major diseases and injuries—and the risk factors that cause them—to premature death and disability.
The study was first conducted in 1990 by the World Bank, the World Health Organization (WHO) (1, 2), and a number of collaborating academic institutions.
z The analysis relies on the use of a single measure
for comparing the public health impact of the most common risk factors for health.
z It provides a framework for examining the comparative
importance of diseases and injuries across populations by age and sex at country, regional, and global levels. A health risk is defined as a “factor that raises the probability of aderse health outcomes” (50, p. v).
Alcohol is identified as one of the 10 leading risk factors worldwide.
z According to estimates based on 2004 data, the
burden attributable to alcohol worldwide was 3.6% of deaths and 4.4%1 of Disability Adjusted Life Years
(DALYs) (50).
What Is the Debate?
The debate around alcohol’s involvement in GBD assessment relates, in particular, to whether all drinking or only alcohol abuse should be included.
However, other issues have also been raised, including:
z reliability of available data;
z relative contributions of recorded and unrecorded
alcohol;
z different outcomes for different drinking patterns; z accounting for the beneficial effects of drinking,
somatic health, and social and mental wellbeing;
z alcohol as a causal factor for many diseases.
These issues are relevant not only to the assessment of alcohol’s contribution to the disease burden but also to policy recommendations:
“Because there are no bounds on the sum of attributable fractions, there is also no limiting factor to temper the claims of advocates or analysts. For this reason one must interpret the estimates of attributable burden of any given exposure
with great caution.” (2, p. 598)
1 The 2009 report on global health risks (50) uses both 4.4%
and 4.5% (see Table 1 on this page) as the percentage of DALYs attributable to alcohol worldwide.
What Is the Evidence?
Calculating the burden of disease
Data used for the assessment of GBD are collected at country level, using a standardized coding system for causes of mortality and morbidity.
This system, the International Classification of Diseases (ICD), is used by health professionals in countries worldwide (4), who assign a code to each diagnosis that is made.
Data on mortality, disease, and injury are pooled to obtain epidemiological information, including:
z prevalence – the proportion of a population with a
particular disease at a given point in time;
z incidence – the number of new cases of a disease
occurring during a given period of time.
Many diseases, injuries, or deaths are related to exposure to certain risk factors or hazards.
These risk factors may directly cause a particular disease (or death) or may be associated with it. In some cases, they may be involved in its progression.
The contribution of deaths, injuries, and diseases to the burden of disease is calculated in terms of Disability Adjusted Life Years (5).
Table 1. Estimated Attributable Burden from Leading Risk Factors
Risk Factor DALYs (millions) Percent of Total
Childhood underweight 91 5.9
Unsafe sex 70 4.6
Alcohol use 69 4.5
Unsafe water, sanitation, and hygiene 64 4.2
High blood pressure 57 3.7
Tobacco use 57 3.7
Suboptimal breastfeeding 44 2.9
High blood glucose 41 2.7
Indoor smoke from solid fuels 41 2.7
Overweight and obesity 36 2.3
ICAP ISSUES BRIEFINGS Alcohol Consumption and the Burden of Disease | 3
DALYs include two measures:
z life years lost to premature death;
z life years lost to combined death and disability.
These are derived from the ideal projected life expectancy of an individual at the time of death or hospitalization in the absence of the disease. In simple terms:
Number of years lost to disability =
(Number of new cases in a year) x (Disability weight) x (Average length and duration of a disability) z For nonfatal diseases, the number of years lost is
estimated by multiplying the time an “average” patient is sick by a disability factor, ranging between 0 and 1, specific to each disease.
z The more disabling a disease, the closer to 1 is the
disability factor.
Similarly, for deaths and disabilities together:
DALYs = (Years lost to premature death) + (Years lost to disability)
DALYs are also used to assess the contribution of various risk factors to the burden of disease.
This contribution is assessed in terms of “attributable fractions,” which represent the proportion of a disease that would be eliminated if the risk factor were absent (6). Table 1 shows the relative impact of the top 10 risk factors in terms of DALYs.
It is important to note that risk factors are not the same as causes of disease and injury.
Causes refer to the specific diseases or injuries that account for mortality and morbidity.
Some of the leading causes of disease and injury include (8):
z lower respiratory infection; z diarrheal diseases;
z unipolar depressive disorders; z ischemic heart disease; z HIV/AIDS;
z cerebrovascular disease;
z prematurity and low birth weight; z birth asphyxia and birth trauma; z road traffic accidents;
z neonatal infections and other noninfectious causes in
the perinatal period.
DALYs allow comparisons of the public health impact of different risk factors, as well as of different diseases and injuries.
DALYs have also been used for other purposes (7):
z providing a performance indicator for progress in
reducing diseases and disabilities;
z helping to identify national priorities for disease
control;
z allocating time of clinical and public health
practitioners;
z allocating research and development resources; z allocating resources to health interventions.
DALYs and estimates of the disease burden are used to set the policy agenda around health issues.
Alcohol as a risk factor
The GBD Study lists alcohol among the 10 leading risk factors by attributable burden (see Table 1).
The degree to which alcohol is involved in causes of death and in disease diagnoses is complicated and varied. Alcohol is involved, by definition, in the so-called alcohol use disorders. For these diseases, alcohol consumption is a necessary cause.
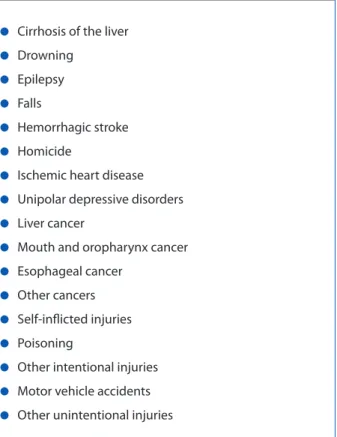
In addition, alcohol is a risk factor for various other conditions (3; see Table 2), without necessarily causing them. For example:
z Cirrhosis of the liver may be caused by hepatitis B or C,
as well as by other factors, without the involvement of alcohol.
z Although alcohol may be present in some homicides
or motor vehicle accidents, many of these incidents do not involve alcohol.
Disease conditions related to alcohol have been grouped into three broad categories, defined by the nature of the disease and the involvement of alcohol in their etiology (9):
z wholly attributable to alcohol (by definition) – e.g.,
alcohol use disorders, alcoholic fatty liver and cirrhosis, ethanol toxicity;
z chronic conditions where a significant relationship
with alcohol as a contributing cause has been found – e.g., cancers of the mouth and throat, breast cancer, ischemic stroke;
z acute conditions where alcohol is a contributing cause
ICAP ISSUES BRIEFINGS Alcohol Consumption and the Burden of Disease | 4
The relationship between alcohol and long-term health and social outcomes has been described through three mechanisms (9, 10):
z direct biological effects of ethanol –which may
influence chronic diseases;
z intoxication – involved mainly in acute outcomes, such
as accidents;
z dependence – impact on both chronic and acute
physiological and social outcomes (11).
Increasing attention is being paid to the relationship between alcohol and communicable diseases (12).
Currently, alcohol-attributable diseases do not include any communicable diseases.
z However, it has been argued that some infectious
diseases, notably tuberculosis and HIV/AIDS, should be included, as they may be associated with (mostly heavy) alcohol consumption (13-17).
The distribution of alcohol-attributable disease burden
The alcohol-attributable burden of disease varies by age and gender.
In general, the contribution of alcohol to GBD is higher for men than for women (18).
z According to 2004 data, 7.6% of DALYs for men and
1.4% for women were attributed to alcohol.
z Based on the same data, 6% of deaths among men
and 1.1% of deaths among women globally were attributed to alcohol (50).
Estimates show a significant burden of alcohol for younger age groups (18):
z 33.6% of all alcohol-attributable DALYs are for those in
the age groups between 15 and 29 years.
The proportion of alcohol-attributable deaths varies between regions, as does the burden of disease. z In low-income countries, “traditional” risks—those
associated with poverty (e.g., under-nutrition) and communicable diseases—are most salient (50).
z In middle- and high-income countries, on the other
hand, the major risks are associated with chronic and non-communicable diseases (50).
Alcohol consumption is generally higher for developed than for developing countries (18, 50).
However, it has been estimated that the burden of disease attributable to alcohol is higher in lower income than in higher income countries (19).
z The highest proportion of deaths attributable to
alcohol has been calculated for Eastern Europe and Latin America (50).
z Poorer populations in low-income countries are
thought to shoulder a disproportionate burden per liter of alcohol consumed as compared to populations in higher-income countries (18).
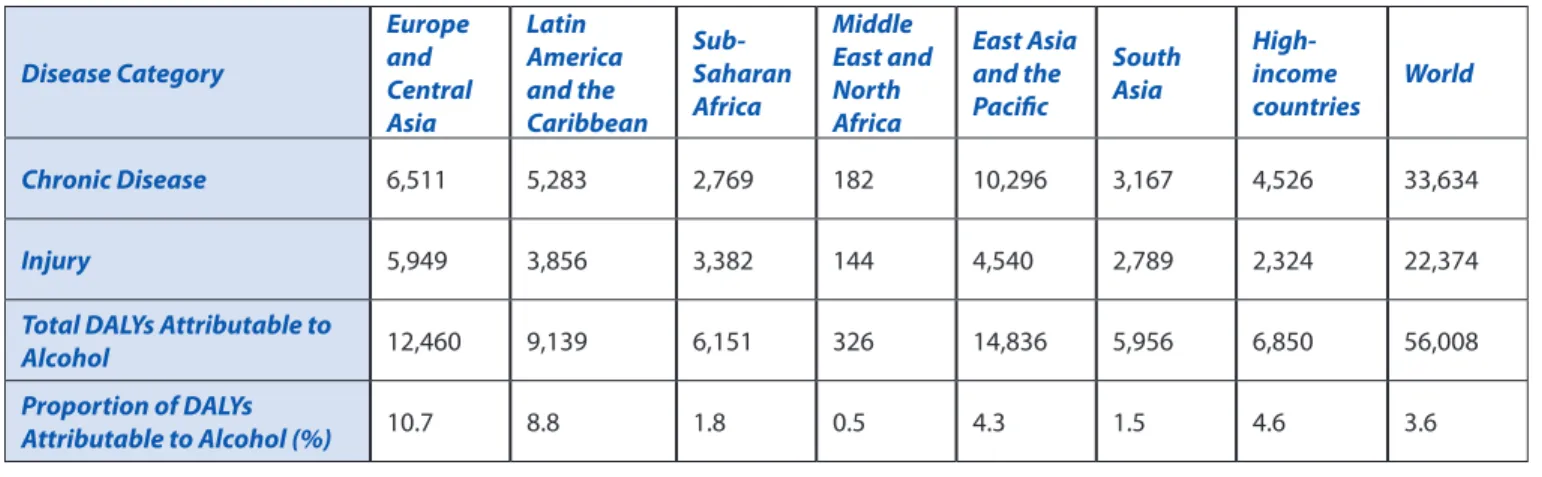
Table 3 shows the alcohol-attributable burden of disease (in DALYs) for chronic disease and injury, by region.
Table 2. Diseases and Injuries Involving Alcohol as a Risk Factor
Conditions Involving Alcohol as a Risk Factor
z Cirrhosis of the liver
z Drowning
z Epilepsy
z Falls
z Hemorrhagic stroke
z Homicide
z Ischemic heart disease
z Unipolar depressive disorders
z Liver cancer
z Mouth and oropharynx cancer
z Esophageal cancer
z Other cancers
z Self-inflicted injuries
z Poisoning
z Other intentional injuries
z Motor vehicle accidents
z Other unintentional injuries
ICAP ISSUES BRIEFINGS Alcohol Consumption and the Burden of Disease | 5
What Are the Limitations?
Several confounding factors have been raised with regard to the contribution of alcohol to GBD, both in relation to the methodology used and the interpretation of results.
Data collection and analysis are not standardized across different assessments of GBD, making comparison difficult and possibly affecting the interpretation of results.
Risk factors included in the 2009 assessment of GBD (based on 2004 data; see 50) are different from those used in earlier assessments. For example:
z The 2002 assessment of GBD includes “underweight”
as a leading risk factor (3); in the 2009 assessment (50), leading risk factors include “childhood underweight,” changing the attributable percentage of total DALYs from 9.5% to 5.9%.
z Whereas high cholesterol and iron deficiency are
included in the 2002 data (3), the 2009 assessment includes suboptimal breastfeeding and high blood glucose (50). The selection of risk factors included affects the standing of each relative to the others.
z The 2009 report on global health risks (50) includes
analysis of low-, middle-, and high-income countries. In the 2002 World Health Report (3), on the other hand, countries are grouped by child mortality strata by region and as developing or developed countries, while a third report, published in 2006 by the World Bank Group (19) divides countries by geographic region.
Relationship with drinking patterns
Alcohol is inherently different from other risk factors in the GBD study in that its outcomes are strongly related to drinking pattern.
One of the main shortcomings of the GBD methodology is its inability to adequately differentiate between low, moderate, and heavy and abusive drinking patterns, all of which are associated with different outcomes.
z Harms are generally associated with heavy drinking
patterns (20), while benefits are associated with low to moderate consumption (21, 22).
z Chronic harms are related to sustained drinking, while
acute harms may result from a single episode. These differences are not captured in GBD assessments.
To account for drinking patterns, it has been proposed that GBD estimates should include alcohol abuse— not simply “alcohol”—as a risk factor (23).
Although efforts have been made to construct a scale that groups countries by drinking pattern (24), this attempt also has several shortcomings.
z It presupposes that patterns remain constant over
time.
z It does not account for variations in patterns within
the population of a country—some individuals are abstainers, others moderate or heavy drinkers, so variation is inevitable.
Table 3. Alcohol-attributable DALYs for Chronic Disease and Injury by World Bank Region (in thousands of DALYs)
Disease Category Europe and Central Asia Latin America and the Caribbean Sub-Saharan Africa Middle East and North Africa East Asia and the Pacific South Asia High-income countries World Chronic Disease 6,511 5,283 2,769 182 10,296 3,167 4,526 33,634 Injury 5,949 3,856 3,382 144 4,540 2,789 2,324 22,374
Total DALYs Attributable to
Alcohol 12,460 9,139 6,151 326 14,836 5,956 6,850 56,008
Proportion of DALYs
Attributable to Alcohol (%) 10.7 8.8 1.8 0.5 4.3 1.5 4.6 3.6
ICAP ISSUES BRIEFINGS Alcohol Consumption and the Burden of Disease | 6
While exposure to other risk factors has a largely linear relationship with harm, alcohol’s relationship is J-shaped and includes benefits as well as harms (21, 23).
More recent calculations of GBD have attempted to take the beneficial contribution of alcohol consumption into account, notably for cardiovascular diseases, stroke, and diabetes mellitus.
Cardiovascular and certain other health benefits of moderate drinking are particularly associated with older populations (25). An aging population in many industrialized countries in regions like Europe and North America suggest that offsetting harms with benefits is an important consideration.
While some of the somatic benefits of alcohol
consumption have been taken into consideration, the social and mental health benefits are not accounted for.
This is, in part, due to the absence of an adequate methodology for quantifying these benefits (23, 26, 27). However, there is strong evidence to suggest that moderate alcohol consumption affects cognitive
function, subjective wellbeing, and quality of life (28-30). These, in turn, have a demonstrated effect on physical health status (31).
Data collection
Calculations of GBD depend largely on aggregate measures of volume for a country, or its per capita alcohol consumption.
They do not take into consideration drinking patterns in terms of the distribution of consumption across populations—whereas some individuals are heavy drinkers, others are moderate drinkers or abstainers. These differences are likely to influence outcomes and involvement in disease or injury.
Aggregate volume measures, largely derived from sales data, do not account for drinking patterns among men and women, different age groups, and other population groupings.
These data have to be extrapolated from additional population surveys, which are not consistent or of uniform quality across countries (32).
z Only 52% of countries included in the GBD analysis for
which per capita consumption data were available also had available survey data.
z For the remaining 48%, estimates were made on the
basis of survey data from neighboring countries, matched according to cultural and geographic similarities.
More recent assessments of GBD have attempted to address drinking patterns for individual countries, but data are still lacking for many parts of the world.
Aggregate sales data also do not include figures for unrecorded alcohol consumption.
Although estimates vary, unrecorded alcohol may account for around 30% of total global alcohol
consumption and is estimated to be significantly higher in some regions (33).
z The quality of unrecorded beverages (be they illicit or
legally home-produced) is likely to be a contributing factor to harmful outcomes and thereby to the disease burden (34-36).
Estimates used for disease and death rates are equally inconsistent, as data collection in many countries is unreliable (2).
As a result, the risks studies have been applied and extrapolated across different populations when burden is calculated.
However, most such studies have been undertaken in a few industrialized countries.
It is unlikely that the exposure–risk relations can be simply transferred from industrialized countries to the developing world (37).
Methodological issues
Prospective studies used to calculate risk relating to GBD have certain methodological shortcomings.
Many studies assume that an individual’s drinking patterns do not change over time.
There is solid evidence to show shifts in drinking patterns across a lifetime (also called drinking trajectories) (38-43), with a general decrease in drinking in young adulthood and further decline in consumption as individuals age.
Confounding factors cannot always be accounted and controlled for when determining the effect of a particular risk factor.
While many studies attempt to match subjects studied (e.g., controlling for age and gender among subjects who drink compared with those who do not drink), certain lifestyle or health factors cannot always be controlled for.
ICAP ISSUES BRIEFINGS Alcohol Consumption and the Burden of Disease | 7
These confounders may influence the results of a particular study or may introduce alternative or competing explanations that may not be considered.
Much of the evidence relies on meta-analyses of individual studies, and may introduce confounders.
Meta-analyses are only as strong as the studies they consider:
z The inclusion of poorly executed studies, for example,
lacking proper controls, will affect the findings of the meta-analysis.
Determining causation
Most conditions involving alcohol (see Table 3 above) can also be caused by other risk factors.
Therefore, the same disease or disability can be attributed to both alcohol and another risk factor or even to
multiple risk factors.
In fact, the attributable fractions for death or disability for a particular “condition” can be greater than 100%.
The GBD assessment does not account for the involvement of a common genetic basis as a risk factor in certain diseases or disorders.
z For example, risk for certain alcohol use disorders
(alcohol dependence) and major depressive disorder may be increased by the presence of a common gene (or genes) (49).
z In this case, the principal risk factor for depression
would be the genetic component, not alcohol consumption per se.
GBD estimates rely on the assumption that single risk factors are involved, with all others held constant.
However, this is not always the case, as two (or more) risk factors may interact to cause a disease:
z For example, heavy smoking and heavy alcohol
consumption have a synergistic effect for the development of certain oral cancers (45-47). It is, therefore, debatable how the contribution of each risk factor should be reflected in calculations of attributable fractions.
The involvement of alcohol as a causal factor is particularly difficult to estimate with regard to social harms.
Whereas child abuse, public disorder, or vandalism, for example, may occur where heavy drinking is prevalent, they also occur in the absence of alcohol consumption.
z A causal link between alcohol and these outcomes
has not been established in the research literature and cannot be assumed.
The involvement of a number of complex factors in the etiology of some diseases makes it difficult to single out alcohol consumption as a cause and may involve a subjective assessment.
z Many diseases are closely related to social exclusion
and the lack of adequate access to prevention and healthcare.
Attribution of causality is not always objective, which may further confound the issue.
Several requirements need to be met for a causal relationship to be established (3):
z temporality – cause must precede effect;
z strength – strong associations are more likely to be
causal than weak ones;
z consistency – repeated observation of an association
in different populations and under different conditions;
z biological gradient – dose-response curve; z plausibility – biological plausibility is relevant but
can be “subjective and is based on current level of knowledge and beliefs” (3, p. 21);
z experimental evidence.
The possible “subjective” nature of plausibility is a strong potential source of bias in attributing causation.
ICAP ISSUES BRIEFINGS Alcohol Consumption and the Burden of Disease | 8
References
1. The World Bank. (1993). World development report 1993: Investing in
health. New York: Oxford University Press.
2. Murray, C. L., & Lopez, A. D. (Eds.) (1996). Global burden of disease
and injury: A comprehensive assessment of mortality and disability from diseases, injuries, and risk factors in 1990 and projected to 2020.
Cambridge, MA: Harvard School of Public Health & World Health Organization.
3. World Health Organization (WHO). (2002). World health report 2002:
Reducing risks, promoting health lifestyles. Geneva, Switzerland:
Author.
4. World Health Organization (WHO). (2007). International
Classification of Diseases and Related Health Problems. 10th Revision.
Geneva: World Health Organization.
5. Murray, C. L. (1994). Quantification of the burden of disease: The
technical basis for DALYs. Bulletin of the World Health Organization,
72, 429-445.
6. Miettenen, O. S. (1974). Proportion of disease caused or prevented
by a given exposure, trait, or intervention.American Journal of
Epidemiology, 99, 325-332.
7. Jamison, D. T. (1996). Forward to the Global Burden of Disease and
Injury series. In C. L. Murray & A. D. Lopez (Eds.), The global burden
of disease : Comprehensive assessment of mortality and disability from diseases, injuries, and risk factors in 1990 and projected to 2020
(pp. xv-xxiv). Cambridge, MA: Harvard School of Public Health.
8. World Health Organization (WHO). (2004). The global burden of
disease: 2004 update. Geneva, Switzerland: Author.
9. Rehm, J., Room, R., Graham, K., Monteiro, M., Gmel, G., & Sempos,
C. T. (2003). The relationship of average volume of alcohol consumption and patterns of drinking to burden of disease: An
overview.Addiction, 98, 1209-1228.
10. Rehm, J., Room, R., Monteiro, M., Gmel, G., Graham, K., Rehn, N., et al. (2004). Alcohol use. In M. Ezzati, A. D., Lopez, A. Rogers, & C. J. L.
Murray (Eds.), Comparative quantification of health risks: Global and
regional burden of disease attributable to selected major risk factors
(pp. 959 -1108). Geneva, Switzerland: World Health Organization.
11. Drummond, D. C. (1990). The relationship between alcohol
dependence and alcohol-related problems in a clinical population.
British Journal of Addiction, 85, 357-366.
12. Parry, C., Rehm, J., Poznyak, V., & Room, R. (2009). Alcohol and
infectious diseases: An overlooked causal linkage? Addiction, 104,
331-332.
13. Standerwick, K., Davies, C., Tucker, L., & Sheron, N. (2007). Binge drinking, sexual behaviour and sexually transmitted infection in
the U.K.International Journal of STD & AIDS, 18, 810-813.
14. Stein, M. D., Charuvastra, A., Anderson, B., Sobota, M., & Friedmann, P. D. (2002). Alcohol and HIV risk taking among intravenous drug
users.Addictive Behaviors, 27, 727-736.
15. Corte, C. M., & Sommers, M. S. (2005). Alcohol and risky behaviors.
Annual Review of Nursing Research, 23, 327-360.
16. Fiske, C. T., Hamilton, C. D., & Stout, J. E. (2009). Alcohol use and
clinical manifestations of tuberculosis.Journal of Infection, 58,
395-401.
17. Lönnroth, K., Jaramillo, E., Williams, B. G., Dye, C., & Raviglione, M. (2009). Drivers of tuberculosis epidemics: The role of risk factors
and social determinants.Social Science & Medicine, 68, 2240-2246.
18. Rehm, J., Mathers, C., Popova, S., Thavorncharoensap, M., Teerawattananon, Y., & Patra, J. (2009). Global burden of disease and injury and economic cost attributable to alcohol use and
alcohol-use disorders.Lancet, 373, 2223-2233.
19. Rehm, J., Chisholm, D., Room, R., & Lopez, A. D. (2006). Alcohol. In D. T. Jamison, J. G. Breman, A. R. Measham, G. Alleyne, M. Cleason,
D. Evans, et al. (Eds.), Disease control priorities in developing
countries (2nd ed.). Washington, DC: The World Bank Group.
20. Gutjahr, E., Gmel, G., & Rehm, J. (2001). Relation between average
alcohol consumption and disease: An overview. European
Addiction Research, 7, 117-127.
21. Ellison, R. C. (Ed.). (2007, May). Health risks and benefits of moderate alcohol consumption: Proceedings of an international
symposium.Annals of Epidemiology, 17(Suppl.), S1–S116.
22. Gunzerath, L., et al. (2004). National Institute on Alcohol Abuse and
Alcoholism report on moderate drinking.Alcoholism: Clinical and
Experimental Research, 28, 829-847.
23. Gulbinat, W. (2008). Alcohol and the burden of disease. Addiction
Research and Theory, 16, 541-552.
24. Rehm, J., Gmel, G., Room, R., & Frick. U. (2001). Average volume of alcohol consumption, drinking patterns and related buden of mortality in young people in established market economies of
Europe.European Addiction Research, 7, 148-151.
25. Chen, L. Y., & Hardy, C. L (2009). Alcohol consumption and health
status in older adults: A longitudinal analysis.Journal of Aging and
Health, 21, 824-847.
26. Carr, A. J., & Higginson, I. J. (2001). Measuring quality of life: Are
quality of life measures patient centered? British Medical Journal,
322, 1357-1360.
27. Heath, D. B. (2007). Why we don’t know more about the social
benefits of moderate drinking. Annals of Epidemiology, 17, S71-S74.
28. Chan, A. M., von Mühlen, D., Kritz-Silverstein, D., & Barrett-Connor, E. (2009). Regular alcohol consumption is associated with increasing quality of life and mood in older men and women: The
Rancho Bernardo Study.Maturitas, 62, 294-300.
29. Grønbaek, M., Mortensen, E. L., Mygind, K., Andersen, A. T., Becker,
U., Gluud, C., et al. (1999). Beer, wine, spirits and subjective health.
Journal of Epidemiology and Community Health, 53, 721-724.
30. Peele, S., & Brodsky, A. (2000). Exploring psychological benefits associated with moderate alcohol use: A necessary corrective to
assessments of drinking outcomes? Drug and Alcohol Dependence,
60, 221-247.
31. Veenhoven, R. (2008). Healthy happiness: Effects of happiness on physical health and the consequences for preventive health care.
Journal of Happiness Studies, 9, 449-469.
32. Stimson, G., Grant, M., Choquet, M., & Garrison, P. (Eds.) (2007).
Drinking in context: Patterns, interventions, and partnerships. New York: Routledge.
33. World Health Organization (WHO). (2004). Global status report on
alcohol. Geneva, Switzerland: Author.
34. Levy, P., Hexdall, A., Gordon, P., Boeriu, C., Heller, M., & Nelson, L. (2003). Methanol contamination of Romanian home-distilled
alcohol. Journal of Toxicology, 41, 23-28.
35. Holstege, C. P., Ferguson, J. D., Wolf, C. E., Baer, A. B., & Poklis,
A. (2004). Analysis of moonshine for contaminants.Journal of
Toxicology, 42, 597-601.
36. Pärna, K., Lang, K., Raju, K., Väli, M., & McKee, M. (2007). A rapid situation assessment of the market for surrogate and illegal
alcohols in Tallinn, Estonia.International Journal of Public Health, 52,
ICAP ISSUES BRIEFINGS Alcohol Consumption and the Burden of Disease | 9
37. Warner-Smith, M., Lynskey, M., Hall, W., & Monteiro, M. (2001). Challenges and approaches to estimating mortality attributable
to the use of selected illicit drugs.European Addiction Research, 7,
104-116.
38. Casswell, S., Pledger, M., & Pratap, S. (2002). Trajectories of drinking
from 18 to 26 years: Identification and prediction.Addiction, 97,
1427-1437.
39. Maggs, J. L., & Schulenberg, J. E. (2005). Initiation and course of
alcohol consumption among adolescents and young adults.Recent
Developments in Alcoholism, 17, 29-47.
40. Tucker, J. S., Orlando, M., & Ellickson, P. L. (2003). Patterns and correlates of binge drinking trajectories from early adolescence to
young adulthood.Health Psychology, 22, 79-87.
41. Curran, P. J., Muthen, B. O., & Harford, T. C. (1998). The influence of changes in marital status on developmental trajectories of alcohol
use in young adults.Journal of Studies on Alcohol, 59, 647-658.
42. Johnstone, B. M., Leino, E. V., Ager, C. R., Ferrer, H., & Middleton Fillmore, K. (1996). Determinants of life-course variation in the frequency of alcohol consumption: Meta-analysis of studies from
the collaborative alcohol-related longitudinal project. Journal of
Studies on Alcohol, 57, 494-506.
43. Merline, A., Jager, J., & Schulenberg, J. E. (2008). Adolescent risk factors for adult alcohol use and abuse: Stability and change of
predictive value across early and middle adulthood. Addiction,
103(Suppl. 1), 84-99.
44. Lefton, H. B., Rosa, A., & Cohen, M. (2009). Diagnosis and
epidemiology of cirrhosis.Medical Clinics of North America, 93,
787-799.
45. International Agency for Research on Cancer (IARC). (2007).
IARC Monograph 96: Alcoholic beverage consumption and ethyl
carbamate (urethane). Lyon, France: International Agency for
Research on Cancer.
46. Pelucchi, C., Gallus, S., Garavello, W., Bosetti, C., & La Vecchia, C. (2006). Cancer risk associated with alcohol and tobacco use: Focus
on upper aero-digestive tract and liver.Alcohol Research and
Health, 29, 193-198.
47. Pöschl, G., & Seitz, H. (2004). Alcohol and cancer.Alcohol and
Alcoholism, 39, 155-165.
48. Hunter, R. L., Jagannath, C., & Actor, J. K. (2007). Pathology of postprimary tuberculosis in humans and mice: Contradiction of
long-held beliefs.Tuberculosis, 87, 267-278.
49. Nurnberger, J. I., Jr., Foroud, T., Flury, L., Su, J., Meyer, E. T., Hu, K., et al. (2001). Evidence for a locus on chromosome 1 that influences
vulnerability to alcoholism and affective disorder.American Journal
of Psychiatry, 158, 718-724.
50. World Health Organization (WHO). (2009). Global health risks:
Mortality and burden of disease attributable to selected major risks. Geneva, Switzerland: Author.
1519 New Hampshire Avenue, NW Washington, DC 20036 USA Tel: +1.202.986.1159 Fax: +1.202.986.2080 www.icap.org
© International Center for Alcohol Policies, 2009
International Center for Alcohol Policies (ICAP) is a not-for-profit organization whose mission is to promote the understanding of the role of alcohol in society through dialogue and partnerships involving the beverage alcohol industry, the public health community, and others interested in alcohol policy, and to help reduce the abuse of alcohol worldwide. ICAP is supported by major international producers of beverage alcohol.