NATIONAL BANK OF BELGIUM
WORKING PAPERS - RESEARCH SERIES
Price-setting behaviour in Belgium:
what can be learned from an ad hoc survey?
_______________________________
Luc Aucremanne (*) Martine Druant (**)
This paper has been developed within the scope of the "Eurosystem Inflation Persistence Network". We thank participants in this network, in particular Jordi Galí, Andy Levin, Steve Cecchetti and colleagues from other central banks conducting similar surveys, as well as participants in the 27th CIRET conference in Warsaw, where the paper was presented, for their useful comments. Moreover, we have received valuable comments from two anonymous referees. We would also like to express our gratitude to the section Short-term Indicators of the National Bank of Belgium, in particular Jean-Paul Vonck, for its comments on the draft version of the questionnaire, as well as for conducting the survey and treating the results. Finally we thank the respondents of the nearly 2,000 firms for their kind participation in this survey.
The views expressed in this paper are those of the authors and do not necessarily reflect the views of the National Bank of Belgium. All remaining errors are the author's.
(*)
NBB, Research Department, (e-mail: [email protected]).
(**)
Editorial Director
Jan Smets, Member of the Board of Directors of the National Bank of Belgium
Statement of purpose:
The purpose of these working papers is to promote the circulation of research results (Research Series) and analytical studies (Documents Series) made within the National Bank of Belgium or presented by external economists in seminars, conferences and conventions organised by the Bank. The aim is therefore to provide a platform for discussion. The opinions expressed are strictly those of the authors and do not necessarily reflect the views of the National Bank of Belgium.
The Working Papers are available on the website of the Bank: http://www.nbb.be
Individual copies are also available on request to: NATIONAL BANK OF BELGIUM
Documentation Service boulevard de Berlaimont 14 BE - 1000 Brussels
Imprint: Responsibility according to the Belgian law: Jean Hilgers, Member of the Board of Directors, National Bank of Belgium. Copyright © fotostockdirect - goodshoot
gettyimages - digitalvision gettyimages - photodisc
National Bank of Belgium
Reproduction for educational and non-commercial purposes is permitted provided that the source is acknowledged. ISSN: 1375-680X
Abstract
This paper reports the results of an ad hoc survey on price-setting behaviour conducted in February 2004 among 2,000 Belgian firms. The reported results clearly deviate from a situation of perfect competition and show that firms have some market power. Pricing-to-market is applied by a majority of industrial firms. Prices are rather sticky. The average duration between two consecutive price reviews is 10 months, whereas it amounts to 13 months between two consecutive price changes. Most firms adopt time-dependent price-reviewing under normal circumstances. However, when specific events occur, the majority will adopt a state-dependent behaviour. Evidence is found in favour of both nominal (mainly implicit and explicit contracts) and real rigidities (including flat marginal costs and counter-cyclical movements in desired mark-ups). The survey results point to a non-negligible degree of non-optimal price-setting.
Keywords: price-setting behaviour, price rigidity, nominal rigidity, real rigidity, survey, time-dependent pricing, state-time-dependent pricing, pricing-to-market
TABLE OF CONTENTS:
I. INTRODUCTION... 1
II. SURVEY DESIGN... 3
1. Data collection ... 3
2. The sample ... 3
3. The questionnaire ... 5
III. ENVIRONMENT FIRMS OPERATE IN ... 7
1. Market structure... 7
2. Competition and market power... 10
2.1 Rationale for the approach adopted ... 10
2.2 Results ... 11
3. Pricing-to-market (ptm)... 15
4. Conclusions with respect to the measures of competition and market power ... 17
IV. WHEN ARE PRICES ADJUSTED?... 19
1. Reviewing prices... 19
1.1 Time-dependent versus state-dependent price-setting behaviour ... 19
1.2 Frequency of price reviews ... 21
1.3 Synchronisation of yearly price reviews... 22
1.4 Information used when reviewing prices... 23
2. Changing prices... 24
3. Price reviews versus price changes ... 25
V. WHY ARE PRICES STICKY? ... 26
1. Ranking of the theories in Belgium... 27
2. A comparison with other countries ... 31
VI. WHAT CAUSES PRICE CHANGES? ... 32
VII. CHARACTERISTICS OF FLEXIBLE VERSUS STICKY FIRMS... 34
I. INTRODUCTION
This paper reports the results of an ad hoc survey on price-setting behaviour in about 2,000 Belgian firms from the sectors industry, construction, trade and services to enterprises. Overall, these sectors represent 60 p.c. of the Belgian GDP. The survey was conducted by the National Bank of Belgium in February 2004 and as such it constitutes the Belgian part of a euro area-wide initiative within the scope of the "Eurosystem Inflation Persistence Network". Its content was mainly inspired by similar surveys carried out by Blinder et al. (1998) in the United States, Apel et al. (2001) in Sweden, Hall et al. (2000) in the United Kingdom and Fabiani et al. (2004) in Italy.
The main purpose of the survey is to help describe the price rigidity prevailing in the economy, not only in quantitative terms but also in qualitative terms. This in turn provides valuable information to understand (i) the dynamic reaction of output and inflation to shocks and (ii) the transmission mechanism of monetary policy. The structure of the survey (and of this paper) has its roots in the crucial role played by price rigidities in the New-Keynesian literature, as it is for instance reviewed by Taylor (1999) in his well-known survey on staggered price and wage setting in macroeconomics. At least four aspects highlighted by Taylor are part of the survey. Moreover, when addressing these aspects in the survey, an attempt was made to incorporate more recent developments in the literature as well.
First of all, Taylor (1999) emphasises the role of market power as a necessary condition for price stickiness to be a temporary equilibrium. Deviations from perfect competition - often in the form of monopolistic competition - are therefore a necessary ingredient of New-Keynesian macro-models. As a consequence, the survey contains a series of questions on the degree of competition on the firms’ main market and the extent to which it has market power. In this respect, the survey also addresses the question whether there exists pricing-to-market and why.
Second, the survey allows us to verify Taylor’s quantitative description of the degree of price rigidity, simply by confronting (Belgian) firms directly with questions regarding the frequency of their price reviews and/or price changes. In this respect Taylor stresses that, notwithstanding a great deal of heterogeneity in price and wage setting, prices and wages are typically changed once every year. Third, the survey also examines whether firms follow mostly time-dependent or state-dependent pricing rules. Taylor (1999) stresses in this respect that the time-dependent characteristic - i.e. the exogeneity of the timing of price adjustment - of most price-setting models has been one of the most criticised assumptions of these models. State-dependent pricing is probably more realistic, but proves to be more difficult to model. The survey also tests whether there are other asymmetries in the response of prices, depending on either the nature and/or the direction of the shock.
Finally, the survey contains a qualitative question on the information set used in the price-setting process and tests a rather long list of theories on nominal and real rigidities, as these issues seem of particular interest when addressing the two persistence puzzles mentioned in Taylor (1999), namely inflation persistence and real output persistence. Based on his survey of the literature, Taylor suggests two main factors which can help understanding these persistence puzzles. These factors are (i) combining staggered price and wage setting with imperfect information and (ii) complementing nominal rigidity with a sufficient degree of real rigidities. To our knowledge, this survey is the first in addressing the issue of the information set used in the price-setting process, whereas the list of the tested theories on nominal and real rigidities is very similar to what was done by Apel et al. (2001) for Sweden.
The survey has the major advantage of being capable to provide qualitative information on price-setting behaviour and precisely these aspects have received a lot of attention, both in the questionnaire underlying the survey and in this paper. This is particularly so for the description of the market structure firms operate in, for the explicit distinction made between price reviews and price changes, for the qualitative characteristics of the information set used in the price-setting process and for the fact that a wide variety of both nominal and real rigidities is tested.
A survey is indeed probably the only data source allowing a distinction to be made between price reviews and price changes, as observed price data will only reveal the final outcome of the price-setting process, i.e. the changes. Moreover, survey results are probably the only source of information on the basis of which it is possible to get an answer to the question whether infrequent adjustment of prices is due to the existence of price-adjustment costs (nominal rigidities) and/or to the fact that the frictionless real (or relative) price does not change or changes only marginally when aggregate output fluctuates (real rigidity). Finally, observing a price change does not necessarily imply that the newly set price has been set in a completely optimal way and, in practice, it is hard to detect whether or not this is the case in quantitative price data sets. The question on the information set used in the price-reviewing process can, however, shed light on this issue.
As such, this survey is a complement to the recent quantitative analysis of price rigidities based on Belgian sectoral CPI data (see Aucremanne et al. (2002)) and on Belgian micro CPI data (see Aucremanne and Dhyne (2004a) and (2004b)).
The rest of the paper is structured as follows. In section II the sample and the questionnaire are presented. Section III describes the environment firms operate in and addresses the issues of competition and market power in particular. Section IV addresses the question of the moment when prices are adjusted, whether the pricing rules are time-dependent or state-dependent and which information set is used in the reviewing process. Section V examines various theories on both nominal and real price rigidities and section VI reports on asymmetries in the response of prices to
shocks. Section VII summarises some characteristics of flexible versus sticky firms. Section VIII, finally, offers some concluding remarks.
II. SURVEY DESIGN
1. DATA COLLECTION
The questionnaire was designed and the survey conducted by the National Bank of Belgium. A first draft of the questionnaire was sent to 20 firms in the industrial sector in the course of December 2003. 14 out of 20 firms participated in this pilot study. They were later on contacted by phone in order to inquire for their general impression of the questionnaire, which was mainly positive. At the same time, we seized the opportunity to ask them why they did not answer certain questions and we tried to find out more about some improbable answers. The questionnaire was subsequently adapted, taking into account comments made by the participants. Moreover, some questions which were inappropriately answered and/or for which it was apparent that they were misunderstood by the pilot firms, were reformulated.
In February 2004 the final questionnaire was sent by traditional mail1 to the whole sample, excluding the firms who already participated in the pilot study and answers of which were treated as definite. It was accompanied by a covering letter explaining the importance of the survey and motivating firms to participate. The firms were asked to answer within 3 weeks. As the response rate was satisfactory at the final date, no reminder was sent.
2. THE SAMPLE
The sample used for the ad hoc survey is the existing sample applied for the monthly business survey of the National Bank of Belgium. It consists of 5,600 firms in the sectors industry, construction, trade2 and services to enterprises3. The sectors not covered by the survey are agriculture, energy, government and financial services, post and telecommunications and services directly offered to consumers (hotels, restaurants and cafés, health,...) (see appendix A for a detailed list). Overall, the sectors covered by the survey represent 60 p.c. of the Belgian GDP and 84 p.c. of the overall turnover in the Belgian economy.
1,979 firms participated in the survey, representing a response rate of 35%. The response rate was more or less equal for the various sectors, ranging from 38% in industry to 32% in construction.
1
Firms were supported by a help desk (by phone).
2
Trade and repair of cars, wholesale and retail trade of a variety of goods.
3
Transport and storage, real estate and renting, computer and related services, commission trade services and other business services.
Table 1 - The sample - number of firms Population size1 Sample size2 Number of respondents Response rate(%) Weights based on turnover Total 394,339 5,600 1,979 35 100 Industry 44,439 2,000 753 38 30.9 Construction 70,685 1,200 384 32 5.0 Trade 132,292 1,400 478 34 36.7 Services 146,923 1,000 364 36 27.4 Industry, 0-49 employees 42,603 n. 433 n. 6.3 Industry, 50-199 employees 1,363 n. 211 n. 5.2
Industry, 200 and + employees 473 n. 109 n. 19.4
Construction, 0-49 employees 70,211 n. 330 n. 3.5
Construction, 50-199 employees 403 n. 45 n. 0.9
Construction, 200 and + employees 71 n. 9 n. 0.6
Trade, 0-49 employees 131,565 n. 429 n. 23.1
Trade, 50-199 employees 585 n. 31 n. 6.5
Trade, 200 and + employees 142 n. 18 n. 7.0
Services, 0-49 employees 145,893 n. 291 n. 20.5
Services, 50-199 employees 822 n. 54 n. 3.5
Services, 200 and + employees 208 n. 19 n. 3.5
Source: NBB.
1
Firms liable to VAT and belonging to sectors covered by the survey, data over the year 2001. ² The sample used is the sample of the monthly business survey.
The sample of the monthly business survey, which has been conducted for more than 50 years now, has been established in close collaboration with the sectoral employers' organisations. The latter do indeed have a good knowledge of the structure of the sector they represent and their regular contacts with members are valuable for the establishment and the regular update of the sample and the firms' permanent participation in the survey.
The way the sample has been established created a bias towards the larger companies, as is shown in table 1. In order to represent the whole population of Belgian firms better, an "ex-post stratification" has been applied, dividing the population in 12 strata, according to sector and size in terms of number of employees. The results of the ad hoc survey were subsequently weighted by the structure of the total population in terms of turnover (see last column of table 1 for the weights used). In the analysis of the answers to the questionnaire these turnover-weighted results are focused on.
3. THE QUESTIONNAIRE
An English translation of the questionnaire sent to firms in the industrial sector can be found in appendix B.
The content of the questionnaire was mainly inspired by Apel et al. (2001), Blinder et al. (1998) and Fabiani et al. (2004), although some additional questions were included in order to take into account the fact that the Belgian economy is a very open one and that little is known about price-setting behaviour on foreign markets. Moreover, on designing the questionnaire, an attempt was made to incorporate the most recent developments in the relevant literature, in particular on the following two issues which are of particular interest when addressing the above-mentioned persistence puzzles stressed in Taylor (1999).
First of all, as in Apel et al. (2001), a relatively long list of sources of price rigidity was tested, including both theories on nominal rigidities and theories on real rigidities (question B4). Jeanne (1998), Romer (2001), Eichenbaum and Fisher (2004) are examples of the New-Keynesian literature in which typically the interplay between both types of rigidity is emphasised, while Chari, Kehoe and Mc Grattan (2000) seriously challenge the ability of (empirically realistic) nominal rigidities, as such, to produce sufficient sluggishness at the aggregate level. Second, a question was inserted on the information set the newly decided prices are based on (questions B2a and B2b), as deviations from a fully optimising behaviour can be an additional source of sluggishness in the response of inflation to shocks, for instance as a result of rule of thumb price setters as in Galí et al. (2001), as a result of indexation schemes as in Christiano, Eichenbaum and Evans (2001) or Smets and Wouters (2003), or as a result of stickiness in either the information gathering and/or the optimisation processes as in Mankiw and Reiss (2002). To our knowledge, this survey is the first in addressing the latter issue.
The questionnaire consists of three parts. In part A questions are asked with respect to the main market and the main product the questionnaire mainly focuses on, as well as questions regarding the degree of competition on the firms' main market, the extent to which it has market power or, alternatively, sets its price according to the price of its competitor(s). It also contains a question as to whether or not the firm decides autonomously on its price, firms which cannot set the price themselves being allowed to skip a large amount of questions. Most firms assert that they do set their price themselves (82 p.c.) and so do not tick the answers "the price is set by government", "the price is set by parent company/group" or "the price is set by others".
Part B deals with price adjustments and asks questions about the frequency of price reviews and price changes. Moreover, it addresses issues such as the information set used when prices are reviewed, the question whether firms follow mostly time-dependent or state-dependent pricing rules and whether there are asymmetries in the response of prices, depending on either the nature and/or
the direction of the shock. Besides, a rather long list of theories regarding price rigidities, including both nominal and real rigidities, is tested.
Part C, finally, should only be filled out by industrial firms operating on more than one market and tests whether or not price-setting behaviour differs across markets, i.e. if pricing-to-market (PTM) is applied.
For the whole questionnaire, it was explicitly decided not to mention any reference period. We thought it would be better to ask questions about a general situation in order to eliminate the effect of specific events during one particular year on the results.Moreover, for some questions, such as those on the frequency of price reviews and price changes, our formulation avoids censoring problems and allows estimates for frequencies below once a year.
The questionnaire in appendix B is aimed at the industrial sector. The questionnaires for construction, trade and services to enterprises are basically identical, though there are two major differences. As companies in the non-industrial sectors almost exclusively operate on the Belgian market, we provide no specification regarding the market they should refer their answers to. Industrial firms, on the other hand, should refer to the main market. Moreover, part C has been deleted for the non-industrial sectors.
A second difference concerns the adaptation of the questionnaire to the specific context these firms operate in; instead of "main product", the terms "main activity" for construction and services and "main article" for trade are used. In addition, we pointed out in the preliminary remarks that in construction and services "the price" can sometimes be interpreted as "the hourly tariff charged". Although the answers to some questions are probably not relevant for certain sectors (e.g. question B4: the theory with regard to the use of attractive thresholds is probably not relevant for construction), we preferred to keep the same number of questions for each sector. This facilitates the comparison between sectors in our analysis.
The survey contains three types of questions. In a first set of questions, respondents are asked to indicate the importance of a given statement, the alternatives being "1 = unimportant", "2 = of minor importance", "3 = important", "4 = very important" and "? = I don't know". The mean scores that we report for this type of question are the averages of the first four alternatives, question marks or blanks being ignored for the calculation of the mean. Based on the mean scores, statements have been ranked in descending order. Moreover, for each pair of statements, a Wilcoxon signed rank
test4 has been carried out, in order to know whether or not the importance attached by respondents to the first statement is significantly different from the importance attached to the second statement. In the second type of questions firms are asked to tick one answer out of a list of possibilities. In a third type of questions a precise quantitative answer is required. Response rates have been calculated for each question and they are mentioned in the tables. They have always been satisfactory, except for question A6 on the magnitude of the price elasticity of demand, the response rate having been below 50 p.c.
All results reported in this paper are weighted according to the turnover-based weighting scheme presented in table1. However, a decomposition of the variance of all survey results (see appendix C) reveals that the largest part of the variance (often over 90 p.c.) stems from the variance within strata and that a small part stems from the variance between sectors, the variance between firm size always being negligible. This is consistent with the fact that results did not change much after weighting.
As in some cases the variance between sectors exceeds 10 p.c. of the total variance, further tests on the significance of sectoral differences (see appendix D) have been conducted, either by means of a Chi-square test of equality of sectoral distributions or by using a Spearman's rank correlation coefficient in the cases allowing a ranking. In this paper most results are presented both for the total group of responding firms and for a sectoral breakdown. The latter is however only discussed explicitly when the above-mentioned tests showed that sectoral differences are worth stating. A breakdown by firm size is not presented, as the variance decomposition showed that the variance between firm size is always negligible.
III. ENVIRONMENT FIRMS OPERATE IN
1. MARKET STRUCTURE
As the questionnaire focuses on price-setting behaviour for the main product, it is important to know whether or not this product is representative of the firm. This seems to be the case, as, on average, 69 p.c. of the turnover stems from the main product.
4
The results for this set of questions are of an ordinal nature and a rank test should be used. As the same sample of firms is responding to the different statements within one question, we hold that there is a connection between the
corresponding data and a Wilcoxon signed rank test should be used. In order to obtain the same number of answers for each pair of statements, we deleted the (very limited) group of non-responding firms.
Table 2 - Question A2 - Percentage of turnover stemming from main product: turnover-weighted results
(percentages)
Industry Construction Trade Services to
enterprises Total 0 - 25 p.c. 11 0 22 0 12 26 - 50 p.c. 16 3 21 5 15 51 - 75 p.c. 23 20 24 15 21 76 - 100 p.c. 50 77 34 80 52 Total 100 100 100 100 100 p.m. response rate 100 100 100 100 100 Average percentage 67.7 p.c. 86.1 p.c. 53.3 p.c. 87.4 p.c. 68.7 p.c. Standard deviation 29.7 p.c. 16.7 p.c. 32.7 p.c. 17.5 p.c. 31.0 p.c. Source: NBB.
Sectoral differences are relatively important and are almost always significant between services to enterprises and construction, on the one hand, and trade and industry, on the other hand5. Indeed, the average share of turnover stemming from the main product is high for the first group (almost 90 p.c.), while it is much lower for industry (68 p.c.) and even more so for trade (53 p.c.). The latter sector, and certainly the retail branch, is characterised by a wide variety of products within one firm and it is much more difficult to define one main product. This is an important point, since, if firms do not have one specific product in mind, answers with respect to the frequency of price adjustments (see part B of the questionnaire) would no longer be reliable. So, by focusing on the main product, representativeness and a sufficient degree of specificity are weighed against each other.
Table 3 - Question A3 - Main market for main product: turnover-weighted results
(percentages)
Industry
Belgian market 54.7
Another euro area country 37.7
A non-euro area country 7.6
Total 100
p.m. reponse rate 99.1
Source: NBB.
More than 50 p.c. of industrial firms indicate that Belgium is the main market for their main product. This result is not contradictory to the open character of the Belgian economy, more than 70 p.c. of turnover of the participating firms in the industrial sector being generated on foreign markets, as
5
See appendix C for a variance decomposition of question A2 and appendix D for the Chi-square test of equality of sectoral distributions.
question A3 asks for one specific main market for the main product. This is in most cases the Belgian market, exports being spread over a large number of countries. The motivation to focus on one single market (the main market) is similar to the one to focus on one single product, namely that a sufficient degree of specificity should be attained.
Table 4 - Question A5 - Main customers: turnover-weighted results
(average percentages)
Industry Construction Trade p.m.
Retail
Services to enterprises
Total
Companies within own group 18.5 4.1 7.8 7.9 9.8 10.8
Companies outside own group
with long-term relationship 45.2 16.4 19.3 2.6 46.0 32.7 with no long-term relationship 19.4 9.3 6.0 1.8 17.0 12.4 Consumers 14.2 48.7 64.6 86.8 23.3 40.2 Government 2.7 21.6 2.3 1.0 3.9 3.8 Total 100 100 100 100 100 100 p.m. response rate 93.5 97.7 91.8 90.1 93.1 93.8 Source: NBB.
The nature of the relationship with customers also shows significant differences between sectors (see appendix D for the results of the Chi-quare tests on sectoral differences). Whereas around 60 p.c. of the turnover in industry and services to enterprises is realised with customers they have some kind of long-term relationship with (either with companies within the own group or with companies outside the group which they have explicitly stated to have a long-term relationship with), the trade sector is mainly consumer-oriented (65 p.c.). In the latter case we assume that the existence of a long-term relationship is far less likely6. The predominance of relationships with consumers in trade results from retail, 87 p.c. of the turnover there being generated with consumers. Orientation towards consumers is also observed in construction (49 p.c.), government being their second largest customer (22 p.c.). A somewhat surprising phenomenon is the not unimportant share of turnover of services to enterprises stemming from consumers (23 p.c.). This is recorded in the branches "renting of cars", "insurance brokers", "computer and related services"; "lawyers" and "notaries".
6
The question on the existence of a long-term relationship with consumers was not asked explicitly, in order to simplify the questionnaire.
2. COMPETITION AND MARKET POWER
2.1 Rationale for the approach adopted
The degree of competition is a crucial variable in price-setting behaviour. As a matter of fact, Taylor (1999) provides several references going back to Arrow (1959) which all stress that some degree of market power is needed to make the price decision of a firm meaningful. In the absence of market power (perfect competition), all firms sell at a unique market clearing price. In case of perfect competition, there would be no mark-up, the price being equal to marginal costs, and price rigidities would not exist. Therefore, following Blanchard and Kiyotaki (1987), New-Keynesian models with sticky prices nowadays typically assume monopolistic competition. In such an environment prices are set as a mark-up over marginal costs and this leaves the individual firm some room for not adjusting prices when costs change.
Looking at it from this angle, the existence of some form of market power is a prerequisite for price stickiness to be an equilibrium. Pursuing this argument, it might be advanced that there should exist a positive relationship between the degree of market power, on the one hand, and the degree of price stickiness, on the other hand. This seems to be the force which is at work in the model of Bayoumi, Laxton and Pesenti (2004), who find that more competition increases the responsiveness of wages and prices to market conditions and therefore improves macroeconomic management.
Other papers however stress that more competition makes an individual firm more reluctant to adjust its price relative to the prices of other firms. In other words, more competition increases the degree of real rigidity and can therefore lead to less frequent price adjustments. The relationship between the degree of competition and the degree of price rigidity is discussed in more detail in Asplund and Friberg (1998). They tend to find that the first force prevails, but it might well be the case that the relationship between competition and price rigidity is non-monotonic. In an environment of state-dependent pricing, Dotsey, King and Wolman (1999) indeed find such a non-monotonicity in the relationship between the elasticity of demand, on the one hand, and the degree of monetary non-neutrality, on the other hand.
It is also important to point out that in this environment price stickiness leads to mark-up variations and, as such, becomes a source of output variability, apart from the output variability which results from shifts in the real marginal costs schedule7. When prices prove to be sticky in the short run, variations in marginal costs indeed drive a wedge between actual ups and "desired" mark-ups, the latter being the mark-ups which the firms apply as a result of their optimisation programme when they reset their price. Without price stickiness, prices are re-optimised and reset on a
7
See Rotemberg and Woodford (1999) and Goodfriend and King (1997) on the role of mark-up variations as sources of output fluctuations.
continuous basis and mark-ups are always at their desired level. When trying to measure the degree of market power, one is interested in these desired mark-ups rather than in actual mark-ups.
This notion of desired mark-ups is embedded in the specific wording of the first statement of question A9, by referring explicitly to a completely self-determined profit margin rather than referring to a profit margin in more general terms. The more intuitive wording profit margin and costs was used instead of their theoretical counterparts mark-up and marginal costs, as the pilot study pointed out that the respondents of the survey found this more technical terminology hard to understand. Question A9 only tests whether up pricing is applicable; it does not test whether desired mark-ups are variable, either as a result of the price decision of the individual firm itself, as in Kimball (1995), or because of cyclical variations in desired mark-ups which are uniform for all firms. Similarly, question A6 tries to obtain one single measure (i.e. average over the business cycle) of the price elasticity of demand.
For at least three reasons, the (important) question whether the price elasticity of demand and the desired mark-ups vary over the business cycle is not addressed directly in the survey. First, replacing the technical concepts mark-up and marginal costs by the more intuitive terms profit margin and costs is far more problematic when addressing the issue of cyclical variability. Indeed, the nature of the cyclicality may differ, as procyclical marginal costs and counter-cyclical mark-ups may go hand in hand with counter-cyclical average costs per unit and procyclical profits in the presence of fixed costs. Second, addressing this issue directly would have implied that respondents would have had to break down the overall variation in their mark-ups in (i) a fraction which is due to variations in desired mark-ups and (ii) a fraction which is the result of price stickiness. Third, on the basis of the pilot study, we had strong indications that pursuing the questionnaire in those more technical terms might have a detrimental impact on both the number and the quality of the responses.
Therefore, we decided to address the issue in an indirect way, namely by including in question B4 regarding the factors which hamper price adjustment several statements which describe a situation in which the elasticity of demand is procyclical and/or the (desired) mark-up is counter-cyclical. If relevant, these counter-cyclical movements in desired mark-ups would be a source of real rigidity.
2.2 Results
The questionnaire contains several questions trying to capture either the degree of competition or, alternatively, the degree of market power, which is the inverse of the first.
In question A4, firms are asked to indicate the number of competitors. 43 p.c. of firms operate on a market with 5 to 20 competitors, while the figure of those with less than 5 and more than 20 competitors is more or less equal (28 p.c. and 29 p.c.). The number of firms with more than
20 competitors is lowest in the industrial sector (16 p.c.) and highest in services to enterprises and construction (45 p.c. in both sectors). This is probably an indication that industrial companies are big players rather than a sign that the degree of competition is lower in industry. Overall, the information on the number of competitors clearly deviates from a situation of perfect competition.
Table 5 - Question A4 - Number of competitors on the main market for the main product: turnover-weighted results
(percentages)
Industry Construction Trade Services to
enterprises Total None 3.1 1.9 2.2 4.9 3.1 Less than 5 31.1 10.9 24.2 21.8 24.7 Between 5 and 20 49.8 43.6 47.6 28.3 43.1 More than 20 16.0 43.6 26.1 45.0 29.1 Total 100 100 100 100 100 p.m. response rate 96.9 89.4 89.4 90.0 93.3 Source: NBB.
The question on the elasticity of demand (question A6) was apparently the most difficult to answer, as the response rate is slightly below 50 p.c., and 23 p.c. of the firms state that a 10 p.c. price increase would entail a turnover decrease of less than 10 p.c., implying an elasticity of demand of less than unity, which in theoretical models is its lower bound. This probably has to do with the fact that respondents have different horizons in mind as the short-term effect of an increase in the firm's relative price may be lower than its long-term equilibrium effect.
The median fall in turnover is 35 p.c. and the distribution of the answers to question A6 is skewed to the right, as the mean fall in turnover (40 p.c.) is somewhat in excess of the median. Overall, these findings - having been converted into quantities demanded - imply an average elasticity of demand of 4.5. A similar magnitude is found by Fabiani et al. (2004). An elasticity of 4.5 implies a mark-up of 1.29, compared to 1.35 for the euro area in Bayoumi et al. (2004) and 1.1 in Galí et al. (2001). Only a limited number of firms report an elasticity of demand which is close to the situation of perfect competition (an infinite elasticity of demand), as the 95th percentile firm still reports an elasticity of demand below 10. Elasticity is highest in construction and industry and lowest in trade. However, when a Chi-square test of equality of sectoral distributions is conducted, these sectoral differences are not significant at the 5 p.c. level (see appendix D).
Table 6 - Question A6 - By what percentage would the turnover of your main product fall if you increase the price by 10%?: turnover-weighted results
(percentages)
% turnover fall Industry Construction Trade Services to
enterprises Total 0 - 10 p.c. 12.0 10.6 24.7 33.9 22.7 11 - 25 p.c. 19.5 11.2 26.6 18.1 21.6 26 - 50 p.c. 26.9 30.0 32.2 27.8 29.4 51 - 75 p.c. 14.7 11.6 5.4 12.0 10.1 76 - 100 p.c. 26.9 36.6 11.2 8.1 16.2 Total 100 100 100 100 100 p.m. response rate 53.3 49.9 43.7 46.2 47.1 Average percentage 50.2 p.c. 57.8 p.c. 32.6 p.c. 34.9 p.c. 39.9 p.c. Median percentage 50.0 p.c. 54.9 p.c. 26.8 p.c. 25.0 p.c. 34.9 p.c. Standard deviation 33.2 p.c. 33.0 p.c. 26.3 p.c. 29.8 p.c. 31.1 p.c. Source: NBB.
Quality seems to be the most important factor determining competitiveness, being more important than and significantly different from the second factor in the ranking, namely the price of the product. However, competitiveness also has to do with many other elements, namely long-term relationships with customers, delivery period, the degree of differentiation of the product, other factors (e.g. innovation, personal contact with customers, marketing,...) and after-sales services. Mean scores for all these factors exceed the neutral average score of 2.5. Overall, the image clearly deviates from a situation of perfect competition, in which case only the price would matter, and firms appear to have different margins along which they can differentiate their product and create some degree of market power.
Table 7 - Question A7 - Importance of the factors listed below in determining your competitiveness: turnover-weighted results
(average scores)
Industry Construction Trade Services to
enterprises
Total1
Quality of the product 3.7 3.5 3.6 3.7 3.7
Price of the product 3.6 3.6 3.3 3.3 3.4
Long-term relationship with customers 3.0 2.9 3.1 3.2 3.1
Delivery period 3.2 2.9 2.8 2.9 2.9
Degree of differentiation 2.9 2.6 3.0 2.8 2.9
Other factors 2.8 2.7 3.0 2.6 2.8
After-sales service 2.6 2.9 3.0 2.7 2.8
p.m. response rate (excl. other factors) 98.4 97.0 97.0 96.4 97.2
Source: NBB.
1
The dotted lines indicate that a Wilcoxon signed rank test rejects the hypothesis that the statements immediately above and below the line have the same overall importance at the 5% level of significance.
Question A9 on price-setting methods gives us some further indications on the market power of Belgian firms. Although the average score of firms responding that they set their price fully according to their costs and a completely self-determined profit margin (3.0) is not much higher than the average score of firms responding that they set their price according to the price of their main competitor(s), implying that they do not determine their profit margin themselves (2.8), the importance attached to each possibility differs at the 5 p.c. level of significance. At the level of the individual firms, there exists a negative correlation (0.29), between the scores obtained for both statements of question A9, which is, given the large number of firms, significantly different from zero. This correlation is, however, relatively low in economic terms, indicating that firms had difficulties in clearly expressing a preference in favour of one of the two statements. Nevertheless, the results obtained tend to suggest that, on average and to a small extent, Belgian firms are rather price-makers than price-takers. The latter is, however, far less so in the industrial sector, where both statements get the same average score.
Table 8 - Question A9 - Importance of price-setting methods: turnover-weighted results
(average scores)
Industry Construction Trade Services to
enterprises
Total1
We set our price fully according to our costs and a completely self-determined profit margins
2.9 3.5 3.0 3.1 3.0
We set our price according to the price of our main competitor(s), meaning that we do not determine our profit margin ourselves
2.9 2.6 2.8 2.7 2.8
p.m. response rate 95.5 82.0 89.6 93.3 91.8
Source: NBB.
1
The dotted line indicates that a Wilcoxon signed rank test rejects the hypothesis that the statements immediately above and below the line have the same overall importance at the 5 p.c. level of significance.
3. PRICING-TO-MARKET (PTM)
In the context of the very open Belgian economy, over 70 p.c. of turnover of the industrial sector being generated on foreign markets, the main market is probably not the only important market for many industrial firms. This is why we added part C to the questionnaire, asking whether or not there is a different price-setting behaviour according to the market. If such a differentiated behaviour appears to be relevant, this would provide an additional indication that the environment in which Belgian firms operate in clearly deviates from the competitive paradigm.
Table 9 - Question C1 - Is there different price-setting according to the market?: turnover-weighted results
(percentages)
Industry
Price in euro is the same for all countries 32.8
Price in euro is the same for euro area countries and not the same for non-euro area countries 8.8
Price in euro is different for all countries 58.4
Total 100
p.m. response rate 80.6
Almost 60 p.c. of industrial firms do apply some form of PTM, which is a high percentage in view of the fact that a common currency is used inside the euro area and that most of Belgian exports are intended for euro area countries8. To those firms answering that they apply PTM, we put the question which factors play a role in this differentiated price-setting behaviour.
Table 10 - Question C2 - Importance of factors in differentiated price-setting between markets: turnover-weighted results
(average scores)
Industry1
Price of competitor(s) on the market 3.4
Other factors 2.9
Cyclical fluctuations in demand on the market 2.5
Structural market conditions on the market 2.5
Exchange rate of the currency used for payment 2.4
Rules on the market 2.1
Tax system on the market 1.6
p.m. response rate (excl. other factors) 94.7
Source: NBB.
1 The dotted lines indicate that a Wilcoxon signed rank test rejects the hypothesis that the statements immediately above
and below the line have the same overall importance at the 5% level of significance.
The highest factor in the ranking is the price of competitor(s) on the market. Then follow "other factors", often specified as transportation costs, insurance costs, commissions paid, ... Next in ranking and showing similar average scores are cyclical differences in local demand, structural market conditions (e.g. differences in taste, living standard,...) and exchange rate movements. Different regulations on the respective markets come next. The least important factor in the decision to apply PTM seems to be the tax system. A quick check reveals that consumer-oriented firms (they can be selected from the answers to question A5, presented in table 4) value this option higher, as to these firms the impact of differences in indirect taxation is certainly more direct.
8
Table 11 - Question C3 - Is competition for your main product stronger on the foreign market than on the Belgian market?: turnover-weighted results
(percentages)
Industry
Yes 57.4
No 39.8
We do not operate on the Belgian market 2.8
Total 100
p.m. response rate 79.3
Source: NBB.
In question C3 firms are asked whether or not competition is stronger on the foreign market than on Belgian markets. Nearly 60 p.c. of firms answer that this is the case, while 40 p.c. declare that there is no difference in the degree of competition. Overall, this seems to indicate that, on average, firms have some more market power on the domestic market, despite the fact that the Belgian market is a very open one, there not being any barriers to trade, and that foreign companies are indeed very active on it.
4. CONCLUSIONS WITH RESPECT TO THE MEASURES OF COMPETITION AND MARKET POWER
Several measures of the degree of competition or, alternatively, the degree of market power have been presented above and another one will be dealt with when discussing the results of question B3, testing the impact of competitors' price(s) on the decision to increase or decrease the price. The coherence between these different measures is great, as companies with more than 20 competitors have a higher elasticity of demand compared with companies without any competitor; they rank the statement that their price is set according to the price of the main competitor higher and they attach more importance to the competitors' price(s) in the decision to increase/decrease their price or to apply pricing-to-market.
Table 12 - Coherence between measures of competition
(average scores, except where mentioned)
A4 - Number of competitors
None More than 20
A6 - Average turnover fall 9.7% 49.8%
A9 - Price is set according to the price of the main competitor 2.1 2.7 B3 - Importance of competitors' price in
price increase 1.6 2.3
price decrease 1.7 2.7
C2 - Importance of competitors' price in pricing-to-market 2.7 3.1
Source: NBB.
Summarising part III, the market the responding firms operate on for their main product (which is representative of the firm) is mainly the Belgian market. Firms in the industrial sector and in the sector services to enterprises do have a considerable amount of long-term relationships with other firms. The two other sectors participating in the survey, namely construction and particularly trade, are more consumer-oriented. Although firms undoubtedly operate in a competitive environment, the reported results clearly deviate from a situation of perfect competition. They also tend to deviate from the situation of monopolistic competition underlying most macro-models and are more suggestive of oligopolistic market structures. To a small extent, firms seem to be rather price-makers than price-takers and, besides product quality, many elements (long-term relationships with customers, product differentiation, ...) allow them to gain some degree of market power. PTM is applied by the majority of industrial firms and prices differ between markets for many reasons (competitors' price, cyclical demand conditions,...). Finally, there is some evidence that the industrial sector operates in the most competitive environment (higher elasticity of demand, more price-takership, more importance attached to competitor's prices for own price increase/decrease) and for this sector the degree of competition seems to be a bit more pronounced on foreign markets than on the domestic market.
Overall, it appears that deviations from perfect competition are substantial and, therefore, conditions are met to make the pricing decision of a firm meaningful. Several features of this pricing decision are highlighted in the next sections.
IV. WHEN ARE PRICES ADJUSTED?
The price-adjustment process consists of two components. In the first stage, firms have to run their profit maximisation program in order to determine the price they want to set, given all the relevant information they have. This component of the price-adjustment process will be referred to as the price-reviewing stage. As this process entails costs, firms may not evaluate their price on a continuous basis, it thus being relevant to examine the frequency of price reviews. Firms then check whether this optimal price corresponds to the price they currently charge. If the price-reviewing shows that a change is necessary, the price may actually be changed, although this is not always the case. Price reviews and price changes do not necessarily coincide and the former will probably occur more frequently, as actual price changes may entail additional specific costs. This second component of the price adjustment is referred to as the price-changing stage and it is meaningful to examine the frequency of price changes, in addition to the analysis of the frequency of price reviews. Moreover, whereas price reviews can take place at regular intervals, this is in general not the case for the price-changing stage. Hence, investigating whether the price-adjustment process is time-dependent or state-dependent has to take place in the first stage of the process, i.e. for the reviewing rather than for the changing of prices. For these reasons, part B of the questionnaire deals with both aspects of the price-adjustment process.
1. REVIEWING PRICES
1.1 Time-dependent versus state-dependent price-setting behaviour
In the relevant literature a distinction is made between time-dependent and state-dependent price-setting behaviour. Time-dependent models refer to the fact that the timing of price adjustment is exogenously given. In other words, it does not depend on the state of the economy. The most well-known time-dependent pricing rules are those of Calvo (1983) and Taylor (1980). In the first case, the interval between two consecutive price adjustments is random (but exogenous), while in the second case prices are adjusted after fixed intervals. Under a state-dependent pricing rule, the price will be adjusted when a specific event occurs, causing a deviation of the current price from the optimal price which is large enough to make up for the costs of the adjustment. Many macro-models assume time-dependent price adjustment - often à la Calvo -, as this yields more tractable models than state-dependent adjustment.
In the questionnaire, respondents were asked when they review their price and they were offered the possibility to choose between the options: "at specific time intervals" (which we interpret as time-dependent), "in reaction to specific events" (which we interpret as state-dependent), and "mainly at specific time intervals, but also in reaction to specific events" (which we interpret as predominantly time-dependent, but switching to state-dependent if sufficiently important events
occur). The specific wording of our time-dependent option "at specific time intervals" is probably closer to Taylor than to Calvo.
Table 13 - Question B1a - When do you review the price of your main product: turnover-weighted results
(percentages)
Normal conditions Specific events
Time-dependent price-setting Industry Construction Trade Services to enterprises 65.7(48.7) 65.9 53.4 63.9 70.8 25.7(25.1) 23.5 17.1 29.4 24.6 State-dependent price-setting Industry Construction Trade Services to enterprises 34.3(51.3) 34.1 46.6 36.1 29.2 74.3(74.9) 76.5 82.9 70.6 75.4
Sources: Apel et al., NBB. (..) Swedish results.
Response rate Belgium: 94 p.c. Response rate Sweden: 92 p.c.
Purely time-dependent reviewing (i.e. always, even when specific events occur) is practised by 26 p.c. of Belgian firms, while 34 p.c. use purely state-dependent reviewing (i.e. always, even under normal conditions). For 40 p.c. of firms the process is normally time-dependent but it may shift to state-dependency, if specific events occur. Hence, under normal circumstances, most firms (66 p.c.) adopt time-dependent reviewing. However, when a significant event occurs, 40 p.c. of firms will shift to dependent price-reviewing, implying that 74 p.c. of firms will adopt state-dependent behaviour, whereas only 26 p.c. will continue to review their price at regular time intervals.
Evidence on the existence of both time-dependent and state-dependent price-setting behaviour in the micro prices underlying the Belgian CPI has been found by Aucremanne and Dhyne (2004a) and (2004b). Moreover, the Belgian survey results on this issue are very much in line with the Swedish results of Apel et al. (2001), although they tend to show somewhat more time-dependence under normal conditions. Moreover, the fraction of state-dependent firms is far more pronounced than the breakdown which was found in Knelow and Kryvtsov (2004) - roughly 10 p.c. of the variance of US CPI-inflation stemming from state-dependent factors and 90 p.c. stemming from time-dependent factors -, in which case the dynamics of a mixed model do not differ much from those of a purely time-dependent model. Finally, the fact that a substantial fraction of firms can switch from time-dependent towards state-dependent pricing suggests that not only the nature and
the direction of the shock, but also its magnitude may matter for understanding the reaction of prices.
Overall, this evidence sheds a different light on the macro-models used nowadays, as they generally assume time-dependent price adjustment. Wolman (1999) illustrates the impact for the dynamics of inflation of the time-dependency hypothesis of Taylor (1980) and Calvo (1983) relative to the state-dependency of Dotsey, King and Wolman (1999). The question which type of specific events (aggregate, sectoral or purely idiosyncratic shocks at the firm level) is underlying the state-dependent aspects of the price-reviewing process was not addressed by the survey.
1.2 Frequency of price reviews
Firms which indicated that they review their price at specific time intervals (always or when no specific events occur) were asked how often they do so. Almost 60 p.c. review prices once a year. The second most important frequency is two times a year (20 p.c.), followed by quarterly reviews (6 p.c.) and once every two years (5 p.c.). The number of price reviews mentioned in the answer to question B1b was used to calculate the implied duration, expressed in months, between two consecutive reviews. Overall, the average duration between two consecutive price reviews is 10 months. These average intervals between reviews are longest in services to enterprises (12 months) and shortest in construction (7 months). Industry and trade show somewhat shorter durations between two consecutive price reviews than the average (9.6 and 9.7 months respectively) and retail adopts even shorter durations (9 months).
Table 14 - Question B1b - Frequency of price reviews: turnover-weighted results
(percentages)
Industry Construction Trade Services to
enterprises
Total p.m. implied
duration
More than once a year 35.3 57.7 47.2 18.3 35.8
365 times (daily) 0.2 0.0 0.0 0.0 0.0 1/30 364 - 53 times 0.2 1.5 0.0 0.6 0.3 1/30 - 1/4 52 times (weekly) 0.6 0.0 1.1 0.0 0.6 1/4 51 - 13 times 0.8 2.5 0.6 0.7 0.8 1/4 - 1 12 times (monthly) 5.4 6.2 0.7 1.9 2.7 1 11 - 7 times 0.0 2.8 1.1 0.0 0.6 1 - 2 6 times 1.4 2.5 0.0 0.6 0.7 2 5 times 0.8 3.2 0.0 0.0 0.4 2 - 3 4 times (quarterly) 9.7 16.3 2.9 4.4 5.9 3 3 times 3.0 4.8 4.9 2.6 3.7 4
2 times (every half year) 13.4 17.7 35.9 7.5 20.2 6
Once a year 59.3 37.0 49.4 71.7 58.3 12
Less than once a year 5.3 5.3 3.3 10.0 6.0
Every two years 4.3 4.6 1.7 8.2 4.5 24
Every three years 0.8 0.6 1.7 0.6 1.1 36
Less than every three years 0.2 0.0 0.0 1.2 0.4 >36
Total 100 100 100 100 100
Average duration 9.6 7.2 9.7 11.7 10.2
p.m. response rate 94.1 93.5 91.7 94.0 93.1
Source: NBB.
1.3 Synchronisation of yearly price reviews
Firms which specified that they review their price once a year, were also asked in which month this typically happens. For those firms (nearly 60 p.c. of the firms declaring to have a predominantly time-dependent process of price reviews, see table 14) there seems to be a considerable degree of synchronisation among firms, as 43 p.c. of them carry out yearly price reviews in January. December is indicated by 9 p.c. of firms and March by 8 p.c. of the respondents. The other months represent shares below 5 p.c. The high degree of synchronisation of price reviews in services during the month of January (58 p.c.) is conspicuous. This result for services was also found in the analysis of the Belgian micro CPI data by Aucremanne and Dhyne (2004a).
1.4 Information used when reviewing prices
As already emphasised, a question was inserted as to the information set the price reviews are based on (questions B2a and B2b), since deviations from a fully optimising behaviour can be an additional source of sluggishness in the response of inflation to shocks, for instance as a result of rule of thumb price setters as in Galí et al. (2001), as a result of indexation schemes as in Christiano, Eichenbaum and Evans (2001) or Smets and Wouters (2003), or as a result of stickiness in either the information gathering and/or the optimisation processes as in Mankiw and Reiss (2002).
It is important to stress that this particular question explicitly refers to the last price review. We indeed learned from the pilot study that it is not obvious to ask firms about their behaviour in this respect in more general or structural terms, as it is possible that they apply a rule of thumb for some period of time and then occasionally shift to optimal price-setting when they realise that the price they charge is too much out of line. From a theoretical point of view as well, it is hard to justify that firms always deviate from optimal price-setting and apply rules of thumb on a permanent basis and, indeed, non-optimal price-setting is not modeled this way in the above-mentioned models. As a result, the answers to question B2a and B2b can provide some indication as to the overall importance of rule of thumb behaviour in the economy, but is not very informative as to the importance of this behaviour at the level of the individual firm, making a meaningful distinction between firms for which rule of thumb behaviour is important and firms for which optimal price-setting is important impossible.
The last price review was carried out in an optimal way for only one third of firms, meaning that the price-reviewing process took into account a wide range of information relevant for the profit maximisation of the firm and that this information was related to both the present and the future economic context. Another 30 p.c. occupies a more intermediate position, as a wide range of data was indeed used, though this information was confined to the present economic context. Finally, a rule of thumb (e.g. indexation based on the consumer price index, a fixed amount/percentage adaptation,...) was used by 37 p.c. of firms. Overall, this answer provides evidence in favour of a substantial degree of non-optimal price-setting, suggesting that this type of informational friction could be an important source of sluggishness in the inflation process.
Price-setting behaviour is more optimal in industry, 45 p.c. of firms basing their price-reviewing process on a wide range of information which is also forward-looking. This somewhat more competitive sector is surely subject to more pressure to set its prices in an optimal way than other sectors. The use of rule of thumbs is most pronounced in the sector services to enterprises. However, the results of a Chi-Square test (see appendix D) do not reject the null hypothesis of equality of sectoral distributions at the 5 p.c. level of significance.
Table 15 - Question B2a/b - How did you review the price of your main product the last time? - turnover-weighted results
(percentages)
Industry Construction Trade Services to
enterprises
Total
We have applied a rule of thumb 28.7 35.8 35.0 46.1 36.6
We have considered a wide range of information 71.3 64.2 65.0 53.9 63.4
related to the present context 26.6 38.5 34.6 22.9 29.4
related to the present and the future context 44.7 25.7 30.4 30.9 34.0
Total 100 100 100 100 100
p.m. response rate 95.3 97.1 94.0 98.0 95.7
Source: NBB.
2. CHANGING PRICES
In accordance with Belgian micro CPI data (see Aucremanne and Dhyne (2004)) and with the findings of Apel et al. (2001) for Sweden and Fabiani et al. (2004) for Italy, prices do not change frequently. 55 p.c. of firms change their price once a year, while 18 p.c. do so even less often, the remaining 27 p.c. of firms changing their price more than once a year. This implies that the average duration between two consecutive price changes is almost 13 months, being highest in services to enterprises (15 months) and lowest in construction (10 months). Similar to the results on price reviews, the average duration is somewhat lower in industry and trade (close to 12 months) and retail shows even shorter durations between two consecutive price changes (11 months). As retail is mainly consumer-oriented, this would suggest that consumer prices are more flexible than producer prices. Dias et al. (2004) came to the same conclusion.
Table 16 - Question B5 - Frequency of price changes: turnover-weighted results
(percentages)
Industry Construction Trade Services to
enterprises
Total p.m.
implied duration
More than once a year 29.0 40.6 33.3 10.8 26.6
365 times (daily) 1.1 0.0 0.0 0.0 0.3 1/30 364 - 53 times 0.0 1.0 0.1 0.0 0.1 1/30 - 1/4 52 times (weekly) 0.0 0.0 0.3 0.4 0.2 1/4 51 - 13 times 0.9 2.9 0.7 0.8 0.9 1/4 - 1 12 times (monthly) 2.3 4.1 0.4 0.4 1.1 1 11 - 7 times 2.0 2.2 1.2 0.4 1.2 1 - 2 6 times 1.0 2.1 0.3 0.0 0.5 2 5 times 0.6 3.1 0.9 0.5 0.8 2 - 3 4 times (quarterly) 5.4 8.8 2.3 1.7 3.3 3 3 times 5.3 6.7 4.5 2.9 4.4 4
2 times (every half year) 10.0 9.6 22.8 3.7 13.6 6
Once a year 51.2 47.3 52.8 63.9 55.1 12
Less than once a year 19.8 12.1 13.9 25.2 18.4
Every two years 14.1 9.4 9.5 14.7 12.1 24
Every three years 3.8 2.0 3.5 4.9 3.8 36
Less than every three years 1.7 0.4 0.7 5.2 2.1 >36
Total 100 100 100 100 100
Average duration 11.9 9.8 12.0 15.3 12.8
p.m. response rate 86.5 84.6 78.5 82.3 81.8
Source: NBB.
3. PRICE REVIEWS VERSUS PRICE CHANGES
When comparing the frequency of the reviewing process with the frequency of the price-changing process for the firms the survey allows such a comparison for (i.e. the firms that indicated that their price-reviewing process is time-dependent in question B1a and thus answered the questions both on the frequency of reviews and the frequency of changes), it appears that prices are reviewed more frequently than they are changed. The average duration between two consecutive reviews is 10 months, while the average duration between two price changes is 12 months9. This evidence is consistent with the fact that changing a price entails costs, although it is theoretically also possible that the price-reviewing process would show that no price change was necessary. Given the length of the interval between two consecutive reviews - 10 months on average - we do not think, however, that the latter possibility is a very realistic one. Moreover, there appears to exist a positive correlation between both phenomena, firms with a short duration between two consecutive price reviews also showing a short duration between two consecutive
9
The average duration between two price changes for the group of firms with a time-dependent price-reviewing behaviour responding to question B1b is somewhat lower than for the whole sample of firms responding to question B5, namely 12 months compared to 13 months (see table 16).
price changes and vice versa. Finally, only a few firms report a review frequency which is lower than the frequency of changing prices.
Table 17 - Duration of prices
(number of firms) Price change Price review <=1 > 1 and < 12 12 >12 <=1 31 12 8 1 > 1 and < 12 1 197 72 21 12 2 15 436 37 > 12 0 1 5 51 Source: NBB.
duration <=1 : price is changed/reviewed monthly or more frequently.
duration > 1 and < 12 : price is changed/reviewed with a frequency from one month up to one year. duration = 12 : price is changed /reviewed once a year.
duration > 12 : price is changed/reviewed less than once a year.
V. WHY ARE PRICES STICKY?
In question B4 of the survey firms are offered a list of theories on price rigidities and are asked to state the importance of each of them in their firm. The response rate was high (94 p.c. on average), although this is a difficult question. First, it is not easy to find the appropriate formulation for the different theories in order to make them comprehensible for firms. Second, as we intended, for the reasons explained above, to test theories on both nominal and real rigidities, the list became very long. Survey results are indeed probably the only source of information on the basis of which it is possible to get an answer to the question whether the infrequent adjustment of prices is due to the existence of price-adjustment costs (nominal rigidities) or to the fact that the frictionless real (or relative) price (defined as a desired mark-up over real marginal costs) does not change substantially when aggregate output changes (real rigidities). To a large extent the list of theories on real rigidities was inspired by Romer (2001) and can be divided into three groups: theories with respect to a flat real marginal costs curve, counter-cyclical movements in desired mark-ups and counter-cyclical shifts in the real marginal costs curve. The formulation of the theories into "survey language" was mainly based on the research undertaken by Apel et al. (2001).
1. RANKING OF THE THEORIES IN BELGIUM
Table 18 - Question B4 - Importance of theories on price rigidities: turnover-weighted results
(average scores)
Type of rigidity
Industry Construction Trade Services to
enterprises
Total 1
Implicit contracts (no 4) N 2.6 2.5 2.4 2.6 2.5
Explicit contracts (no 1) N 2.9 2.9 1.8 2.7 2.4
Sluggish costs / constant marginal costs (no 7)
R/A 2.3 2.6 2.4 2.5 2.4
Importance of fixed costs / liquidity constraints (no 6)
R/B 2.2 2.4 2.2 2.2 2.2
Kinked demand curve / coordination failure (no 5)
R/B 2.4 2.0 2.3 2.0 2.2
Shifting customer clientele (no 11) R/B 1.9 2.1 2.2 2.1 2.1
Thick-market demand (no 8) R/B 2.0 1.9 2.3 1.8 2.0
Judging quality by price (no 14) N 1.7 1.9 2.1 2.0 1.9
Thick-market supply (no 9) R/C 1.7 1.8 1.9 1.7 1.8
Risk to have to readjust price in the opposite direction (no 13)
N 1.8 1.6 1.8 1.7 1.8
Changing non-price elements (no 15)
N 1.9 2.0 1.6 1.6 1.7
Counter-cyclical costs of finance (no 10)
R/C 1.6 1.8 1.7 1.7 1.7
Pricing thresholds (no 12) N 1.4 1.6 2.0 1.6 1.7
Information-gathering costs / bureaucratic rigidities (no 3)
N 1.6 1.7 1.6 1.6 1.6
Physical menu costs (no 2) N 1.5 1.5 1.6 1.4 1.5
p.m. response rate 94.2 93.3 88.9 93.8 91.9
Source: NBB.
1 The dotted lines indicate that a Wilcoxon signed rank test rejects the hypothesis that the statements immediately above
and below the line have the same overall importance at the 5% level of significance. (no ): corresponding sequence in the list of theories in the questionnaire (question B4). N: nominal rigidity.
R/A: real rigidity/flat real marginal costs curve.
R/B: real rigidity/counter-cyclical movements in desired mark-ups. R/C: real rigidity/counter-cyclical shifts in the real marginal costs curve.
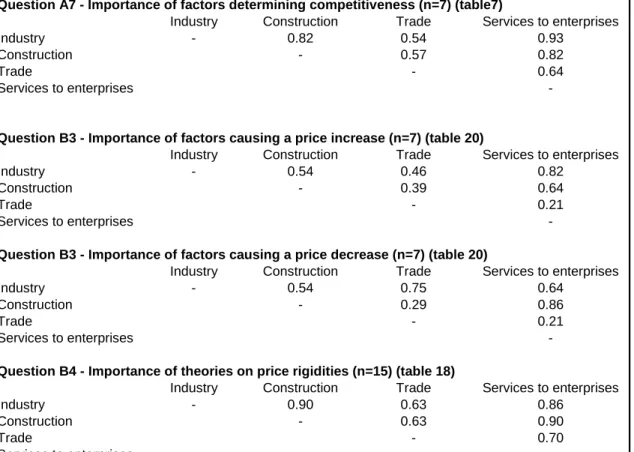
As respondents were asked to indicate the importance of each theory in their firm, a ranking of the theories could be made on the basis of the turnover-weighted average scores. They are presented in descending order in table 18. The dotted lines indicate that a Wilcoxon signed rank test reveals that the overall importance attached to the theory above the line is significantly higher than the importance attached to the theory below the line.
Firms attach the greatest importance to two theories on nominal rigidities. First, there is the theory on implicit contracts, being formulated as "our customers prefer a stable price and a change could damage customer relations, even if our competitors also change their price". The emphasis put on the fact that competitors may also change their price, is inspired by Apel et al. (2001) and is meant to make a distinction between the real theory on the kinked demand curve which deals with lower or higher relative prices. Hence, the theory on implicit contracts can more readily be classified as a nominal one, although this choice is not obvious, as explained in Blinder et al. (1998)10. In the ranking, the implicit contract theory is immediately followed by the theory on explicit contracts, under which the existence of a written contract implies that the price can only be changed if the contract is renegotiated. The importance of implicit or explicit contracts is consistent with the results of the answers to question A5 (see table 4), firms answering in that respect that a substantial fraction of their turnover (more than 40 p.c. on average) is realised with companies they have some kind of long-term relationship with. This fraction amounts to 60 p.c. in industry and services to enterprises and in these sectors, the scores for the theories or implicit and explicit contracts are above the average.
A similar mean score is attained for the theory on real rigidities with respect to the flat real marginal costs curve, also called "sluggish costs" and represented by the statement "our variable costs do not change much over the business cycle, which contributes to the price of our product remaining roughly the same". Real marginal costs may be flat - meaning that they show no explicit cyclical movements - because of real wages showing almost no procyclical movements or because of a flexible organisation of the production process, as in Dotsey and King (2001).
The next four theories in the ranking have to do with the counter-cyclical character of the desired mark-up. As explained earlier, the related question refers to the "desired" mark-ups, as opposed to counter-cyclical movements in mark-ups caused by nominal rigidities. The impact of these nominal frictions was indeed ignored here and the theories were formulated in such a way that they only test whether or not desired mark-ups change over the business cycle. As variation in desired mark-ups is studied as a source of price rigidity, we typically concentrated on counter-cyclical movements in mark-ups. In contrast, procyclical mark-ups would be an additional incentive to change prices over the business cycle.
The first theory of this group of four pertains to the importance of fixed costs or liquidity constraints, which we consider as one and the same. It states that a reduced cash flow during a recession may induce a firm to keep the price up (hence increasing the mark-up) in order to have sufficient liquidities at its disposal. In fact, it combines two elements. The first assumption is that it take