A JOINT ENDEAVOR OF RAND HEALTH AND THE RAND NATIONAL SECURITY RESEARCH DIVISION
Center for Military Health Policy Research
For More Information
Visit RAND at www.rand.org
Explore the RAND Center for Military
Health Policy Research
View document details
Support RAND
Purchase this document Browse Reports & Bookstore Make a charitable contributionLimited Electronic Distribution Rights
This document and trademark(s) contained herein are protected by law as indicated in a notice appearing later in this work. This electronic representation of RAND intellectual property is provided for non-commercial use only. Unauthorized posting of RAND electronic documents to a non-RAND website is prohibited. RAND electronic documents are protected under copyright law. Permission is required from RAND to reproduce, or reuse in another form, any of our research documents for commercial use. For information on reprint and linking permissions, please see RAND Permissions.
Skip all front matter: Jump to Page 16
The RAND Corporation is a nonprofit institution that helps improve policy and decisionmaking through research and analysis.
This electronic document was made available from
www.rand.org as a public service of the RAND Corporation.
CHILDREN AND FAMILIES EDUCATION AND THE ARTS ENERGY AND ENVIRONMENT
HEALTH AND HEALTH CARE INFRASTRUCTURE AND
TRANSPORTATION INTERNATIONAL AFFAIRS
LAW AND BUSINESS NATIONAL SECURITY POPULATION AND AGING PUBLIC SAFETY SCIENCE AND TECHNOLOGY TERRORISM AND HOMELAND SECURITY
challenges facing the public and private sectors. All RAND mono-graphs undergo rigorous peer review to ensure high standards for research quality and objectivity.
Nancy Nicosia, Barbara O. Wynn, John A. Romley
Prepared for the Office of the Secretary of Defense
Approved for public release; distribution unlimited
A JOINT ENDEAVOR OF RAND HEALTH AND THE RAND NATIONAL SECURITY RESEARCH DIVISION
Center for Military Health Policy Research
Assessing the
Performance of
Military Treatment
Facilities
The RAND Corporation is a nonprofit institution that helps improve policy and decisionmaking through research and analysis. RAND’s publications do not necessarily reflect the opinions of its research clients and sponsors.
R
®
is a registered trademark. © Copyright 2011 RAND CorporationPermission is given to duplicate this document for personal use only, as long as it is unaltered and complete. Copies may not be duplicated for commercial purposes. Unauthorized posting of RAND documents to a non-RAND website is prohibited. RAND documents are protected under copyright law. For information on reprint and linking permissions, please visit the RAND permissions page (http://www.rand.org/publications/ permissions.html).
Published 2011 by the RAND Corporation
1776 Main Street, P.O. Box 2138, Santa Monica, CA 90407-2138 1200 South Hayes Street, Arlington, VA 22202-5050 4570 Fifth Avenue, Suite 600, Pittsburgh, PA 15213-2665
RAND URL: http://www.rand.org
To order RAND documents or to obtain additional information, contact Distribution Services: Telephone: (310) 451-7002;
Fax: (310) 451-6915; Email: [email protected]
Center for Military Health Policy Research, a joint project of RAND Health, and the Forces and Resources Policy Center of the RAND National Defense Research Institute. The latter is a federally funded research and development center sponsored by the Office of the Secretary of Defense, the Joint Staff, the Unified Combatant Commands, the Department of the Navy, the Marine Corps, the defense agencies, and the defense Intelligence Community.
Library of Congress Cataloging-in-Publication Data
Assessing the performance of military treatment facilities / Nancy Nicosia ... [et. al]. p. cm.
Includes bibliographical references. ISBN 978-0-8330-4777-9 (pbk. : alk. paper)
1. Medicine, Military—United States—Evaluation. 2. United States—Armed Forces—Medical care—Evaluation. 3. United States--Armed Forces—Medical care— Cost effectiveness. 4. Health planning—United States. I. Nicosia, Nancy.
UH223.A92 2011 355.7'20684—dc23
iii
Preface
This monograph considers potential efforts by the U.S. Department of Defense (DoD) to assess the performance of military treatment facilities (MTFs) in cost-effectively managing health care under DoD’s TRICARE benefit. It offers an overview of performance assessment in the nonmilitary health care sector. It then analyzes the use of changes over time in average MTF utilization and costs as performance mea-sures, focusing on how MTF size and catastrophic cases affect these metrics.
This research was sponsored by the Assistant Secretary of Defense for Health Affairs and conducted jointly by RAND Health’s Center for Military Health Policy Research and the Forces and Resources Policy Center of the RAND National Defense Research Institute. The latter is a federally funded research and development center sponsored by the Office of the Secretary of Defense, the Joint Staff, the Unified Combat-ant Commands, the Department of the Navy, the Marine Corps, the defense agencies, and the defense Intelligence Community.
Comments are welcome and may be addressed to John Romley ([email protected]). For more information on the RAND Health Center for Military Policy Research, contact Susan Hosek at Susan_Hosek@ rand.org or Terri Tanielian at [email protected]. A profile of RAND Health, abstracts of its publications, and ordering informa-tion can be found at www.rand.org/health. For more informainforma-tion on RAND’s Forces and Resources Policy Center, contact the Director, James Hosek. He can be reached by email at [email protected]; by phone at 310-393-0411, extension 7183; or by mail at the RAND Corporation, 1776 Main Street, Santa Monica, California 90407-2138. More information about RAND is available at www.rand.org.
v
Contents
Preface . . . iii Figures . . . ix Tables . . . xi Summary . . . .xiii Acknowledgments . . . .xxi Abbreviations . . . xxiii ChAPTeR One Introduction . . . 1 ChAPTeR TwO The Context for Assessing the Performance of Military Treatment Facilities . . . 5The Mission of the Military Health System . . . .5
The TRICARE Benefit . . . .6
Challenges to the System . . . .8
DoD’s Strategy . . . .8
DoD’s Per Member Per Month Metric for MTFs . . . .9
ChAPTeR ThRee Performance Assessment in health Care . . . .11
Outcomes and Performance . . . .11
Accounting for Other Determinants of Outcomes . . . .13
Systematic Factors. . . .13
Assessing MTF Performance Based on Outcomes . . . .16
Systematic Factors Other Than Performance . . . .17
Random Variability in PMPM Outcomes . . . .18
PMPM Outcomes Versus Episode-Based Performance . . . 20
ChAPTeR FOuR Performance Assessment and MTF Size . . . 23
Data Set on MTF Outcomes . . . 23
Analysis Sample and Outcomes . . . 24
MTF Size. . . .25
The Relationship Between the Variability of MTF Outcomes and Their Size . . . 26
Assessing Changes in MTF Outcomes . . . .33
Additional Issues . . . 38
Lowering the Confidence Level . . . 38
Assessing the Performance of Military Services . . . 38
Assessing MTF Performance on an Annual Basis . . . 42
Assessing MTF Performance Net of MHS Trends . . . 48
ChAPTeR FIve Performance Assessment and Catastrophic Cases . . . .51
Relevant Data Sets . . . .52
Characterizing Catastrophic Inpatient Care . . . .52
Assessing Changes in Inpatient Utilization with Catastrophic Admissions Excluded . . . 54
ChAPTeR SIx Conclusions . . . .59
Utilization and Costs Reflect MTF Performance and Other Factors . . . 60
MTF Utilization and Costs Are Variable, But Systematic Changes Can Be Identified . . . .61
Outcomes Are More Variable at Smaller MTFs, Yet MTF Size Was Not Consistently Related to the Frequency of Systematic Changes . . . .62
Excluding Catastrophic Inpatient Care Is Practical and Potentially Useful . . . .63
Contents vii
APPenDIxeS A. Some Statistical Issues in Performance Assessment . . . .65
B. Detailed Results of Benchmark Analysis of MTF Outcomes . . . .73
C. Outpatient utilization and MTF Size . . . 101
D. Catastrophic hospital Admissions . . . .103
e. Detailed Results of Analysis of Catastrophic hospital Admissions . . . .107
ix
Figures
S.1. Actual and Mean Inpatient Utilization at DeWitt Army
Community Hospital, FYs 2004–2005 . . . .xiv
4.1. Actual and Mean Inpatient Utilization at DeWitt Army
Community Hospital, FYs 2004–2005 . . . 28
4.2. Standard Deviations of Inpatient Utilization and MTF
Size, FYs 2004–2005 . . . .29
4.3. Standard Deviations of Outpatient Utilization and MTF Size, FYs 2004–2005 . . . .29
4.4. Standard Deviations of Drug Utilization and MTF Size, FYs 2004–2005 . . . 30
4.5. Standard Deviations of Total Cost and MTF Size,
FYs 2004–2005 . . . 30
4.6. Mean MTF Inpatient Utilization and Size,
FYs 2004–2005 . . . .31
4.7. Mean MTF Outpatient Utilization and Size,
FYs 2004–2005 . . . .31
4.8. Mean MTF Drug Utilization and Size, FYs 2004–2005 . . . .32
4.9. Mean MTF Total Cost and Size, FYs 2004–2005 . . . .32
4.10. Percentage Change in Outcome Required for Statistical
Significance, Mean by Confidence Level . . . .39
4.11. Frequency of Statistically Significant Changes in MTF
Outcomes, by Confidence Level . . . .39
4.12. Percentage Change in Inpatient Utilization Required for Statistical Significance, Mean by Level of Analysis . . . 40
4.13. Percentage Change in Outpatient Utilization Required for Statistical Significance, Mean by Level of Analysis . . . 40
4.14. Percentage Change in Drug Utilization Required for
4.15. Percentage Change in Total Cost Required for Statistical Significance, Mean by Level of Analysis . . . .41
4.16. Percentage Change in Outcome Required for Statistical
Significance, Mean by Frequency of Analysis . . . 48
4.17. Frequency of Statistically Significant Changes in MTF
Outcomes, by Frequency of Analysis . . . .49
4.18. Frequency of Statistically Significant Changes in MTF Outcomes, Observed Changes Net of Military Health
System Trend Versus Benchmark Analysis . . . 50
5.1. Percentage Change in Noncatastrophic Inpatient Utilization Required for Statistical Significance with 95 Percent Confidence, Mean by DRGs Excluded
Based on RWPs . . . .55
5.2. Percentage Change in Noncatastrophic Inpatient Utilization Required for Statistical Significance, Mean
by DRGs Excluded and MTF Size Quintile . . . 56
5.3. Frequency of Statistically Significant Changes in
Noncatastrophic Inpatient Utilization, by DRGs Excluded and MTF Size Quintile . . . .57
xi
Tables
S.1. Frequency of Statistically Significant Changes in FY 2006 from FY 2004–2005 Mean Levels, Smallest
MTFs Versus Largest MTFs . . . xviii
4.1. MTF Outcomes Among Non-Active Duty TRICARE
Prime Enrollees, FYs 2004–2005 . . . .25
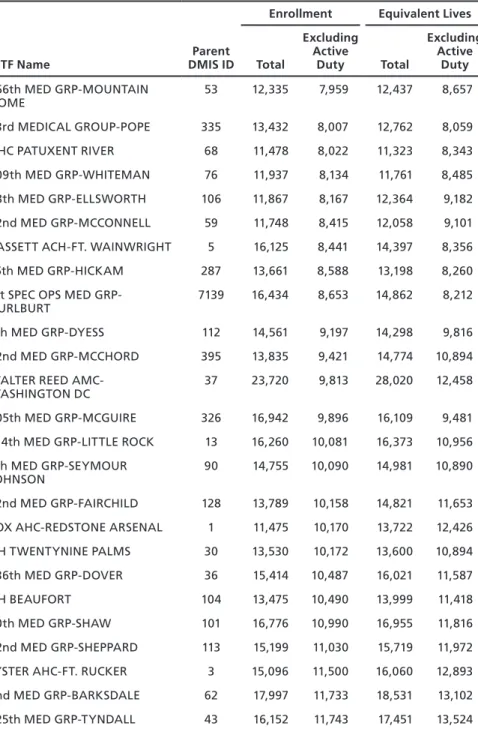
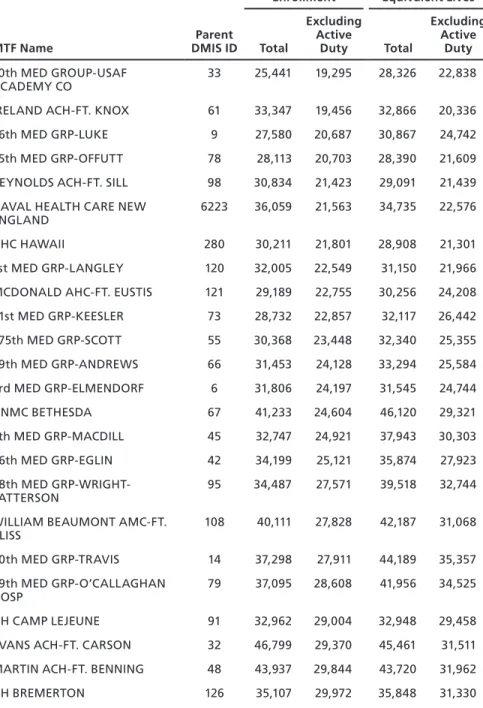
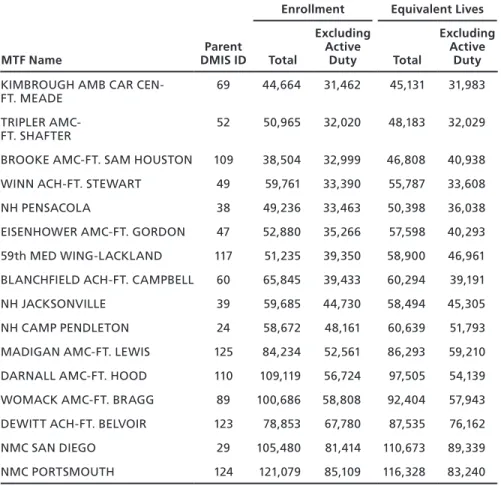
4.2. MTF Prime Enrollment and Equivalent Lives,
FYs 2004–2005 . . . 26
4.3. Range of MTF Sizes in Each Size Quintile . . . 27
4.4. Percentage Change in Outcome Required for Statistical
Significance, Mean by MTF Size Quintile . . . .33
4.5. Frequency of Statistically Significant Changes in MTF Outcomes During the Quarters of FY 2006 from Their
Mean Levels in FYs 2004–2005, by MTF Size Quintile . . . .35
4.6. Number of MTFs with Statistically Significant Changes in Outcomes, by Number of Quarters in FY 2006 with
Significant Changes . . . .37
4.7. Regressions of Estimated Standard Deviation of Annual
Inpatient Utilization . . . 44
4.8. Regressions of Estimated Standard Deviation of Annual
Outpatient Utilization . . . .45
4.9. Regressions of Estimated Standard Deviation of Annual Drug Utilization . . . 46
4.10. Regressions of Estimated Standard Deviation of Annual Costs . . . .47
5.1. Catastrophic Hospital Admissions as Share of Total Inpatient Utilization and Admissions Among Non-Active Duty Prime Enrollees, by Threshold for Catastrophic
A.1. Random Variability of Inpatient Utilization and
Confidence Intervals for Statistically Significant Changes, by MTF Size and Confidence Level . . . .70
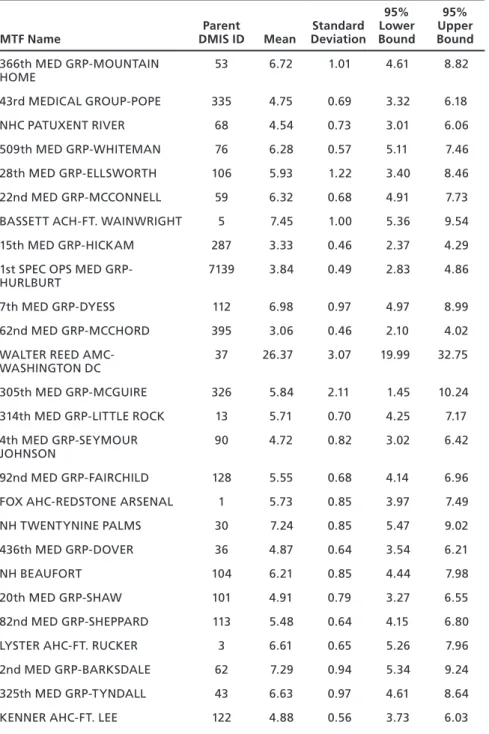
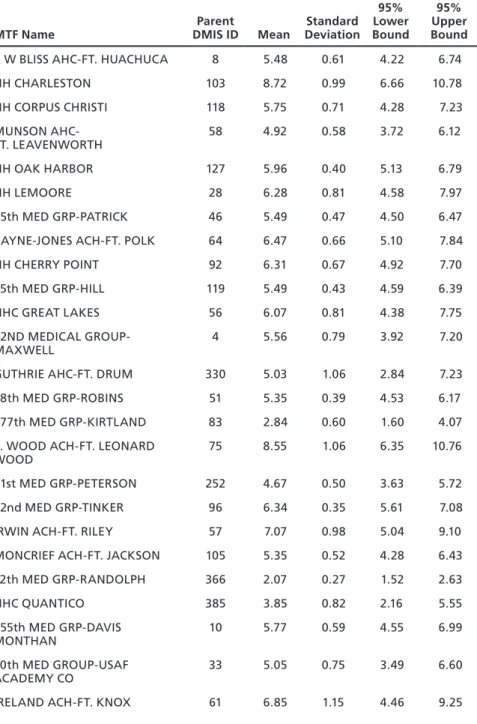
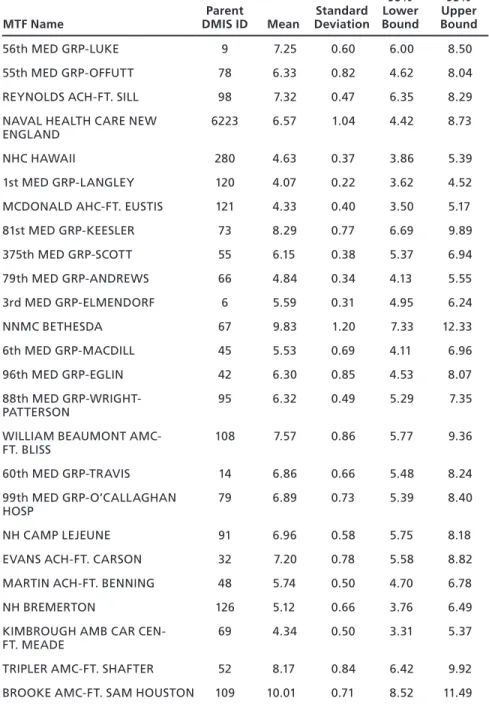
B.1. TRICARE Prime Enrollment and Equivalent Lives,
FYs 2004–2005 . . . .74
B.2. Monthly Inpatient Utilization per 1,000 Equivalent Lives, FYs 2004–2005 . . . .79
B.3. Monthly Outpatient Utilization per 100 Equivalent Lives, FYs 2004–2005 . . . 84
B.4. Monthly Drug Utilization per 100 Equivalent Lives,
FYs 2004–2005 . . . .89
B.5. Annual Total Cost Per Equivalent Life, FYs 2004–2005 . . . 94
B.6. Standard Deviations of MTF Outcomes in FYs 2004–2005 and FY 2006, Mean by MTF Size Quintile . . . 99
C.1. Regression of Outpatient Utilization . . . .102
D.1. Top 10 Percent of DRGs, by RWPs . . . 104
E.1. Results of Regression of Total Inpatient Utilization, with Catastrophic Admissions Defined by the Highest
1 Percent of DRGs by Resource Use . . . .108
E.2. Results of Regression of Total Inpatient Utilization, with Catastrophic Admissions Defined by the Highest
5 Percent of DRGs by Resource Use . . . .108
E.3. Results of Regression of Total Inpatient Utilization, with Catastrophic Admissions Defined by the Highest
xiii
Summary
The U.S. Department of Defense (DoD) has increasingly confronted financial, managerial, and operational challenges in sustaining the TRICARE health benefit, which it provided to 9.2 million beneficia-ries in fiscal year (FY) 2006. Medical costs, for example, are projected to increase to 12 percent of DoD’s total budget as of FY 2015, from a level of 8 percent in FY 2007.
In response to such challenges, the 2006 Quadrennial Defense Review motivated a transformation in business practices within the Military Health System (MHS). Performance-based planning and financing would allocate resources based on the value of activities to DoD’s mission, while aligning accountability and authority within the system.
DoD has considered setting targets for health care utilization in its military treatment facilities (MTFs) and rewarding or penalizing MTFs according to their performance. Such an initiative supposes that MTF leaders are able to cost-effectively manage care, much as general-ist physicians or managed-care plans are frequently expected to do in the private sector. For example, in areas in which TRICARE costs are high at private hospitals, MTF leaders may be able to encourage benefi-ciaries to be treated at military hospitals with spare capacity.
The Office of the Assistant Secretary of Defense for Health Affairs (OASD[HA]) has been monitoring utilization and costs “per member per month” (PMPM) among beneficiaries enrolled at each MTF in TRICARE Prime, a managed-care plan similar to a civil-ian health-maintenance organization. These PMPM metrics include all care received by beneficiaries, whether from the enrollment MTF, from
other MTFs, or from civilian health care providers. OASD(HA) has considered assessing each MTF’s performance by comparing current PMPM utilization with past levels.
Assessing changes in performance based on outcomes such as PMPM metrics raises a variety of important questions. What is the relationship between OASD(HA)’s metrics and MTF performance in cost-effectively managing care? What else may influence PMPM outcomes?
Figure S.1 suggests some answers. The figure shows OASD(HA)’s metric for inpatient utilization at DeWitt Army Community Hospital during FYs 2004–2005. Actual utilization in any quarter varies around the mean level. Performance may systematically influence mean utili-zation, yet there also appears to be some randomness.
Figure S.1 suggests some additional questions. If utilization were higher in FY 2006 than the FY 2004–2005 mean, how could OASD(HA) decide whether performance (or some other systematic Figure S.1
Actual and Mean Inpatient Utilization at DeWitt Army Community Hospital, FYs 2004–2005 Actual Mean 2.5 3 3.5 In p at ie n t u ti liz at io n 2004 2005 2006 Year–quarter RAND MG803-S.1
Summary xv
factor) had changed, or whether utilization just happened to be higher by chance? Is the nature of this decision concerning DeWitt, a rela-tively large MTF, similar to the decision that must be made at MTFs with small numbers of enrollees, where the randomness of utilization could be different? Do catastrophic cases, such as organ transplants, contribute to the random variability of inpatient utilization, making it harder to discern systematic changes?
Purpose and Approach
The purpose of this study is to help inform the sponsor’s thinking about the assessment of MTF performance in general and the variabil-ity of MTF PMPM utilization and costs in particular. In broad terms, the study included a qualitative review of performance assessment in the nonmilitary health care sector, as well as a quantitative analysis of the variability of the sponsor’s PMPM metrics and the roles played by MTF size and catastrophic cases.
For our qualitative review, we surveyed academic and policy research relating to performance assessment in health care. We visited a large Army hospital that served nearly 53,000 non-active duty Prime enrollees in FYs 2004–2005, where we interviewed MTF line adminis-trators. We also conducted informal telephone interviews of experts in performance assessment at several private health care organizations.
This qualitative information helped guide the quantitative analy-ses, in which we were able to use two types of information:
MTF-level data from FYs 2004 through 2006 on MHS-wide •
PMPM utilization and costs among TRICARE Prime
beneficia-ries enrolled at 114 “parent” facilities in the United States1
disaggregate data for FY 2004 on admissions of Prime enrollees to •
military and civilian hospitals, as well as the personal characteris-tics of these beneficiaries.
1 As discussed below, some MTFs (such as small clinics) are “children” of “parent” facilities.
The analyses distinguished between inpatient, outpatient, and drug utilization. Active-duty personnel were excluded due to deployment-related data concerns.
We first analyzed MTF PMPM utilization and costs at both quarterly and annual frequencies. For each PMPM outcome at each MTF, we determined whether the change between FY 2006 and its mean level in FYs 2004–2005 was significant (as explained below). We then investigated the impact of an MTF’s size on the variability of its PMPM outcomes and the frequency of significant changes. We defined size as the mean number of non-active duty enrollees during FYs 2004–2005; in some analyses, we considered five groups of simi-larly sized MTFs. We also considered the role of trends across MTFs in PMPM outcomes.
Separately, we analyzed the role of catastrophic cases in MTF performance assessment based on hospital admissions. We defined admissions as catastrophic if their diagnosis groups were typically asso-ciated with high levels of resource use. We then explored the role that catastrophic admissions played in PMPM inpatient utilization during FY 2004. We also simulated the impact of excluding these admissions on the identification of significant changes in noncatastrophic inpa-tient utilization during FY 2006.
Findings
Our qualitative review of performance assessment in the nonmilitary health care sector indicates that a variety of factors systematically affect health care outcomes, including PMPM utilization and costs, costs per provider or clinical episode, and so on. The performance of health care managers is such a factor. In our context, MTF leaders cause more or less care to be provided and care to be delivered more or less effi-ciently. Thus, MTF outcomes may be useful measures of performance assessment.
Health status is another systematic determinant of health care out-comes, since those who are less healthy typically need and use more care than others. Practitioners and researchers frequently attempt to account
Summary xvii
for health status by “risk adjusting” outcomes. Indeed, OASD(HA)’s PMPM metrics incorporate enrollee age, gender, and beneficiary status (e.g., retiree or dependent of a retiree). Such risk adjustments, while useful, are necessarily imperfect. When performance measures do not fully account for systematic factors, such as health risk or deployment of medical personnel, there can be substantial bias in assessments of MTF performance. The practical importance of this issue was beyond the scope of this study.
Utilization and costs also vary randomly. Whatever their health status, people use less care than usual in some periods and more in others. As a result, an observer cannot be certain about the true cause of a change in outcomes. On some occasions, an observer will mistakenly conclude that a change is systematic when in fact it is random (“false positives”). In other cases, the observer will conclude that a systematic change is random (“false negatives”). In reality, big changes are some-times random noise, while small changes are somesome-times meaningful.
An observer’s confidence that a change is truly systematic can be enhanced by requiring that an outcome increase (or decrease) by a large magnitude. When this threshold is exceeded, an observed change is “statistically significant.” A higher threshold for statistical significance results in fewer false positives, but more false negatives.
Given a confidence level, a lower rate of false negatives is desirable, because an observer has greater power to discern systematic changes. The false-negative rate is higher, however, when the randomness of an outcome is greater. PMPM utilization and costs may be more random at smaller MTFs, as there is less opportunity for enrollees’ random health care needs to balance out when there are fewer enrollees. Cata-strophic cases may also contribute substantially to the randomness of PMPM outcomes.
Table S.1 highlights some important findings concerning the fre-quency of statistical changes during FY 2006 when MTF outcomes are analyzed at a quarterly frequency. We found similar patterns (though generally higher frequencies) in the annual analysis. For outpatient uti-lization, drug utiuti-lization, and total cost, the frequency of significant changes was lower for the smallest MTFs than for the largest ones. For total cost, for example, the frequencies were 20.7 percent and 42.0
per-cent. Changes in costs would be statistically significant in 5 percent of cases (given the 95 percent confidence level) even if there were no changes in the systematic determinants of outcomes. As a result, the share of significant changes in cost that are false positives could be as high as one in four (5%/20.7% = 24.2%) for the smallest MTFs, versus less than one in eight (5%/42.0% = 11.9%) for the largest ones. Unfortunately, the associated false-negative rates are unknown because the actual changes in performance and other systematic factors are unknown (though it would be possible to simulate these rates under various assumptions).
For inpatient utilization, the frequency of significant changes is actually lower at the largest MTFs. One possible explanation for this is that inpatient utilization became less variable at these MTFs. Among all MTF outcomes, the frequency of significant changes is lowest for inpatient utilization. While these outcomes were especially variable, the other outcomes tended to grow faster throughout the MHS in FY 2006, potentially making changes easier to discern. It is possible that such trends are partly attributable to changing performance across MTFs.
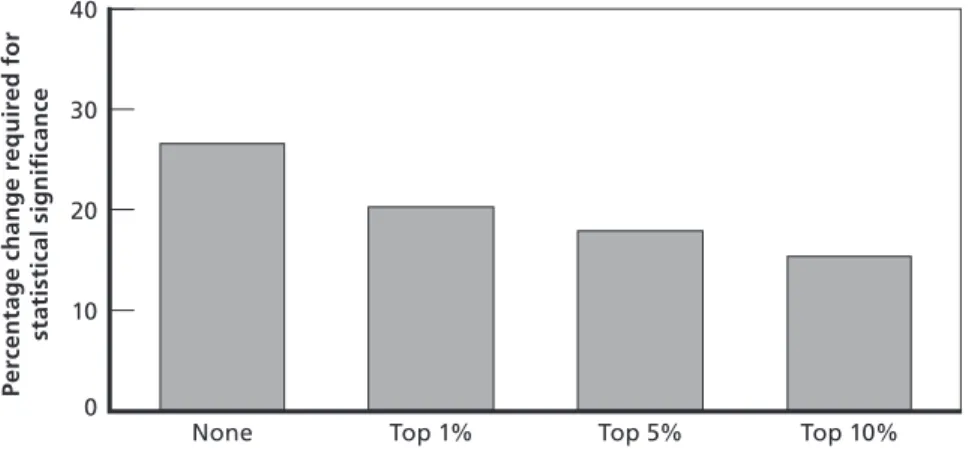
We also found that catastrophic cases, such as organ transplants and low-birthweight deliveries, play an outsized role in inpatient utiliza-tion. Diagnoses that ranked high in resource use accounted for a much larger share of utilization than of admissions. There is some reason to believe that excluding such cases would substantially increase the
fre-Table S.1
Frequency of Statistically Significant Changes in FY 2006 from FY 2004–2005 Mean Levels, Smallest MTFs Versus Largest MTFs
MTF Outcome Smallest MTFs Largest MTFs
Inpatient utilization 10.9% 3.4%
Outpatient utilization 19.6% 30.7%
Drug utilization 12.0% 15.9%
Total cost 20.7% 42.0%
NOTeS: The smallest MTFs averaged no more than 7,187 non-active duty enrollees during FYs 2004–2005; the largest MTFs averaged at least 27,911. The confidence level is 95 percent.
Summary xix
quency of statistically significant changes in noncatastrophic inpatient utilization. It is possible, however, that MTF performance in manag-ing catastrophic care is critical but hard to assess.
Altogether, our findings suggest that performance assessment of MTFs could be useful, though its effectiveness would generally be greater for larger facilities. Excluding catastrophic cases is practical and could be useful. In theory, systematic factors unrelated to performance could undermine the value of MTF outcomes as performance mea-sures, and the practical importance of this issue may merit investiga-tion. Finally, it is possible that alternatives, such as more targeted but complex assessments—for example, of cost per clinical episode—could help to diagnose MTF performance problems more reliably and to treat them more effectively.
xxi
Acknowledgments
We wish to acknowledge the assistance of MAJ Andrew Baxter, MAJ Mishaw Cuyler, and LTC Jean Jones, the programming of Stephanie Williamson, and the research assistance of Farrukh Suvankulov. We appreciate the support of project officers Robert Opsut and Pradeep Gidwani, as well as the assistance of Gregory Atkinson. John Adams and Kathleen Mullen provided valuable comments on this report; Dan Blum, Christine Eibner, Katherine Harris, Arvind Jain, and Jeanne Ringel provided helpful comments as this study progressed. Gordon Lee and Sydne Newberry assisted with communications; Nancy Good and Donna White helped with the document’s formatting. We also wish to acknowledge the personnel at military, public, and private enterprises who participated in our interviews. Privacy concerns pro-hibit disclosure of their identities, but their generous assistance contrib-uted greatly to this research.
xxiii
Abbreviations
DMIS ID Defense Medical Information System Identifier
DoD U.S. Department of Defense
DRG Diagnosis-Related Group
FY fiscal year
GAO U.S. Government Accountability Office
HCSR-I Health Care Service Record–Institutional
MHS Military Health System
MTF military treatment facility
OASD(HA) Office of the Assistant Secretary of Defense for Health Affairs
PMPM per member per month
RVU Relative Value Unit
RWP Relative Weighted Product
1
ChAPTer ONe
Introduction
The mission of the Military Health System (MHS) is “to enhance the Department of Defense (DoD) and our Nation’s security by providing health support for the full range of military operations and sustaining the health of all those entrusted to our care” (MHS, 2007). DoD has increasingly confronted financial, managerial, and operational chal-lenges in achieving this mission, as health care costs have grown, the TRICARE health care benefit has expanded, and the MHS has sup-ported military operations in Afghanistan and Iraq. The success of the MHS in meeting these challenges is important to defense policymakers, TRICARE beneficiaries, and the broader public.
In the face of these challenges, the 2006 Quadrennial Defense Review charted a “Roadmap for Medical Transformation” (TRICARE Management Activity, 2006) that includes transforming MHS busi-ness practices through performance-based planning and financing. The two components of business transformation are
a strategic, comprehensive, performance-based planning process 1.
for assessing goals and outcomes throughout the MHS
financial processes that allocate health resources based on the 2.
value of health care activities to the MHS mission and that align authority, accountability, and financial performance.
DoD-operated military treatment facilities (MTFs) may play a sig-nificant role in sustaining the TRICARE benefit through the efficient delivery of health care. DoD has considered allocating MHS funds to each service on the basis of the cost of efficiently delivered care (Opsut,
2006; TRICARE Management Activity, 2007b). Such an approach has been widely used in other settings to provide incentives to manage health costs. DoD has also considered setting utilization targets for MTFs and rewarding or penalizing MTFs for their performance with respect to the targets.
The Office of the Assistant Secretary of Defense for Health Affairs (OASD[HA]) has been monitoring utilization of TRICARE services and the associated costs “per member per month” (PMPM) among each MTF’s beneficiaries who are enrolled in Prime, TRICARE’s managed-care plan. We will refer to PMPM utilization and costs as MTF outcomes throughout this report. Changes over time in an MTF’s outcomes can be used as measures of the performance of its leaders in cost-effectively managing care. For example, in areas in which inpa-tient care is relatively costly at private hospitals, MTF leaders may be able to encourage enrollees to be treated at military hospitals with spare capacity.
Utilization and PMPM costs also depend on factors largely beyond the control of their leaders. The health status of an MTF’s enrollees sys-tematically affects PMPM utilization and costs. In addition, there is random variation in health-related outcomes. Enrollees whose health is fundamentally stable use less care than usual in some periods but more in others. For example, a healthy person will have occasional checkups and accidental injuries.
For PMPM outcomes to be useful measures of MTF perfor-mance, random changes in these outcomes must be distinguished from changes that are systematic in nature, such as changed performance. An observer can have some degree of confidence that an observed change is not due to random variation but is, rather, “statistically sig-nificant.” For a given change, the degree of confidence is greater when the random variability of the outcome is smaller.
Two factors are likely to affect the randomness of average MTF outcomes. First, PMPM utilization and costs may be highly variable at MTFs with small numbers of enrollees, because there is less opportu-nity for enrollees’ health needs to “balance out” at small MTFs than at large ones. Second, catastrophic cases (such as organ transplants or low-birthweight deliveries) may contribute substantially to the
variabil-Introduction 3
ity of average MTF outcomes, because these cases are too resource-intensive to be balanced out by noncatastrophic care.
The goal of this study is to help inform the sponsor’s thinking about MTF performance assessment in general and the variability of PMPM outcomes in particular. The study includes the following components:
a qualitative review of existing approaches by researchers and •
practitioners to measuring performance within the nonmilitary health care sector
an analysis of the variability over time of PMPM utilization and •
costs among MTFs’ Prime enrollees, with emphases on the poten-tial roles of
MTF size –
catastrophic cases. –
This monograph describes the results of the study and is orga-nized as follows. Chapter Two summarizes the context for MTF per-formance assessment. Chapter Three offers an overview of perper-formance assessment in nonmilitary health care and considers MTFs’ PMPM outcomes from this perspective. Chapter Four uses OASD(HA)’s data to assess the variability of MTF outcomes and to identify significant changes in recent years, while focusing on the role of MTF size. Chap-ter Five explores the role of catastrophic cases with additional data on enrollees’ hospital admissions. Chapter Six presents our conclusions.
5
ChAPTer TwO
The Context for Assessing the Performance of
Military Treatment Facilities
In this chapter, we summarize the context for assessing the perfor-mance of MTFs. We characterize the mission of the MHS, explain the TRICARE benefit and its delivery, review the challenges confronting the MHS, and describe DoD’s potential strategy of assessing MTF performance.
The Mission of the Military Health System
The mission of the MHS is “to enhance the Department of Defense (DoD) and our Nation’s security by providing health support for the full range of military operations and sustaining the health of all those entrusted to our care” (MHS, 2007). This mission has three “pillars” (MHS, 2007):
Provide a medically ready and protected force and medical pro-•
tection for communities.
Create a deployable medical capability that can go anywhere, •
anytime with flexibility, interoperability, and agility. Manage and deliver a superb health benefit.
•
The focus of this study is on the third pillar, although benefit manage-ment and delivery are related to the other pillars directly supporting military capability.
The TRICARE Benefit
TRICARE beneficiaries include active-duty personnel and their depen-dents, military retirees and their dependepen-dents, some reservists and their dependents, and some survivors. At the end of fiscal year (FY) 2006, approximately 9.2 million individuals were eligible for TRICARE (TRICARE Management Activity, 2007a).
The benefit is delivered at DoD-operated MTFs and by civilian health care providers. These two sources of care are known as direct and purchased care, respectively. In FYs 2004 and 2005, the direct-care system included 117 “parent” MTFs in the United States
(Atkin-son, 2007b).1 These MTFs serve populations diverse in size and
benefi-ciary mix within the context of local health systems that are themselves diverse, for example, in the availability of purchased care.
The TRICARE benefit covers inpatient and outpatient care, as well as drugs. A number of plans are offered for beneficiaries who are not Medicare-eligible, with terms (including fees and deductibles) that differ across plans. TRICARE Prime is a managed-care plan, similar to a civilian health-maintenance organization. TRICARE Standard is a fee-for-service plan that offers greater flexibility in choosing providers but also imposes higher out-of-pocket costs. Standard beneficiaries can pay lower cost shares by receiving care from a provider who belongs to the TRICARE Extra network. Our focus here is on TRICARE Prime beneficiaries, because OASD(HA) has been monitoring utilization and costs among each MTF’s Prime enrollees.
TRICARE Prime beneficiaries are enrolled with a primary care manager, a health care provider who coordinates care, including refer-ral to specialists within the direct- or purchased-care systems. More beneficiaries enroll in MTFs than in the civilian network (Mathemat-ica Policy Research, 2007).
There is significant turnover in the total population of Prime enrollees at MTFs (Hanchate, McCall, and Ash, 2006). For exam-1 MTFs may be “children” of a “parent” facility. For example, the Naval Branch Health Clinic at Naval Air Station North Island in Coronado, California, is child of Naval Medical Center San Diego. In a variety of settings including ours, data for child MTFs are “rolled up” to their parent facilities for reporting purposes.
The Context for Assessing the Performance of Military Treatment Facilities 7
ple, among 4.3 million Prime enrollees in FY 2002 for whom com-plete data were available, only 2.3 million were enrolled with the same primary care manager throughout FYs 2001 and 2002. We restrict our quantitative analysis to enrollees who are not active-duty person-nel, because deployments to Afghanistan and Iraq may complicate the accurate measurement of utilization and costs for active-duty enrollees. The extent of turnover in active-duty dependents and retirees and their dependents is unclear. The extent of any turnover in the health status of MTF enrollees is also unclear but important, because health status affects an enrollee’s typical health care needs and thus utilization and costs (see Chapter Three).
Active-duty personnel are required to enroll in Prime, and their dependents may do so with no fee or deductible. Retirees who are not Medicare-eligible may also choose to enroll for a fee of $230 for an individual or $460 for a family (TRICARE Management Activity, no date). There is no fee for those preferring to rely on TRICARE Stan-dard/Extra. Prime enrollees receive priority over other beneficiaries for care at MTFs.
The benefit is jointly managed and implemented by several DoD organizations. OASD(HA) oversees military medical care. The TRI-CARE Management Activity, a DoD field activity charged with the benefit’s administration, reports to OASD(HA). In addition, the Army, Navy, and Air Force have medical departments. These departments, each led by a Surgeon General, support the military pillars of the MHS mission while delivering the TRICARE benefit at their MTFs.
The delivery of care by MTFs is currently resourced through an activity group within the Defense Health Program’s appropriation for operation and maintenance, as well as a separate appropriation for the labor costs of military personnel (U.S. Department of Defense, Task
Force on the Future of Military Health Care, 2007).2 The two lines of
resources are allocated to the services for distribution to the MTFs and are not fungible for MTF leaders.
2 Another budget activity group funds base operations and communications relating to Defense Health Program facilities.
Challenges to the System
The MHS has confronted a variety of challenges in achieving its mis-sion. In recent years, the system has increasingly come under finan-cial stress. Between FYs 2000 and 2006, the unified medical budget increased from $17.4 billion to $38.5 billion (U.S. Department of Defense, Task Force on the Future of Military Health Care, 2007). The cost of medical care has escalated within the military, outpacing the increase in DoD’s overall budget (U.S. Government Accountabil-ity Office [GAO], 2007b). In addition to inflation and cost-increasing improvements in medical technology, expansions in the benefit have contributed substantially to growth in total expenditures. TRICARE for Life, which provides medical care to Medicare-eligible retirees and their dependents, is an example. Medical costs were 8 percent of DoD’s total budget in FY 2007 and are projected to be 12 percent of the total budget by 2015 if current trends continue (TRICARE Management Activity, 2007d).
The MHS has also been stressed operationally through its
sus-tained support of military operations in Afghanistan and Iraq.3 Combat
units have needed medical attention in preparing to deploy, the return-ing wounded require care, and medical personnel have themselves been deployed.
DoD’s Strategy
In the face of these challenges, the Quadrennial Defense Review has charted a “Roadmap for Medical Transformation” (MHS, 2007). This roadmap charts four activities: transforming the force, transforming the infrastructure, transforming the business, and sustaining the ben-efit. The relevant activity for this study—transforming the business— includes performance-based planning as well as performance-based financing.
3 The medical expenditures cited in the preceding paragraph do not include supplemental funding for the Global War on Terrorism in recent years. Global War on Terrorism funding for the MHS totaled $1.2 billion in FY 2006 (TRICARE Management Activity, 2007d).
The Context for Assessing the Performance of Military Treatment Facilities 9
Performance-based financing allocates health resources based on the value of activities to DoD’s mission while aligning authority and accountability for financial performance. As an example, DoD has con-sidered implementing a “prospective payment system” that would allo-cate resources to each service based on the cost of efficient care within the service’s MTFs, instead of the cost of resources used to deliver care in the past (TRICARE Management Activity, 2007b). DoD has also considered setting utilization targets for MTFs and rewarding or penalizing MTFs for their performance with respect to these targets
(TRICARE Management Activity, 2007b).4 Both of these approaches
suppose that MTF leaders are able to cost-effectively manage care, whether received from the enrollment MTF or elsewhere in the MHS,
and therefore provide incentives to do so.5
Turning to performance-based planning, this element of business transformation calls for a strategic, comprehensive process for assessing goals and outcomes throughout the MHS.
DoD’s Per Member Per Month Metric for MTFs
The performance of MTF leaders in cost-effectively managing care is relevant to business transformation, and so performance measures are needed. OASD(HA) has been monitoring each MTF’s PMPM utilization and costs for its Prime enrollees (Atkinson, 2007a, 2007b; TRICARE Management Activity, 2007c). These metrics include all of the care received by an MTF’s enrollees, whether from the enroll-ment MTF, from other MTFs, or from civilian health care providers. 4 These initiatives also support the MHS’s strategic plan (MHS, 2007). For example, they are relevant to the objective in the MHS “balanced scorecard” of managing DoD health care costs and shaping and sustaining the benefit. This objective contributes to the high-priority goals of sustaining the military health benefit through cost-effective, patient-centered care and effective long-term patient partnerships, as well as transformation to performance-based management for both force health protection and delivery of the health care benefit. 5 Investments in strategic assets, such as information systems, are also relevant. Informa-tion technology can support process improvements, such as more efficient scheduling or staffing, that help MTFs to perform better in managing care in a cost-effective manner (MHS, 2007).
OASD(HA) has considered the performance of each MTF’s leaders in cost-effectively managing care based on changes in PMPM utili-zation (TRICARE Management Activity, 2007b). The next chapter places these metrics in the context of outcome-based measures of per-formance in nonmilitary health care.
11
ChAPTer Three
Performance Assessment in Health Care
In this chapter, we provide an overview of performance assessment in health care. This overview is based on our qualitative review of exist-ing approaches, in which we surveyed academic and policy studies and interviewed leaders and analysts at several private health care organi-zations. We focus here on the example of Medicare costs by physician in order to help clarify the potential usefulness and limitations of per-formance assessment and, in doing so, to contextualize OASD(HA)’s
metrics and what motivates our quantitative analyses of them.1
Outcomes and Performance
OASD(HA) has been monitoring outcomes, in particular, PMPM uti-lization and costs among Prime enrollees, at each MTF. In health care, education, and other settings, outcomes have regularly been used to assess various aspects of performance (Donabedian, 1988; Goldstein and Spiegelhalter, 1996). For example, hospital quality has been mea-sured on the basis of mortality rates, while the efficiency of general-ist physicians has been measured by total Medicare expenditures per patient (Office of Statewide Health Planning and Development, 2006; GAO, 2007a). Such measures, in order to be useful, must be influenced by performance.
The example of average Medicare costs by physician can help clar-ify. GAO analyzed the percentage of generalist physicians who cared for Medicare patients with high total medical costs (GAO, 2007a). This study was motivated by existing evidence that patients’ overall care, and thus their total health care costs, are influenced by physicians, par-ticularly generalists (see, e.g., Consumer-Purchaser Disclosure Project, 2003). GAO found that certain physicians cared for a higher-than-expected share of high-cost patients. For example, 20.9 percent of gen-eralist physicians in Miami cared for such patients.
This finding suggests that a substantial number of physicians are “poor performers” in the costliness of their practice patterns. GAO con-cluded that the efficiency of the Medicare program could be improved by adopting a variety of practices that have been implemented by pri-vate health care payers, ranging from informing physicians about their performance relative to their peers to offering financial rewards to patients who choose efficient physicians. In reaching this conclusion, this outcome-based assessment of physician performance had to deal with several challenges to its reliability, which we consider in subse-quent sections of this chapter.
In the DoD context, PMPM utilization and costs are likely to be influenced by the performance of MTF leaders in cost-effectively man-aging care under the TRICARE benefit. These leaders may cause more or less care to be provided, and cause care to be delivered more or less efficiently. For example, in areas in which inpatient care is relatively costly at private hospitals, MTF leaders may be more or less effective in having enrollees treated at military hospitals with spare capacity. Insofar as such drivers of performance are important but hard for OASD(HA) to monitor directly, PMPM outcomes may be useful measures of MTF cost-effectiveness. These outcomes may also be influenced by quality of care; DoD uses a different set of performance measures to monitor this aspect of performance (TRICARE Management Activity, 2007a).
Just as Medicare might vest responsibility with generalist phy-sicians, so DoD might align accountability and authority in MTF leaders. Consistent with this notion (see Chapter Two), PMPM out-comes include all care that enrollees receive, whether from the enroll-ment MTF, from other MTFs, or from civilian health care providers.
Performance Assessment in health Care 13
DoD’s situation is like that of a managed-care organization (indeed, TRICARE Prime is conceived as DoD’s managed-care plan). These organizations sometimes contract with physician groups to care for beneficiaries, and PMPM utilization and costs are important metrics of performance in “covering lives” (McGlynn, Shekelle, et al., 2008). DoD also delivers care through its MTFs, and integrated delivery sys-tems (such as Kaiser Permanente) must assess performance and provide incentives within their organizations.
Accounting for Other Determinants of Outcomes
In order to be useful, outcome-based measures must also be reliable indicators of performance. In reality, other factors also affect outcomes. Outcome-based measures of performance can be unreliable if these other factors are important influences. We will distinguish between systematic and random determinants of outcomes.
Systematic Factors
In health care, systematic factors include performance but also, at a minimum, the health status of the relevant population. In an analysis of average patient costs by physician, a doctor could be high-cost only because his or her patients are in relatively poor health, thus needing more care. Inefficient physicians can then be reliably identified only if costs are adjusted for the health risk of each physician’s patients. The GAO study (2007a) did in fact adjust patient expenditures for health status based on a commercial technology also used to set payments for Medicare managed-care plans.
Such risk adjustment is widespread, although varied in implemen-tation (see, e.g., Huang et al., 2005). In another example, the state of California reports risk-adjusted mortality rates among hospitals’ patients, so that comparisons of hospital quality are not confounded by differences across hospitals in illness severity (Office of Statewide Health Planning and Development, 2006). In practice, risk adjust-ment is useful but nevertheless quite imprecise. For example, a person’s medical spending in one year explains only 20–25 percent of the
varia-tion in spending in a subsequent year (Newhouse, Buntin, and Chap-man, 1997).
Random Factors
There is also random variation in health care outcomes. A patient whose health is fundamentally stable nevertheless has some periods during which he or she receives some care and others in which he or she receives none; for example, a healthy patient will have occasional checkups and accidental injuries. In an analysis of average patient costs by physician, costs may differ among physicians, or for the same phy-sician over time, because the health care needs of patients differ over time. Conclusions about physician efficiency (or MTF performance) must deal with this issue.
Given such randomness, an observer can never be totally certain that variation in outcomes is due to systematic factors, including per-formance. In practice, an observer must decide on the level of confi-dence that he requires in order to conclude that observed variation in outcomes is systematic in nature. In plain language, the question he must ask himself is, “How likely is it that this different outcome is not due to chance?” In reality, both randomness and systematic fac-tors likely contribute to the observed changes. As a result, the mini-mum difference in outcomes that is required for the variation to be categorized as systematic follows from the “confidence level” and the outcome’s random variability. If the observed difference (whether posi-tive or negaposi-tive) is larger than the required difference, the observer concludes that the variation is likely attributable to systematic factors. That is, in statistical terminology that we will use henceforward, the difference in outcomes is “statistically significant.”
In such an exercise, an observer would occasionally make mistakes. In some instances, he would mistakenly conclude that the observed variation is statistically significant and thus systematic in nature, when in fact it is due to random chance. Such errors are known as “false positives.” In other instances, he would mistakenly conclude that the variation is insignificant and thus random, when in fact it is due to sys-tematic factors. These errors are known as “false negatives.”
Performance Assessment in health Care 15
An observer can reduce the rate of false negatives by increasing the rate of false positives. For example, if 95 percent confidence were required, then the observer would encounter statistically significant variation in 5 percent of cases as a matter of chance, when there is in fact no systematic variation in outcomes. That is, the false-positive rate would be 5 percent. If the confidence level decreased to 90 percent, the required variation would shrink in magnitude, and the false-positive rate would increase to 10 percent. Truly systematic variation would then be more likely to exceed the larger threshold, and the rate of false negatives would decrease. An observer must make a tradeoff between the two types of errors based on his judgment about the harms from each.
For any confidence level (and thus for any false-positive rate), a lower rate of false negatives is desirable. An observer then has greater power to discern systematic variation in outcomes. As the randomness of an outcome grows, the rate of false negatives (given the confidence level) also grows. For this reason, random variability undermines the effectiveness of performance assessment.
Variability due to random factors tends to decrease with the number of patients (or enrollees) when costs or other outcomes are averaged. The reason is that the random components of patient out-comes tend to “balance out” during any period, with those experienc-ing relatively low outcomes offsettexperienc-ing those experiencexperienc-ing high ones. This phenomenon means that the minimum difference in outcomes required for statistical significance (given a confidence level) becomes smaller as the number of patients or enrollees grows. From a somewhat different yet consistent perspective, an observer’s confidence that an observed difference is significant becomes larger with size. Appendix A provides a more formal discussion of statistical issues related to perfor-mance assessment.
In the GAO (2007a) study, the medical costs of a physician’s patients (accounting for their health status) could be high either because the physician was inefficient or because his or her patients’ health care
needs turned out to be larger than average during the period studied.2 GAO set thresholds for the proportion of physicians’ patients who would be high-cost due to chance, based on the distribution of all patients’ costs within each metro area studied. The GAO then concluded that some physicians in the area were inefficient because the percentage of
physicians with high-cost patients exceeded this threshold.3 Physicians
with small Medicare practices were excluded from the analysis, because limited numbers of patients could lead to unreliable assessments. Based on a similar concern, mortality rates for California hospitals have not been reported for hospitals with relatively few patients (Office of State-wide Health Planning and Development, 2006).
Assessing MTF Performance Based on Outcomes
OASD(HA) has been monitoring each MTF’s PMPM utilization and costs among Prime enrollees. Based on these metrics, it has contem-plated whether to formally assess the performance of each MTF by comparing current performance with past levels, that is, by identify-ing changes in an MTF’s performance over time. In the remainder of this chapter, we place this potential framework in the context of per-formance assessment in nonmilitary health care, while motivating the quantitative analyses of PMPM outcomes that follow.
Among health researchers and practitioners, identifying changes in the performance of providers or plans is less common than identify-ing differences in performance among them (GAO, 2007a; McGlynn, Shekelle, et al., 2008). Our interviews of representatives of several pri-vate health care organizations reinforced this judgment. Yet researchers have analyzed performance over time (see, e.g., Marshall, 1988; Bron-skill et al., 2002).
2 Health status can also be an explanation insofar as risk adjustment of patient expendi-tures is imperfect.
3 Thresholds were set so that 1 percent of physicians would be expected to have an excessive proportion of high-cost patients, assuming that patients were equally likely to receive care from all physicians. In every area, some physicians were inefficient.
Performance Assessment in health Care 17
Identifying performance differences among MTFs could lead to different results than identifying performance changes at MTFs. Under the latter approach, MTFs might cycle over time between better and worse performance, if leaders believe that the likely benefits of improvements are more important than the costs of decreased
perfor-mance.4 These alternative benchmarks may raise additional issues of
effectiveness and equity. Identifying performance changes at MTFs could result in large increases in performance among weak performers with substantial opportunities for improvement, and favorable assess-ments of these facilities; identifying performance differences among MTFs could result in relatively favorable assessments of historically strong performers. Each of these possibilities is desirable, though there is likely to be a tradeoff between them. Performance can be assessed according to both benchmarks simultaneously, as, for example, with the “value-based” purchasing program that Medicare has proposed for reimbursing hospitals (U.S. Department of Health and Human Ser-vices, Centers for Medicare and Medicaid SerSer-vices, 2007).
Systematic Factors Other Than Performance
Whatever the benchmark, there can be incentives under outcome-based assessment to “game” the system outcome-based on factors other than performance. For example, hospitals may respond to “report cards” on health outcomes by restricting treatment of sicker patients (Dra-nove et al., 2003). Similarly, MTFs may be able to appear to improve their performance, without actually doing so, by limiting enrollment
of sicker beneficiaries.5
4 We do not maintain that MTF leaders will behave in this fashion, only that such behav-ior is possible and potentially important. Understanding the response of MTF leaders to per-formance assessment is beyond the scope of this study but important. It may also be difficult. In any event, these responses are likely to be influenced by how DoD uses its performance assessments; this issue has not been decided.
5 If DoD were to compare performance among MTFs, each facility might be compared against its “peers,” that is, facilities with similar characteristics (for example, service or size). It is possible that MTFs could alter some characteristics (for example, size) so as to be com-pared with a lower-performing peer group.
OASD(HA)’s potential framework deals with systematic factors other than performance in two ways. First, the utilization and costs of each member (that is, enrollee) are risk adjusted (TRICARE Manage-ment Activity, 2007c). OASD(HA) standardizes each enrollee into an “equivalent life” based on age, gender, and beneficiary category (e.g., active-duty family member). This approach, while practical and useful, is less sophisticated than other forms of risk adjustment, which are themselves imperfect (Hanchate, McCall, and Ash, 2006; Newhouse, Buntin, and Chapman, 1997).
Second, identifying changes over time may help purge PMPM outcomes of the influence of other systematic factors. Suppose, for example, that systematic factors include deployments of medical per-sonnel as well as performance. Deployed perper-sonnel may have relatively efficient or inefficient practice patterns, or their absence may require that enrollees receive care from relatively low- or high-cost civilian providers, particularly in some important clinical specialties. If the number and characteristics of personnel who treat an MTF’s enrollees are stable over time, then statistically significant changes in PMPM
outcomes at an MTF must be due to changed performance.6 This
fea-ture of OASD(HA)’s potential framework can be helpful when factors such as deployments are difficult to accurately monitor. A quantita-tive analysis of the effecquantita-tiveness of these two methods for dealing with other systematic factors was beyond the scope of this study.
Random Variability in PMPM Outcomes
Random factors also lead to changes over time in MTFs’ PMPM uti-lization and costs. As we discussed, enrollees’ health care needs during any period are inherently random. In addition, instability in system-atic factors that OASD(HA) is unable to monitor contributes to varia-tion in outcomes; from OASD(HA)’s perspective, this variavaria-tion is also random. Deployment of medical personnel is a potential example. If deployment is not stable over time, and if deployment is independent of MTF managers’ performance given the resources available, statistically significant changes in PMPM outcomes must still be due to changed 6 We consider the possibility that other systematic factors are unstable momentarily.
Performance Assessment in health Care 19
performance. OASD(HA) would, however, require a larger change in outcomes for significance, given its desired confidence level. If deploy-ment were not independent of performance, then significant changes could be due to deployment rather than performance; furthermore, deployment could obscure changes in performance.
This random variability is central to the quantitative analyses that follow. PMPM utilization and costs are averaged over the number of equivalent lives enrolled at each MTF. As we explain in the next chap-ter, the average number of Prime enrollees (excluding active-duty per-sonnel) ranged from 824 at the smallest parent MTF to 85,109 at the largest parent MTF during FYs 2004 and 2005. As noted earlier in this chapter, the random variability of PMPM outcomes is likely to be greater at smaller MTFs. We therefore analyze in Chapter Four the impact of MTF size on the variability of PMPM outcomes, the magni-tude of changes required for statistical significance, and the frequency with which observed changes are significant.
To be clear, we do not focus on the impact of MTF size on the
levels of PMPM outcomes. This “volume-outcome” relationship may be important in our context, as it is in others (see, for example, Luft, Hunt, and Maerki, 1987). The scope of the present study, however, is to compare each MTF’s current performance with its past performance; MTF size is only relevant due to its potential impact on the variability of outcomes.
Catastrophic cases, such as organ transplants and low-birthweight deliveries, also contribute to the random variability of PMPM out-comes. As a result, these resource-intensive cases may make the identi-fication of systematic changes in outcomes more difficult. Appendix A provides numerical examples of the potential impacts of catastrophic cases and MTF size on performance assessment. In Chapter Five, we explore the actual role of catastrophic cases in PMPM inpatient utiliza-tion. Excluding catastrophic cases may be useful, yet the practicality of doing so using MHS data systems is uncertain. We also explore this issue.
PMPM Outcomes Versus Episode-Based Performance
Assessing MTF PMPM utilization and costs contrasts with another broad framework for performance assessment in health care. Under this alternative, the cost or quality of “episodes” of care is assessed (GAO, 2007a). These episodes bundle together a “block of one or more medical services received by an individual during a period of relatively continuous contact with one or more providers of service, in relation to a particular medical problem or situation” (Solon et al., 1967). A cata-strophic case at a hospital is not conceptually equivalent to an episode of care, because an episode may include multiple encounters with mul-tiple health care providers.
While our quantitative analyses were limited in scope to PMPM outcomes, the advantages and disadvantages of episode-based perfor-mance assessment nevertheless merit discussion. Administrative com-plexity is a disadvantage of the episode-based approach. Data on care delivered by different providers on different occasions, if available, must be accurately linked into episodes.
Episode-based performance assessment has other disadvantages. First, the utilization of alternative treatments may not be measured accurately, depending on how episodes are defined. For example, the beginning of a new episode of a recurring problem may be identified by a doctor’s visit with the relevant diagnosis, even though the patient had recently been taking medication for the problem. Second, effective prevention strategies reduce the need for treatment, potentially lower-ing costs and improvlower-ing health. This aspect of performance may not be captured by an analysis of treatment episodes; PMPM costs do reflect all aspects of performance.
An advantage of episode-based performance assessment is that the results may be relatively “actionable.” For example, evidence that costly and invasive procedures are used for coronary care where drug therapy is appropriate could help in diagnosing and treating an MTF’s “cost problem.” Yet OASD(HA) would not need such information if MTF leaders had access to equivalent information and appropriate incentives to use it.
Another potential advantage is that episodes are defined for spe-cific medical conditions. Thus, differences in the mix of beneficiaries’
Performance Assessment in health Care 21
medical conditions would not systematically affect MTF performance assessments, making this approach relatively reliable. Furthermore, the occurrence of episodes is somewhat random. This randomness does not affect performance assessments based on actual episodes. Under this approach, then, it may be possible to identify more statistically signifi-cant differences in performance. It is also possible, however, that MTF leaders are able to manage the incidence of some medical conditions or the occurrence of certain episodes of care. If so, DoD might wish to assess performance in these dimensions but could not use the episode-based approach to do so.
23
ChAPTer FOur
Performance Assessment and MTF Size
This chapter explores changes in MTF outcomes over time based on OASD(HA)’s metrics for FYs 2004–2006, focusing in particular on the role of MTF size. We first describe the data set and then the analy-sis sample and outcomes. After characterizing MTF size, we describe the relationship between outcomes and size. We then assess changes in MTF outcomes over time. We also consider some additional issues, including the confidence level for statistically significant changes, per-formance assessment of Services as a whole, the length of the assess-ment period, and assessassess-ment relative to MHS trends. Chapter Five will explore the role that catastrophic cases play in assessing MTFs based on additional data.
Data Set on MTF Outcomes
OASD(HA) shared its data set on PMPM outcomes from the first quarter of FY 2004 through the second quarter of FY 2007 (Atkinson, 2007a, 2007b).
This data set includes the numbers of Prime enrollees and equiva-lent lives, as well as total utilization and costs among Prime enrollees, for parent MTFs on a monthly basis. Each of these fields is reported by beneficiary class, including active-duty personnel, the dependents of active-duty personnel, and retirees and their dependents.
Utilization is disaggregated into inpatient care, outpatient care, and drugs. Inpatient utilization is based on Relative Weighted Prod-ucts (RWPs), a DoD measure of workload that represents the
rela-tive resource consumption of patients’ hospitalizations (DoD, 2002). Outpatient utilization is based on Relative Value Units (RVUs), a val-uation or rating of physician services on the basis of relative physi-cian resource inputs to provide medical services (TRICARE Manage-ment Activity, 2002). Drug utilization is measured by the number of 30-day-equivalent prescriptions filled.
These measures are used in both military and nonmilitary health care settings to measure resource use across varied clinical circum-stances. For example, if two MTFs provide a hospital stay where one is for pneumonia while the other is for an organ transplant, the RWP measure of inpatient utilization will be higher (all else equal) at the latter MTF, as is appropriate.
Utilization and costs “roll up” (that is, include) all care received by each MTF’s enrollees, whether from the enrollment MTF, from other MTFs, or from civilian health care providers.
Analysis Sample and Outcomes
We analyze 114 parent MTFs located in the United States that appeared
in the data set in every month.1 A complete list of these MTFs can be
found in Appendix B.
Table 4.1 summarizes the outcomes we analyze, which include inpatient, outpatient, and drug utilization. OASD(HA)’s think-ing about MTF performance assessment has focused on utilization (Opsut, 2006). We also consider total costs, as these data were readily available.
OASD(HA) currently monitors monthly inpatient utilization (RWPs) per 1,000 equivalent lives, monthly outpatient utilization (RVUs) per 100 equivalent lives, monthly scripts (30-day-equivalents) per 100 equivalent lives, and annual total cost per equivalent life. As explained in Chapter Three, equivalent lives standardize enrollees according to their health risk.