The Screening Effect of the Private
Securities Litigation Reform Act
Stephen J. Choi, Karen K. Nelson, and A. C. Pritchard*
Prior research shows that the Private Securities Litigation Reform Act (PSLRA) increased the significance of merit-related factors in determining the incidence and outcomes of securities fraud class actions (Johnson et al. 2007). We examine two possible explanations for this finding: the PSLRA may have reduced the incidence of nonmeritorious litigation, or it may have changed thedefinitionof merit, effectively precluding claims that would have survived and produced a settlement pre-PSLRA. We find no evidence that pre-PSLRA claims that settled for nuisance value would be less likely to be filed under the PSLRA regime. There is evidence, however, that pre-PSLRA nonnuisance claims would be less likely to be filed under the PSLRA regime. The latter result, which we refer to as the screening effect, is particularly pronounced for claims lacking hard evidence of securities fraud or abnor-mal insider trading. We find only limited evidence of a similar screening effect for case outcomes.
I. I
ntroduction
What is a “meritorious” securities fraud class action? The only clear answer to this question is a suit that produces a judgment after trial. Trials, however,
*Address correspondence to A. C. Pritchard, University of Michigan Law School, Ann Arbor, MI 48109; email: [email protected]. Choi is Murray and Kathleen Bring Professor of Law, New York University School of Law; Nelson is Associate Professor of Management, Rice University, Jones Graduate School of Management; Pritchard is Frances and George Skestos Professor of Law.
We appreciate helpful comments from Un Kyung Park, an anonymous referee, and partici-pants at the University of Michigan Law and Economics Workshop, the Eugene P. and Delia S. Murphy Conference on Corporate Law at the Fordham University School of Law, the Institute for Law and Economics Seminar at the University of Pennsylvania Law School, and the Future of Securities Fraud Litigation Conference sponsored by the Financial Economics Institute of Claremont McKenna College and RAND Corporation. Pritchard received financial support from the Cook Fund at the University of Michigan Law School. PricewaterhouseCoopers pro-vided data on lawsuit filings.
Volume 6, Issue 1, 35–68, March 2009
© 2009, Copyright the Authors
Journal compilation © 2009, Cornell Law School and Wiley Periodicals, Inc. 35
are almost unheard of in this area; cases that are not dismissed are settled. A broader answer to the question is a case that produces a settlement instead of being dismissed. This answer is little better than the first, however, because defendants, anxious to avoid the distraction of litigation, high defense attorney fees, negative publicity surrounding a securities lawsuit, and the specter of potentially bankrupting damages, may be willing to pay a “nuisance” settlement to make the case go away, even when they perceive the likelihood of the plaintiff succeeding at trial as rather low (Pritchard 1999). As a policy matter, if we could screen out suits filed for their nuisance value, while leaving unobstructed suits with substantial evidence of merit, the liti-gation process would be unambiguously improved. Unfortunately, the diffi-culty of assessing merit without a judgment makes it impossible to measure precisely the proportion of nuisance settlements to settlements based on the strength of the claims.
Notwithstanding the difficulties inherent in assessing merit in securi-ties fraud class actions, Congress accepted the argument that plaintiffs’ attorneys were filing large numbers of claims without substantial evidence of fraud in an effort to “extort” nuisance settlements from defendants. To discourage such “frivolous” litigation, Congress enacted the Private Securi-ties Litigation Reform Act (PSLRA) in 1995. The goal of the legislation is to make settlement negotiations turn more on the strength of the evidence of fraud and less on the defense costs to be avoided by settlement.
The PSRLA includes a number of procedural provisions intended to filter out weaker claims early in the litigation process and thereby reduce the costs of defending nonmeritorious litigation. These procedural barriers have resulted in a higher percentage of securities fraud class actions being dis-missed (Foster et al. 2000). The number of suits being filed, however, has not declined. After an initial dip, the number of securities fraud class actions has returned to, and even exceeded in some years, its pre-PSLRA level (Foster et al. 2007). The larger number of filings suggests that the PSLRA may have done little to discourage the filing of frivolous suits, although it may have increased their likelihood of dismissal. A contrary view, however, is that the incidence of fraud may have increased even faster than the increase in class action filings. All else equal, the procedural barriers of the PSLRA likely raised the cost to plaintiffs’ attorneys of pursuing a class action and reduced the expected outcome from litigation. If this view is correct, the barriers erected by the PSLRA may be discouraging not only frivolous litigation, but also screening out litigation that would have been deemed meritorious under the pre-PSLRA standards.
Our study is the first to measure the magnitude of this screening effect. We collect two samples of securities class actions involving allegations of secondary market fraud—one from 1991 to 1995 (pre-PSLRA) and one from 1996 to 2000 (post-PSLRA). Each sued firm is matched with a nonsued firm from the same industry and time period. The matching procedure allows us to construct a litigation prediction model for each period based on the firms’ characteristics, including market capitalization, share turnover, stock price drop, accounting restatements, insider trading, earnings forecasts, and a variety of governance factors.
We apply our post-PSLRA litigation prediction model to the pre-PSLRA sample. By comparing the model’s predictions with the actual incidence of suits, we can identify which firms would have been sued (or not sued) had the PSLRA’s provisions been in effect during the pre-PSLRA period. The firms that the PSLRA model predicts should not have been sued but in fact were sued and that paid a nonnuisance settlement in the pre-PSLRA period provide a measure of the screening effect of the PSLRA. Our screening analysis allows us to present evidence on the proportion of firms that proved a profitable target for a securities class action in the pre-PSLRA period but not in the post-PSLRA period.
The screening may not all occur at the time the decision to file is made; additional screening may be done during the litigation process. Accordingly, we conduct a similar analysis using a settlements model, allowing us to identify firms that paid a settlement greater than nuisance value in the pre-PSLRA period, but who likely would not have done so had the PSLRA been in effect at the time.
We do not find statistically significant evidence that nuisance suits have been discouraged. Our results, however, suggest the PSLRA has had a screening effect; a substantial percentage of suits that would have resulted in a nonnuisance settlement prior to the PSLRA would not have been filed after Congress adopted the PSLRA. The screening effect dimin-ishes, however, if we consider cases with “hard evidence” of securities fraud—a restatement of earnings or revenues or an investigation by the SEC—or abnormal insider trading. Evidence of a similar screening effect with respect to outcomes, however, is weaker; the actual incidence of non-nuisance settlements is only marginally less than that predicted by the PSLRA model.
The article proceeds as follows. Section II provides institutional back-ground on the PSLRA and discusses related research. Section III develops our hypotheses. Section IV describes the sample selection procedure and
data collected. Section V presents our results. Section VI concludes the article with a summary and discussion of our major findings.
II. B
ackground
A. The Private Securities Litigation Reform Act
After extensive hearings, Congress concluded in 1995 that the potentially enormous damages in securities fraud class actions were encouraging frivo-lous “strike” suits (H.R. Rep. 1995; S. Rep. 1995). To check these perceived abuses, Congress enacted the PSLRA into law on December 22, 1995. The PSLRA contains a number of new hurdles for plaintiffs filing securities fraud complaints. Perhaps most daunting of these hurdles is the PSLRA’s safe harbor for the voluntary disclosure of financial projections and other forward-looking information.1 To qualify for safe-harbor protection, the statements must be identified as forward looking and be accompanied by “meaningful” cautionary language discussing important factors that could cause actual results to differ from those projected.2 In the absence of an appropriate disclaimer, the plaintiff must still prove that the statements were made with actual knowledge that they were false or misleading.
A more pervasive barrier to weak claims is the PSLRA’s stringent plead-ing standard, which makes it more difficult for plaintiffs to allege securities fraud without specific evidence of misconduct.3 Plaintiffs must specify in their complaint each statement alleged to have been misleading and the reasons the statement is misleading. In addition, plaintiffs must state with particularity facts giving rise to a “strong inference” that the defendant acted with “the required state of mind,” that is, with fraudulent intent.
Both the forward-looking safe harbor and the pleading standard are reinforced by the PSLRA’s discovery stay, preventing plaintiffs from
conduct-1See Exchange Act § 21E.
2Nelson and Pritchard (2007) investigate firms’ use of safe-harbor cautionary language,
devel-oping metrics to capture three attributes of “meaningful” cautionary language suggested by the PSLRA’s legislative history and subsequent court decisions. As predicted, the findings show that firms subject to greater litigation risk disclose more cautionary language, update the language more from year to year so that it is less boilerplate, and use language that is more easily understood by the average investor.
ing discovery while a motion to dismiss is pending.4 This provision is intended to prevent plaintiffs from engaging in a “fishing expedition” for evidence to build their case, which could cause defendants to settle dubious claims simply to avoid the high cost of discovery. Without discovery until after the motion to dismiss has been decided, however, plaintiffs’ attorneys face a higher cost in determining the presence of specific misleading state-ments and omissions and the materiality of such misstatestate-ments and omis-sions. Moreover, plaintiffs face a difficult time in gathering facts related to the state of mind of the defendants, which the PSLRA’s pleading standard makes a critical question in resolving the motion to dismiss.
Another significant provision of the PSLRA requires courts to review a securities fraud class action after the “final adjudication,” and impose sanctions (including the defendants’ attorney fees) if the court determines the lawsuit was frivolous.5 For those suits that lead to a settlement, courts must review attorney fees to ensure that they are “reasonable,” potentially reducing the expected return to plaintiffs’ attorneys for any given settle-ment or judgsettle-ment amount.6 Greater court scrutiny of both the merits of the complaint as well as the reasonableness of attorney fees lowers the expected return to plaintiffs’ attorneys from bringing a class action. Finally, the PSLRA provides for proportionate liability in Rule 10b-5 actions, relieving less culpable parties (such as auditors and outside direc-tors) of a portion of the total liability.7 This provision may reduce the funds available for settlement, thus reducing the potential returns from filing suit.
B. Related Literature
The earliest work in this area focuses on the market’s reaction to the PSLRA. Spiess and Tkac (1997) and Johnson et al. (2000) document that, on average, the PSLRA was wealth increasing for stockholders. Specifically, there was a significant negative market reaction to news releases indicating
4See Exchange Act § 21D(b)(3)(B).
5See Exchange Act § 21D(c).
6See Exchange Act § 21D(a)(6).
that President Clinton would veto the legislation, followed by a significant positive reaction to the veto override.8 Moreover, the market response is increasing in firms’ overall risk of litigation, but decreasing in the incremen-tal probability of being sued for fraud (Johnson et al. 2000). Also consistent with this evidence, Johnson et al. (2000) document a positive market reac-tion to a related event, a Ninth Circuit decision adopting a stringent inter-pretation of the PSLRA’s pleading standard. The reaction is particularly strong for firms headquartered in the Ninth Circuit and those at greatest risk of being sued in a securities class action. Taken together, the evidence suggests that shareholders viewed the PSLRA’s restrictions on securities litigation as beneficial.
Other research focuses more directly on the effect of the PSLRA on litigation. Studies describing the frequency of lawsuit filings and the type of allegations show that lawsuit filings initially declined under the PSLRA, but subsequently recovered to pre-PSLRA levels (Grundfest & Perino 1997; PricewaterhouseCoopers 2000; Perino 2003).9 In addition, allegations of accounting irregularities and insider trading increased, while cases based on allegations of false forecasts decreased.
Pritchard and Sale (2005) study how judges in the Second and Ninth Circuits apply the PSLRA to resolve motions to dismiss securities fraud complaints. They find that complaints are significantly more likely to be dismissed in the Ninth Circuit. Moreover, allegations of insider trading positively correlate with dismissal in both circuits, but the circuits vary in their approaches to allegations of accounting violations and false forward-looking statements. However, the study does not compare the pre- and post-PSLRA periods. Beatty et al. (2001) find the risk of litigation in connec-tion with an IPO declined significantly following the enactment of the PSLRA, but do not provide evidence on the determinants of those filings. Finally, Bajaj et al. (2003) find that even though settlements increased, on average, after the passage of the PSLRA, investors recovered a smaller per-centage of potential losses. The study does not, however, compare
system-8Ali and Kallapur (2001), however, argue that the positive abnormal return at the time of the
PSLRA’s enactment is more likely a response to the presidential veto rather than the override, and thus shareholders considered the PSLRA to be harmful.
9Most of the decline appears to be attributable to plaintiffs shifting venue to state courts to avoid
the PSLRA. However, the Securities Litigation Uniform Standards Act was passed on Nov. 3, 1998, effectively closing this loophole.
atically whether the determinants of those settlements changed with the adoption of the PSLRA.
Two prior papers relate most directly to our study. Johnson et al. (2007) (JNP) analyze whether merit-related factors matter more in the post-PSLRA period. They find that certain indicia of fraud, such as accounting restatements, are more significant in explaining the incidence and outcome of suits filed after the PSLRA relative to suits filed before its enactment. Moreover, forward-looking statements are less significant in explaining the incidence and outcome of suits post-PSLRA.10 JNP does not address the related question of whether the PSRLA has screened out claims that would have been deemed meritorious under pre-PSLRA standards. Choi (2007) examines this question in connection with firms making initial public offer-ings. He finds that companies engaged in smaller offerings or with a lower secondary market volume (and therefore reduced potential damages) are significantly less likely to be the target of a securities class action in the post-PSLRA period. He also provides evidence that pre-PSLRA nonnuisance claims lacking obvious hard evidence indicia of fraud (i.e., an accounting restatement or SEC action) would have faced a lower probability of suit and a greater likelihood of receiving a dismissal or low-value settlement in the post-PSLRA period. He posits that the PSLRA caused plaintiffs’ attorneys to shift their attention to the subset of fraud cases where the presence of hard evidence of fraud made it easier to meet the enhanced pleading require-ments under the PSLRA, absent discovery.
The sample in Choi (2007) is limited to lawsuits arising out of initial public offerings. The primary liability exposure for IPO firms, however, is under the main Securities Act anti-fraud provision, Section 11. Only part of the PSLRA applies to Securities Act claims. Although plaintiffs must show the presence of a materially misleading statement or omission, Section 11 does not require that plaintiffs plead scienter on the part of defendants. Thus, the central provision of the PSLRA’s pleading standard does not apply to Secu-rities Act claims. Moreover, the safe harbor for forward-looking statements does not shelter statements made by IPO firms. Therefore, a comprehensive
10Johnson et al. (2001) examine whether firms changed their disclosure policies in response to
the safe harbor. They find a significant increase in the frequency of firms issuing forecasts and the number of forecasts issued in the first year following enactment of the PSLRA, and that the change in disclosure is increasing in firms’ ex ante risk of litigation. Although this evidence suggests that managers believe the safe harbor reduced legal exposure, Johnson et al. (2001) do not examine the relation between disclosure and litigation in the post-PSLRA period.
evaluation of the screening effect of the PSLRA requires the study of open-market fraud claims litigated under Rule 10b-5, which were Congress’s prin-cipal focus in enacting the PSLRA. These claims are also considerably more common than Section 11 claims.
III. R
esearch
H
ypotheses
A. Filing of Nuisance Claims
It is widely agreed that the PSLRA has made it more difficult to file a securities fraud complaint that can withstand a motion to dismiss. Given the higher bar erected by the PSLRA, we posit that suits resulting in a dismissal or nuisance settlement before the enactment of the law will be less likely to be filed post-PSLRA. We label this the nuisance suit effect.11
H1: Nuisance Suit Effect. Plaintiffs’ attorneys are less likely post-PSLRA to file
suits that would have resulted in dismissal or a low-value settlement pre-PSLRA.
B. Screening of Meritorious Claims
The more stringent standards of the PSLRA may screen out some of the wheat with the chaff. Accordingly, we test whether some suits that resulted in a nontrivial settlement prior to the PSLRA will not be filed under the new regime. We label this the screening effect.
H2: Screening Effect. Plaintiffs’ attorneys are less likely post-PSLRA to file suits
that would have resulted in a high-value settlement pre-PSLRA.
The impact of the PSLRA in raising the costs for pursuing meritorious actions may not be uniform. Below, we refine our screening effect hypothesis to consider three factors that are likely to affect the extent to which merito-rious claims are screened out by the stringent provisions of the PSLRA. 1. Hard Evidence
Some cases will have prefiling hard evidence of fraud, increasing the prob-ability of recovery and the expected value of filing suit, holding the stakes available constant. Hard evidence of fraud facilitates the ability of plaintiffs’
attorneys to meet the various PSLRA-imposed requirements, particularly the heightened pleading requirements at the motion to dismiss stage for Rule 10b-5 actions (i.e., while the discovery stay prevents plaintiffs’ attorneys from gaining access to a company’s nonpublic documents).
We define prefiling hard evidence as a public announcement prior to the lawsuit filing of an accounting restatement (or an inquiry that is expected to lead to a restatement) or an SEC investigation or enforcement action. A key element of any securities fraud claim is a material misstatement or omission. Some of the strongest evidence to satisfy this requirement available to plaintiffs’ lawyers is a violation of generally accepted accounting principles (GAAP) that results in an earnings restatement. A restatement is not required unless there has been a material misstatement. Moreover, given the importance that investors place on earnings in valuing a company’s stock, a restatement of earnings is likely to correlate with large expected damages.
The existence of an SEC investigation does not establish any element of the plaintiff’s claim, but it does suggest a substantial likelihood of fraud. The SEC has limited resources, but many instances of fraudulent conduct it can pursue. One plausible theory of the SEC’s enforcement strategy is that the strength of the available evidence of fraud is one important factor (among others) guiding the agency’s enforcement decisions. The more egregious the fraud, the easier the case is to prove. On this theory, an SEC enforcement action signals to plaintiffs’ lawyers a high probability of recovery.
Prior to the PSLRA, the discovery process allowed plaintiffs’ attorneys to obtain evidence of the fraud from the defendants to aid in drafting an adequate complaint. Congress adopted the PSLRA’s discovery stay provision to discourage this “fishing expedition” discovery, but it may also have dis-couraged meritorious suits for which hard evidence was not publicly avail-able. The absence of an announcement of an accounting restatement or SEC investigation prior to the filing of suit does not mean the suit is without merit. Misstatements unrelated to financial results are equally actionable, and given that the SEC has finite enforcement resources, many instances of fraud may escape SEC investigation. Thus, we predict the PSLRA discourages litigation that would have been deemed nonnuisance under pre-PSLRA standards, but lacks prefiling hard evidence of fraud.
H3: Screening Effect—Hard Evidence. Plaintiffs’ attorneys are less likely
post-PSLRA to file suits that would have resulted in a high-value settlement pre-PSLRA without prefiling hard evidence of fraud.
2. Abnormal Insider Trading
Insider trading contemporaneous with alleged fraud can be used to show that the defendants acted with the requisite scienter to meet the PSLRA’s pleading standard. With certain exceptions, insiders must publicly disclose their trades in Form 4 filings with the SEC. Thus, insider trading provides an alternative to prefiling hard evidence for plaintiffs’ lawyers seeking to draft a complaint likely to withstand a motion to dismiss. Insider trading differs from accounting restatements and SEC investigations, however, because it offers less clear-cut support for a claim of fraud. Insider sales are quite common in many industries due to the prevalence of compensation schemes relying heavily on options. Pritchard and Sale (2005) show that, relative to other complaints, complaints alleging insider trading are more likely to be dismissed. This finding suggests that plaintiffs’ attorneys have been some-what scattershot with their allegations of insider trading. The doctrinal explanation for the higher dismissal rate of insider-trading-based complaints is that courts hold that insider trading must be unusual in amount or timing to support an inference that the defendant acted with fraudulent intent. Thus, we posit that claims lacking evidence ofabnormalselling by insiders are less likely to be filed post-PSLRA if they also lack prefiling hard evidence of fraud.
H4: Screening Effect—Abnormal Insider Trading. Plaintiffs’ attorneys are less likely
post-PSLRA to file suits that would have resulted in a high-value settlement pre-PSLRA without evidence of abnormal insider trading or hard evidence of fraud.
3. Earnings Warnings
In enacting the PSLRA, Congress expressed concern that companies failing to meet earnings expectations were vulnerable to securities fraud class actions because the inevitable drop in stock price that follows could trigger a search by plaintiffs’ attorneys for a prior optimistic statement that could now be alleged to be fraudulent. Congress addressed this concern with a forward-looking safe harbor, which makes it more difficult to bring fraud claims based on projections. Consequently, courts subject these statements to more exacting scrutiny than other general allegations of misleading state-ments or omissions. In effect, Congress raised the standard for what counts as “meritorious” for a class of claims that legislators suspected had a very low correlation with fraud. This more stringent definition of merit may have discouraged plaintiffs’ claims based on a failure to meet earnings
expecta-tions. On the other hand, it costs little to include a forward-looking allega-tion in a complaint that also includes allegaallega-tions based on hard evidence of fraud or abnormal insider trading. JNP present evidence that forecasting allegations declined only slightly following the PSLRA, but they note a sharp drop in the incidence of stand-alone forecasting allegations, that is, unac-companied by an accounting allegation or an insider trading allegation.
H5: Screening Effect—Earnings Warnings. Plaintiffs’ attorneys are less likely
post-PSLRA to file suits that would have resulted in a high-value settlement pre-PSLRA based on a failure to meet earnings forecasts without evidence of abnormal insider trading or hard evidence of fraud.
C. Outcomes
The filing of claims by plaintiffs’ attorneys presumably is informed by their expectations regarding the outcomes of those cases. Given the barriers erected by the PSLRA, claims lacking hard evidence or evidence of abnormal insider trading may be more likely to be dismissed or settled for negligible amounts. Moreover, suits triggered by earnings warnings lacking hard evi-dence or abnormal insider trading are also more likely to be dismissed or settled on the cheap.
H6A: Hard Evidence Outcomes. Suits lacking hard evidence of fraud that received
a nonnuisance outcome pre-PSLRA are more likely to receive a dismissal or low-value settlement post-PSLRA.
H6B: Abnormal Insider Trading Outcomes. Suits lacking evidence of abnormal
insider trading or hard evidence of fraud that received a nonnuisance outcome pre-PSLRA are more likely to receive a dismissal or low-value settlement post-PSLRA.
H6C: Earnings Warning Outcomes. Suits based on warning of a failure to meet
earning forecasts without evidence of abnormal insider trading or hard evidence of fraud that received a nonnuisance outcome pre-PSLRA are more likely to receive a dismissal or low-value settlement post-PSLRA.
IV. S
ample
S
election and
D
ata
A. Sample
We use the Securities Class Action Alert to identify firms sued in securities fraud class actions in the pre-PSLRA period (1991–1995), and the Stanford Securities Class Action Clearinghouse to identify firms sued in the post-PSLRA period (1996–2000). We exclude lawsuits involving initial public
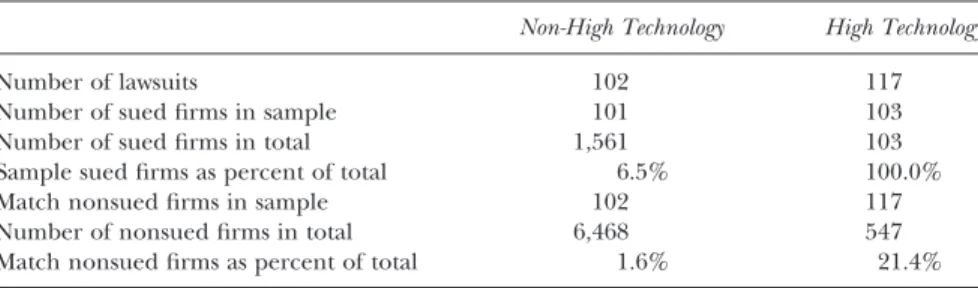
offerings, identified from Choi (2007), because they are subject to a different set of liability rules. Following JNP, the first portion of our sample consists of firms sued in the computer hardware (SIC Codes 3570–3577) and computer software (SIC Codes 7370–7379) industries. The high-technology sector has been the most common target for class actions both before and after the PSLRA, unlike other sectors where the incidence of litigation has fluctuated over time for reasons unrelated to passage of the PSLRA.12To broaden the generalizability of our findings, however, we include a similar number of sued firms randomly selected from other (nonfinancial services) industries. As reported in Table 1, Panel A, our Non-High Technology (High Technology) lawsuit sample consists of 102 (117) lawsuits for 101 (103) firms. Some firms appear more than once in our sample because they were sued more than one time during the sample period. Our sample captures essentially all the High Technology sued firms, and approximately 6.5 percent of the Non-High Technology sued firms.13Panel B of Table 1 reports the industry distribution for our sample of 219 lawsuits, based on three-digit SIC codes. Other than the concentration of observations in the high-tech industry (SIC Codes 357 and 737), no other industry represents more than 5 percent of the sample.
We construct a control sample by matching each lawsuit firm with a firm from the same industry that was not sued, but that experienced a similar one-day stock price decline during the sued firm’s class period.14 Losses suffered by investors are a critical element in determining damages, and thus a stock price decline is a necessary, but not sufficient, condition for litigation. Plaintiffs’ attorneys use price declines as an initial screen in selecting which firms to sue. Not all these firms are sued, however, as plaintiffs’ attorneys search for other factors that suggest a lawsuit has sufficient probability of recovery, such as those discussed in the preceding section. As shown in
12For example, litigation against finance companies declined significantly in the post-PSLRA
period due to the end of the savings and loan crisis and an associated reduction in loan loss reserve litigation (Grundfest & Perino 1997).
13To determine the population of 1,561 non-high technology sued firms during our sample
period, we extrapolate the total number of 2000 IPO suits using the average from 1991–1999 based on Choi (2007). We then subtract the total number of IPO suits from 1991–2000 from the total overall number of suits to determine the population of sued firms.
14For a small number of firms we had difficulty finding matches with all other data items
available. For these firms, we extended the search for a match with a similar price drop up to three months after the end of the class period.
Table 1: Sample Information
Panel A: Sample Selection
Non-High Technology High Technology
Number of lawsuits 102 117
Number of sued firms in sample 101 103
Number of sued firms in total 1,561 103
Sample sued firms as percent of total 6.5% 100.0%
Match nonsued firms in sample 102 117
Number of nonsued firms in total 6,468 547
Match nonsued firms as percent of total 1.6% 21.4%
Panel B: Industry Distribution of Sued Firms in the Sample by 3-Digit SIC Code
SIC Code Frequency SIC Code Frequency SIC Code Frequency
131 1 371 3 553 1 152 1 376 1 562 1 203 1 382 2 571 1 211 1 384 8 581 5 221 1 394 2 596 4 225 1 399 1 599 1 232 2 410 1 701 2 273 1 451 1 737 67* 275 1 481 6 738 2 281 1 484 1 781 1 283 11 489 1 799 1 284 2 492 1 802 1 308 1 493 1 806 1 353 2 495 1 808 1 355 1 506 1 809 3 356 1 508 1 873 1 357 50* 509 1 874 1 366 8 513 3 367 1 521 1 Total 219
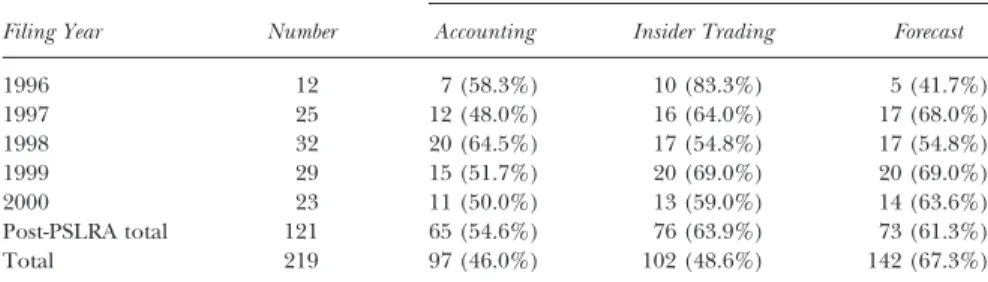
Panel C: Lawsuit Filings and Allegations
Filing Year Number
Allegations
Accounting Insider Trading Forecast
1991 18 6 (35.3%) 4 (25.0%) 12 (70.6%) 1992 22 7 (36.8%) 5 (26.3%) 15 (79.0%) 1993 16 6 (42.9%) 3 (21.4%) 12 (85.7%) 1994 23 7 (30.4%) 9 (39.1%) 17 (73.9%) 1995 19 6 (31.6%) 5 (26.3%) 13 (68.4%) Pre-PSLRA total 98 32 (34.8%) 26 (28.6%) 69 (75.0%)
Table 1, Panel A, the control sample of nonsued firms for the Non-High Tech (High Tech) sample comprises 1.6 percent (21.4 percent) of the population available on CRSP.15
B. Data
We use data from a variety of sources, including the Securities Class Action Alert, Stanford Securities Class Clearinghouse, disclosures in firms’ periodic
15In the next section of the article, we discuss research design issues related to the unbalanced
representation of the sued and nonsued firms in the sample. Table 1: Continued
Filing Year Number
Allegations
Accounting Insider Trading Forecast
1996 12 7 (58.3%) 10 (83.3%) 5 (41.7%) 1997 25 12 (48.0%) 16 (64.0%) 17 (68.0%) 1998 32 20 (64.5%) 17 (54.8%) 17 (54.8%) 1999 29 15 (51.7%) 20 (69.0%) 20 (69.0%) 2000 23 11 (50.0%) 13 (59.0%) 14 (63.6%) Post-PSLRA total 121 65 (54.6%) 76 (63.9%) 73 (61.3%) Total 219 97 (46.0%) 102 (48.6%) 142 (67.3%)
Panel D: Lawsuit Outcomes
Outcome Pre-PSLRA Post-PSLRA
Frequency
Dismissed 21 (21.4%) 37 (30.6%)
Settled (in $ millions)
<$2 15 (15.3%) 13 (10.7%)
$2 to<$5 19 (19.4%) 23 (19.0%)
$5 to<$10 20 (20.4%) 20 (16.5%)
>$10 20 (20.4%) 27 (22.3%)
Trial verdict for defendants 3 (3.1%) 0 (0.0%)
Undisclosed 0 (0.0%) 1 (0.9%)
Total 98 (100.0%) 121 (100.0%)
Amount (in $ millions)
Mean (including dismissals) 11.26 (8.50) 19.00 (13.14)
Median (including dismissals) 5.76 (3.20) 5.59 (3.38)
Maximum 123.08 251.83
*Indicates High Tech sample SIC codes in Panel B. Settlement amounts in Panel D are adjusted for inflation to year 2000 dollars.
SEC filings, discussions of cases in judicial opinions, websites of various claims administrators, and information provided by PricewaterhouseCoo-pers, to identify the date the lawsuit was filed, the class period, and the lawsuit outcome. We obtain market and accounting data from the CRSP and Compustat tapes. We search Lexis and periodic SEC filings to identify accounting restatements and voluntary management earnings forecasts. We obtain insider trading data from Thomson Financial. Finally, we collect by hand information regarding corporate governance structure from sample firms’ last proxy statement prior to the beginning of the class period, if available, or, if not, the first available proxy after the beginning of the class period.
C. Descriptive Statistics
As shown in Table 1, Panel C, 98 sample firms were sued pre-PSLRA and 121 post-PSLRA. Consistent with JNP, the proportion of lawsuits alleging accounting fraud and insider trading rises sharply after the PSLRA, while the percentage of suits alleging false forecasts declines, although not as precipi-tously. These trends are consistent with plaintiffs’ lawyers relying more on objective evidence to support their claims of fraud and the forward-looking safe harbor discouraging the filing of allegations based on forecasts. Table 1, Panel D summarizes the outcomes of the lawsuits. The frequency of dismiss-als increased from 20 percent pre-PSLRA to nearly 31 percent post-PSLRA. Mean settlement values are nearly double post-PSLRA, although this trend appears to be driven by a few large settlements, as the median is essentially unchanged from the pre-PSLRA period.16
In Table 2, we provide descriptive statistics comparing the variables used in our analysis for the pre- and post-PSLRA periods.17To investigate the association between a screening effect and hard evidence of fraud, we con-sider firms with either an earnings restatement or an SEC investigation. Further, we distinguish between hard evidence that is publicly available prior to the filing of the complaint and that which is not. The findings indicate that both restatement and prefiling restatement are significantly greater in the post-PSLRA period while there is no evidence of a significant
16All settlement amounts reported in the article have been adjusted for inflation to year 2000
dollars.
Table 2: Descriptive Statistics Comparing the Pre-and Post-PSLRA Periods Variables Pre-PSLRA ( N = 196) Post-PSLRA ( N = 242) Test of Dif ferences Mean Median SD Mean Median SD Mean Dichotomous Restatement 0.07 0.00 0.26 0.18 0.00 0.38 0.00 Prefiling restatement 0 .05 0 .00 0 .22 0.15 0.00 0.36 0.00 SEC investigation 0 .09 0 .00 0 .28 0.10 0.00 0.30 0.66 Prefiling SEC investigation 0 .02 0 .00 0 .12 0.03 0.00 0.18 0.24 Hard evidence 0.12 0.00 0.33 0.19 0.00 0.40 0.04 Prefiling h ard evidence 0.07 0.00 0.25 0.14 0.00 0.35 0.01 Earnings warning 0 .35 0 .00 0 .48 0.37 0.00 0.48 0.59 Positive forecast 0.26 0.00 0.44 0.25 0.00 0.43 0.86 Negative forecast 0.18 0.00 0.39 0.16 0.00 0.37 0.46 Continuous Abnormal insider trading -0.01 0.00 0.260 -0.09 0.00 0.54 0.06 0.03 Avg. tenure 5 .49 4 .55 4 .25 5.06 4.29 3.59 0.26 0.49 Busy 1 .58 1 .33 1 .39 1.39 1.25 1.11 0.12 0.34 Independent 0.57 0.58 0.18 0.59 0.60 0.19 0.25 0.19 Audit m eetings 2.25 2.00 1.70 2.32 2.00 1.94 0.71 0.91 Independent audit 0 .74 0 .80 0 .32 0.80 1.00 0.30 0.04 0.03 Market cap. (in $ m illions) 2 ,208.1 1 73.9 8,683.2 3,566.7 205.0 1,6050.6 0.29 0.69 Turnover 0.55 0.53 0.33 0.69 0.79 0.30 0.00 0.00 Min. return -0.22 -0.21 0.12 -0.28 -0.27 0 .15 0.00 0.00 N ote : V ariable definitions are in the Appendix. The pre-PSLRA period is 1 991–1995 and the post-PSLRA period is 1996–2000. The p values for tests of dif ferences in means are from a c 2test for the dichotomous variables and a t test for the continuous variables. The p values for tests of dif ferences in medians for the continuous variables are from a W ilcoxon rank sum test.
change in the frequency of SEC investigations. Considering both types of hard evidence together reveals that hard evidence and prefiling hard evidenceare significantly greater in the post-PSLRA period.
Insider trading activity can serve as alternative support to prefiling hard evidence for plaintiffs’ lawyers drafting a securities fraud complaint. Follow-ing JNP, we measure abnormal insider tradFollow-ing as the difference between the net amount of shares traded (in millions) by directors and officers during the class period and the net amount of shares traded by directors and officers during an equal number of days preceding the start of the class period. A negative (positive) value indicates abnormal net sales (purchases). We find thatabnormal insider tradingis significantly more negative in the post-PSLRA period, indicating an increase in unusual sales activity.
A voluntary warning of bad earnings news (earnings warning) can cause a sudden stock price drop that attracts the attention of the plaintiffs’ bar, but is unlikely to survive as a stand-alone basis for complaint in the post-PSLRA period. We distinguish an earnings warning on either the last day of the class period or the day with the most negative stock return from a
negative forecastissued at any other point during the class period that might serve to manage expectations downward and reduce litigation expo-sure.18Conversely, apositive forecastcould leave the firm vulnerable to litigation if the projections are not realized. Table 2 reveals that none of the voluntary disclosure variables are significantly different between the two periods.
In addition to the above factors we hypothesize are associated with a screening effect, we control for several other variables that may play a role in securities litigation. Specifically, following JNP, our analysis includes the average tenure of outside members of the board (avg.tenure), the average number of other directorships held by outside directors (busy), the percent-age of outside directors (independent), the number of meetings held by the firm’s audit committee (audit meetings), and the percentage of indepen-dent directors on the audit committee (independent audit). Only one of the governance variables, independent audit, is significantly different between the pre- and post-PSLRA periods, with audit committees more independent after the PSLRA.
18Our definition of the class period includes one trading day following the end of the class
period specified in the lawsuit. This is because the revelation of potential fraud that triggers the suit may occur after the market closed, resulting in a negative market reaction the following trading day.
Finally, prior research indicates that market value of equity (market cap.) and share turnover (turnover) and the magnitude of the minimum one-day class period return (min.return) are positively associated with the incidence of lawsuits (e.g., Francis et al. 1994; Jones & Weingram 1996; JNP).19 The results in Table 2 reveal no significant difference in firm size between the pre- and post-PSLRA periods. However, share turnover is sig-nificantly higher and the minimum one-day return is sigsig-nificantly more negative in the post-PSLRA period.
Table 3 compares the lawsuit firms with the control sample of nonsued firms. In the pre-PSLRA period (Panel A), lawsuits firms are significantly more likely to have a restatement or an SEC investigation, but the difference is not significant for the subset of restatements or investigations publicly available prior to lawsuit filing. In contrast, in the post-PSLRA period (Panel B), not only do the sued firms have more restatements and SEC investiga-tions, but the differences are significant both overall and for the subset of announcements available prior to lawsuit filing. A similar pattern is evident for abnormal insider trading. Abnormal insider trading is significantly more negative for lawsuit firms only in the post-PSLRA period. In contrast, sued firms are significantly more likely to issue an earnings warning or a positive forecast in both the pre- and post-PSLRA periods.
Findings for the governance variables reveal no significant differences between the sued and control firms in the pre-PSLRA period. Post-PSLRA, however, sued firms have busier directors, as expected, but also, unexpect-edly, more independent boards and audit committees and those audit com-mittees meet more frequently. Overall, these differences suggest that the sued firms may recognize they are in need of more intensive monitoring, but that this monitoring is not sufficient to protect them from suit. The gover-nance variables, however, correlate fairly highly with firm size, so these differences may simply reflect the preference of plaintiffs’ lawyers to sue larger firms. Finally, as predicted, our three measures relating to damages,
market cap.,turnover, andmin.return, are significantly greater for sued firms in both periods.
We provide a comparison of the High Technology and Non-High Technology lawsuit firms in Table 4. The two subsamples are similar along most dimensions. However, High Technology firms are significantly more
19For most of the sued firms, the minimum return occurs on the day the bad news giving rise to
Table 3: Comparison of Lawsuit and Control Firms Panel A : P re-PSLRA Period (1991–1995) Variables Lawsuit Firms ( N = 98) Control Firms ( N = 98) Test of Dif ferences Mean Median SD Mean Median SD Mean Dichotomous Restatement 0.11 0.00 0.32 0.03 0 .00 0.17 0.03 Prefiling restatement 0 .07 0 .00 0 .26 0.03 0 .00 0.17 0.19 SEC investigation 0 .16 0 .00 0 .37 0.01 0 .00 0.10 0.00 Prefiling SEC investigation 0 .02 0 .00 0 .14 0.01 0 .00 0.10 0.56 Hard evidence 0.20 0.00 0.41 0.04 0 .00 0.20 0.00 Prefiling h ard evidence 0.09 0.00 0.29 0.04 0 .00 0.20 0.15 Earnings warning 0 .57 1 .00 0 .50 0.12 0 .00 0.33 0.00 Positive forecast 0.34 0.00 0.48 0.17 0 .00 0.38 0.01 Negative forecast 0.21 0.00 0.41 0.15 0 .00 0.36 0.27 Continuous Abnormal insider trading -0.02 0.00 0.34 -0.00 0 .00 0.15 0.59 0.63 Avg. tenure 5 .07 4 .18 3 .38 5.90 5 .34 4.96 0.17 0.55 Busy 1 .60 1 .50 1 .15 1.56 1 .23 1.60 0.82 0.25 Independent 0.55 0.52 0.18 0.58 0 .60 0.19 0.21 0.20 Audit m eetings 2.45 2.00 1.57 2.06 2 .00 1.57 0.11 0.13 Independent audit 0 .76 1 .00 0 .31 0.71 0 .71 0.34 0.26 0.24 Market cap. (in $ m illions) 3470.6 6 05.2 11749.6 9 45.5 7 1.6 3209.2 0 .04 0.00 Turnover 0.69 0.77 0.28 0.41 0 .37 0.30 0.00 0.00 Min. return -0.24 -0.24 0 .11 -0.19 -0.16 0.12 0.00 0.00
Table 3: Continued Panel B : P ost-PSLRA Period (1996–2000) Variables Lawsuit Firms ( N = 121) Control Firms ( N = 121) Test of Dif ferences Mean Median SD Mean Median SD Mean Dichotomous Restatement 0.30 0.00 0.46 0.06 0 .00 0.23 0.00 Prefiling restatement 0 .24 0 .00 0 .43 0.06 0 .00 0.23 0.00 SEC investigation 0 .19 0 .00 0 .39 0.01 0 .00 0.09 0.00 Prefiling SEC investigation 0 .06 0 .00 0 .23 0.01 0 .00 0.09 0.03 Hard evidence 0.33 0.00 0.47 0.06 0 .00 0.23 0.00 Prefiling h ard evidence 0.23 0.00 0.42 0.06 0 .00 0.23 0.00 Earnings warning 0 .60 1 .00 0 .49 0.15 0 .00 0.36 0.00 Positive forecast 0.31 0.00 0.47 0.18 0 .00 0.39 0.02 Negative forecast 0.19 0.00 0.39 0.12 0 .00 0.33 0.16 Continuous Abnormal insider trading -0.19 -0.02 0 .58 0.00 0 .00 0.47 0.01 0.00 Avg. tenure 4 .90 4 .40 2 .84 5.23 4 .00 4.22 0.48 0.64 Busy 1 .62 1 .60 1 .07 1.17 1 .00 1.10 0.00 0.00 Independent 0.62 0.65 0.18 0.55 0 .57 0.19 0.00 0.01 Audit m eetings 2.65 2.00 1.96 1.99 2 .00 1.86 0.01 0.00 Independent audit 0 .85 1 .00 0 .25 0.74 1 .00 0.33 0.00 0.01 Market cap. (in $ m illions) 6348.4 5 44.8 22055.7 7 85.0 7 0.0 3916.0 0 .01 0.00 Turnover 0.81 0.92 0.25 0.57 0 .57 0.30 0.00 0.00 Min. return -0.31 -0.31 0 .16 -0.24 -0.21 0.14 0.00 0.00 N ote : V ariable definitions are in the Appendix. The p values for tests of dif ferences in means are from a c 2test for the dichotomous variables and a t test for the continuous variables. The p values for tests of dif ferences in medians for the continuous variables are from a W ilcoxon rank sum test.
Table 4: Comparison of High Technology and Non-High Technology Lawsuit Firms Variables High Technology ( N = 117) Non-High Technology ( N = 102) Test of Dif ferences Mean Median SD Mean Median SD Mean Dichotomous Restatement 0.24 0.00 0.43 0.19 0.00 0.39 0 .34 Prefiling restatement 0 .21 0 .00 0.41 0.12 0.00 0.32 0 .08 SEC investigation 0 .18 0 .00 0.39 0.18 0.00 0.38 0 .95 Prefiling SEC investigation 0 .05 0 .00 0.22 0.03 0.00 0.17 0 .42 Hard evidence 0.27 0.00 0.45 0.28 0.00 0.45 0 .99 Prefiling h ard evidence 0.21 0.00 0.41 0.13 0.00 0.34 0 .13 Earnings warning 0 .74 1 .00 0.44 0.41 0.00 0.50 0 .00 Positive forecast 0.39 0.00 0.49 0.25 0.00 0.43 0 .02 Negative forecast 0.22 0.00 0.42 0.18 0.00 0.38 0 .40 Continuous Abnormal insider trading -0.14 0.00 0.63 -0.08 0.00 0.27 0 .35 0.65 Avg. tenure 5 .26 5 .11 2.82 4.66 3.78 3.36 0 .15 0.03 Busy 1 .85 1 .89 1.06 1.34 1.07 1.10 0 .00 0.00 Independent 0.63 0.63 0.16 0.55 0.54 0.20 0 .00 0.00 Audit m eetings 3.03 3.00 2.00 2.01 2.00 1.61 0 .00 0.00 Independent audit 0 .86 1 .00 0.23 0.76 0.93 0.32 0 .00 0.01 Market cap. (in $ m illions) 3842.8 7 07.9 11604.9 6457.5 366.5 2 3592.9 0.29 0.01 Turnover 0.78 0.91 0.26 0.73 0.83 0.28 0 .11 0.08 Min. return -0.29 -0.28 0.13 -0.27 -0.25 0.15 0 .55 0.34 N ote : V ariable definitions are in the Appendix. The p values for tests of dif ferences in means are from a c 2test for the dichotomous variables and a t test for the continuous variables. The p values for tests of dif ferences in medians for the continuous variables are from a W ilcoxon rank sum test.
likely to have aprefiling restatementand to issue anearnings warning
or apositive forecast. In addition, there are some significant differences in governance structures. Specifically, High Technology firms have a greater percentage of independent directors, but those directors also hold more other directorships. In addition, audit committees of High Technology firms hold more meetings and have a higher percentage of outside directors.
V. R
esults
A. Screening of Lawsuit Filings
In this section, we provide evidence on whether the PSLRA has excluded cases that would have been brought under the pre-PSLRA regime. Because Congress explicitly intended to discourage “nuisance” litigation, we expect to find at least some cases excluded if the PSLRA is working as intended. Our first hypothesis tests for this nuisance suit effect. Congress claimed, however, that it did not want to discourage “meritorious” litigation in enacting the PSLRA. Our remaining hypotheses examine various dimensions of this screening effect. Screening frivolous litigation without discouraging merito-rious litigation would be an ideal outcome, the policy equivalent of a free lunch.
It is not possible to identify directly the suits eliminated by the PSLRA; cases not brought leave no paper trail. Instead, we investigate the extent to which the PSLRA filters litigation that would have been deemed frivolous pre-PSLRA, or discourages litigation that would have been deemed merito-rious pre-PSLRA. This inquiry requires a definition of merit. Following JNP, we consider settlements that exceed 0.5 percent of market capitalization 10 days before the end of the class period to be nonnuisance suits. To test whether certain types of lawsuits are less likely to be filed post-PSLRA, we estimate how such suits actually filed in the pre-PSLRA period would have fared in the post-PSLRA period using the following methodology.
1. Estimate a logit model for the decision to file suit in the post-PSLRA period.
2. Use the results from the estimated logit model in Step 1 to generate
predictedprobabilities of filing in the post-PSLRA period for certain
types of firms (and their corresponding matches) drawn from the pre-PSLRA sample.
3. Test the null hypothesis that the actual probability of filing in the pre-PSLRA period is the same as the predicted probability of filing in the post-PSLRA period.
Table 5 presents the results of the lawsuit prediction model for the post-PSLRA period (Step 1 in the above methodology). Errors are clustered by three-digit SIC code. Because of missing data, the estimation includes 229 of the 242 post-PSLRA observations. The model correctly classifies 82.1 percent of the sample observations.20
As expected, and consistent with JNP,prefiling hard evidenceand
earnings warning are significant determinants of post-PSLRA lawsuit
filings. Abnormal insider tradinghas the predicted negative sign, but is
20Specifically, 14.5 percent of the sued firms were classified by the model as having less than a
50 percent probability of suit, while 21.4 percent of the control firms were classified by the model as having a greater than or equal to 50 percent probability of suit. Overall, the model correctly classifies over 80 percent of the sample, mitigating concerns that estimation error in the litigation prediction model affects inferences in our primary tests.
Table 5: Factors Associated with Lawsuit Filings Post-PSLRA
Variable Prediction Coefficient pValue
Constant ? -6.44 0.00
Prefiling hard evidence + 2.37 0.00
Abnormal insider trading - -1.01 0.16
Earnings warning + 1.04 0.01 Positive forecast + 0.45 0.16 Negative forecast - -0.32 0.44 Avg. tenure - -0.05 0.26 Busy + -0.05 0.82 Independent - -0.92 0.37 Audit meetings - -0.16 0.35 Independent audit - 0.74 0.19 Market cap. + 0.72 0.00 Turnover + 2.02 0.00 Min. return - -4.05 0.00 HiTech ? -0.54 0.12 PseudoR2 0.44 N 229
Note: Variable definitions are in the Appendix. The results are for a logistic regression estimated for the post-PSLRA period. Errors are clustered by three-digit SIC code. Allpvalues are two-sided.
not significant at conventional levels. Coefficient estimates on positive
forecast and negative forecast are insignificant, as are those on the
governance variables. All three of the damages variables,turnover,market cap., andabnormal min.return, are significant in the predicted direction. Finally,hitechis negative and insignificant, indicating that conditional on other lawsuit determinants, high-technology firms are no more likely to be sued than other firms.
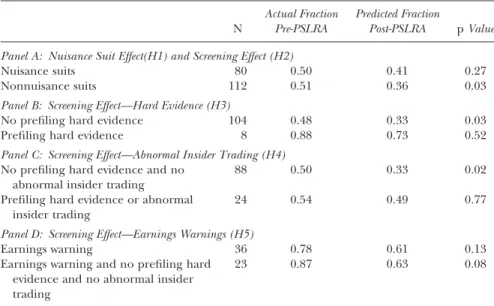
Table 6 presents the results of statistical tests comparing the actual fraction of certain types of lawsuits in the pre-PSLRA period with the fraction the post-PSRLA litigation model predicts would be sued (Steps 2 and 3 in the above methodology).21 Somewhat surprisingly, the findings in Panel A do
21The actual fraction is determined using the matched lawsuit-control sample. Thus, for
com-parability, the predicted fraction is determined using the unweighted logit estimation of the lawsuit prediction model reported in Table 5. As noted earlier, the sample contains a higher proportion of sued than nonsued firms. Calculating the predicted fraction based on a weighted Table 6: Tests of Screening Effect and Nuisance Suit Effect for Lawsuit Filings N Actual Fraction Pre-PSLRA Predicted Fraction Post-PSLRA pValue Panel A: Nuisance Suit Effect(H1) and Screening Effect (H2)
Nuisance suits 80 0.50 0.41 0.27
Nonnuisance suits 112 0.51 0.36 0.03
Panel B: Screening Effect—Hard Evidence (H3)
No prefiling hard evidence 104 0.48 0.33 0.03
Prefiling hard evidence 8 0.88 0.73 0.52
Panel C: Screening Effect—Abnormal Insider Trading (H4)
No prefiling hard evidence and no abnormal insider trading
88 0.50 0.33 0.02
Prefiling hard evidence or abnormal insider trading
24 0.54 0.49 0.77
Panel D: Screening Effect—Earnings Warnings (H5)
Earnings warning 36 0.78 0.61 0.13
Earnings warning and no prefiling hard evidence and no abnormal insider trading
23 0.87 0.63 0.08
Note: The predicted fraction of lawsuit filings is based on estimation of the logistic regression model reported in Table 5. A lawsuit is classified as nonnuisance if the settlement amount is greater than 0.5 percent of the firm’s market value 10 days prior to the end of the class period.
pvalue is for ac2test of the difference between the 2¥2 classification based on (1) the number
not support a nuisance suit effect as predicted in Hypothesis 1. The actual fraction of nuisance suits is 50 percent pre-PSLRA. Although our prediction model suggests that only 41 percent of these suits would have been filed under the PSLRA regime, the difference is not significant. These nuisance suits, of course, are the ones that Congress sought to deter by adopting the PSRLA. We do find, however, evidence of a screening effect, consistent with Hypothesis 2. Specifically, the actual fraction of nonnuisance suits is 51 percent in the pre-PSLRA period while our prediction model suggests that only 36 percent of these firms would have been sued under the post-PSLRA regime, significant at the 0.03 level. Thus, the PSLRA is screening out claims with some indicia of merit, not just claims that would have been deemed frivolous nuisance suits under the prior rules.
The remaining panels in Table 6 investigate which types of nonnui-sance claims are being screened by the PSLRA. Panel B provides evidence supporting the hard evidence hypothesis (Hypothesis 3). Of the sample of 112 nonnuisance firms in the pre-PSLRA period, 104 lacked prefiling hard evidence of fraud; nonetheless, 48 percent were sued. Applying the PSLRA prediction model, however, only 33 percent of these firms would have been sued under the post-PSLRA regime. Thus, a significant fraction of nonnui-sance suits lacking prefiling hard evidence of fraud filed in the pre-PSLRA period would not have been filed in the post-PSLRA period. In contrast, we find no significant difference between the actual and predicted incidence of suits with prefiling hard evidence of fraud, although this finding should be interpreted cautiously because of the small number of observations (eight) in this analysis. Taken together, the results in Panel B suggest that plaintiffs’ lawyers require more objective evidence of fraud before they are willing to file suit under the more rigorous standards of the PSLRA.
Panel C of Table 6 shows the screening effect persists if we consider nonnuisance firms with either abnormal insider trading or prefiling hard evidence of fraud, consistent with Hypothesis 4. Of the 88 firms in the nonnuisance sample that lacked prefiling hard evidence and abnormal
logit estimation, however, will naturally produce a much lower fraction, presenting an invalid comparison of the pre- and post-PSLRA periods and biasing in favor of rejecting the null hypothesis. In untabulated sensitivity analysis, we find that estimating a weighted logit model of the lawsuit prediction model, where we weight each observation by the inverse of the probability of its inclusion in the sample, as reported in Table 1, Panel A, yields qualitatively similar results. We also estimate an unweighted conditional logit model, as in JNP, with no change in infer-ences. Conditional logistic regression explicitly controls for the matched-pair nature of the data and corrects for possible correlated omitted variables bias due to the matching procedure.
insider trading, our model predicts that only 33 percent would have been sued under the PSLRA regime, compared to the 50 percent actually sued in the pre-PSLRA regime. This difference is significant at the 0.02 level. The predicted incidence of lawsuit filing for firms with either prefiling hard evidence or abnormal insider trading is also lower than the actual incidence, but this difference is insignificant (pvalue=0.77).
Finally, the results in Table 6 also support the earnings warning hypothesis (Hypothesis 5). Specifically, Panel D shows a significantly reduced probability of a suit for nonnuisance claims based on an earnings warning in the absence of prefiling hard evidence or abnormal insider trading. Of the 23 firms in our nonnuisance sample that issued an earnings warning without such evidence, 87 percent were sued in the pre-PSLRA period. This compares to a predicted incidence of 63 percent in the post-PSLRA period, a difference that is significant at the 0.08 level. There is also a reduced probability of a suit for nonnuisance claims based on an earnings warning regardless of prefiling hard evidence, but this difference is not significant at conventional levels (pvalue=0.13).
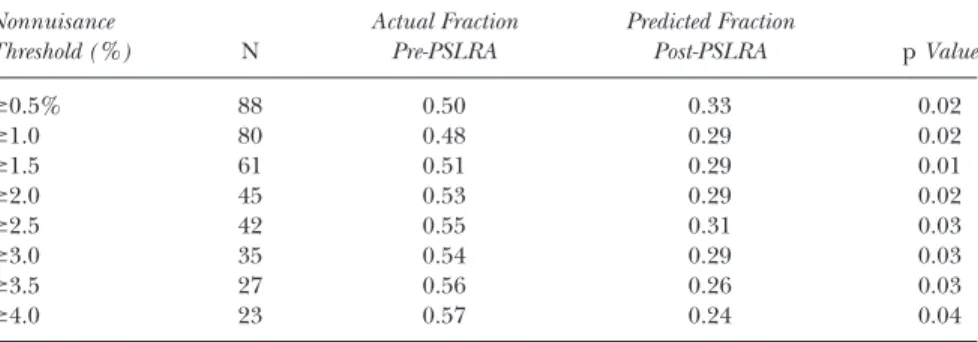
Taken together, the results reported in Table 6 provide evidence con-sistent with the PSLRA screening out litigation that would have been deemed meritorious under the pre-PSLRA standards.22It is possible, however, that we have set the definition of nonnuisance settlements too low. For example, if we underestimated defense and distraction costs, the nonnuisance threshold of 0.5 percent of market value would be higher. As a sensitivity check, we replicate the analysis in Table 6 using a series of increasingly higher cutoffs for the nonnuisance threshold. The results are presented in Table 7 for the Abnormal Insider Trading Hypothesis (Hypothesis 4). We find a lower pre-dicted incidence of litigation under the PSLRA for firms lacking prefiling hard evidence and abnormal insider trading up to a nonnuisance threshold of 4.0 percent of market value. Thus, our conclusion that the PSLRA screens out suits that would have been deemed meritorious under the pre-PSLRA regime appears to be robust to the definition of nonnuisance suits.23
22In addition to comparing the actual fraction of certain types of lawsuits in the pre-PSLRA
period with the predicted post-PSLRA fraction, we compare the predictions generated by a pre-PSLRA model with the predicted post-PSLRA fraction. Inferences from this untabulated analysis are similar to those in Table 6.
23As a further robustness check, we use an alternative definition of nonnuisance, specifically
suits that result in a settlement of over $2 million. Grundfest (1995:742–43) adopts the rule of thumb that settlements for less than a cutoff ranging from $1.5 to $2.5 million are nuisance in
B. Lawsuit Outcomes
One explanation for the reluctance of plaintiffs’ attorneys to pursue non-nuisance litigation post-PSLRA absent prefiling hard evidence or abnormal insider trading is a possible shift in the expected outcomes of suits. Recall that Table 1, Panel D reported a higher likelihood of dismissal for suits filed post-PSLRA. To assess whether the PSLRA has a screening effect on out-comes as well as on filings, we repeat the screening analysis presented in
the sense that “the merits may not have mattered at all in the resolution of the litigation.” Although settlements under $2 million likely include both nuisance and nonnuisance suits (some of which may have settled for small amounts because the defendants lacked assets and insurance coverage), settlements over $2 million are likely to have some merit. To the extent defendants settle nuisance suits to avoid defense costs as well as possible distraction on man-agement and negative publicity, the maximum amount for which defendants will settle a nuisance claim typically will not exceed $2 million. Consistent with our main results, we find the predicted incidence of litigation is significantly lower using a $2 million cutoff, and continues to be lower up to a cutoff of $6 million, a relatively generous definition of defense costs. Because the results from this analysis are substantially similar to the results using the settlement to market capitalization ratio, we do not tabulate them.
Table 7: Tests of Robustness of Screening Effect—Abnormal Insider Trading Hypothesis Nonnuisance Threshold (%) N Actual Fraction Pre-PSLRA Predicted Fraction Post-PSLRA pValue ⱖ0.5% 88 0.50 0.33 0.02 ⱖ1.0 80 0.48 0.29 0.02 ⱖ1.5 61 0.51 0.29 0.01 ⱖ2.0 45 0.53 0.29 0.02 ⱖ2.5 42 0.55 0.31 0.03 ⱖ3.0 35 0.54 0.29 0.03 ⱖ3.5 27 0.56 0.26 0.03 ⱖ4.0 23 0.57 0.24 0.04
Note: The actual and predicted fraction of suits is determined in the following steps: (1) the pool of pre-PSLRA suit firms that satisfy the specified nonnuisance threshold, calculated as the settlement amount as a percentage of the firm’s market value 10 days prior to the end of the class period, are selected along with their corresponding matched firms; (2) only those suit and match firms in the pool that have no prefiling hard evidence and no abnormal insider trading are identified; (3) the actual fraction of pre-PSLRA suits is equal to the fraction of firms that faced a suit in the sample derived from Step (2); (4) the predicted fraction of post-PSLRA suits is equal to the mean probability of suit for the sample derived from Step (2) applying the logistic regression model from Table 5. pvalue is for a c2test of the difference between the 2¥2
classification based on (1) the number of sued versus nonsued firms and (2) the actual pre-PSLRA and predicted post-PSLRA fractions.
Table 6 using a post-PSLRA outcome model to predict the likelihood of a nonnuisance outcome for the pre-PSLRA suits if they were subject to the PSRLA regime. For this analysis, we classify a lawsuit as a dismissal if it was resolved in the company’s favor. Thus, dismissals include lawsuits that were dismissed or settled for a small fraction of the firm’s market value. As above, we consider these “nuisance” settlements, defined as a settlement of less than 0.5 percent of a firm’s market value 10 days before the end of the class period, as tantamount to a dismissal.24
The post-PSLRA settlements model has a number of differences from the filing model above. Because we are concerned with the likelihood of recovery rather than the amount of recovery, we omit the damages-related variables (market cap., turnover, and min. return). We also omit the governance variables as only secondary indicators of potential fraud, and the high-technology indicator variable, which should not influence the lawsuit outcome. In addition, we substitute hard evidence for prefiling hard evidence. Hard evidenceincludes not onlyprefiling hard evidence, but also public restatements and announcements of an SEC investigation or enforcement action related to the litigation that occurs anytime after the filing of suit up to the outcome date of the litigation. The occurrence of a restatement or SEC investigation even after the filing of suit may pressure defendants into a more generous settlement. Finally, we include an indicator variable, high volume court, which may negatively correlate with likeli-hood of success. Courts in districts with a substantial number of securities fraud class actions, such as the Southern District of New York or a district court in any of the California districts, may be more skeptical of such claims (Grundfest & Pritchard 2002).
We report the results of this regression in Table 8. We find thathard evidence correlates positively and significantly with a nonnuisance settle-ment post-PSRLA. The coefficient estimate onabnormal insider trading, however, is insignificant (pvalue=0.37). The voluntary forecast variables are generally insignificant, with the exception of positive forecast, which is positive and significant. The coefficient estimate onhigh volume courtis significant, but the sign is the opposite from the predicted direction.
24Following JNP, we do not estimate a linear model using the actual settlement amount as the
dependent variable due to the lack of data on directors and officers’ insurance coverage, which is an important determinant of the actual settlement amount.
To test for a screening effect for lawsuit outcomes, we follow a similar procedure as outlined above to test for the screening of lawsuit filings. Specifically, we use the results from the settlements model estimated in Table 8 to generate predicted probabilities of settlement, which we then compare to the actual probability of settlement in the pre-PSLRA period. The results of this analysis, presented in Table 9, show only limited evidence of a screening effect with respect to settlements. Panel A shows that the actual incidence of nonnuisance outcomes is 59 percent for the pre-PSRLA suits, whereas the predicted incidence under the post-PSRLA outcome model is 47 percent, an insignificant difference. Moreover, we do not find a significant difference when we examine cases withouthard evidence(Panel B) or suits based on anearnings warning(Panel D). We do, however, find evidence of a screening effect for outcomes when we focus on cases that lack
hard evidenceandabnormal insider trading. Specifically, Panel C shows a significantly reduced probability of a nonnuisance outcome, from 56 percent of actual pre-PSLRA suits to 39 percent predicted under the post-PSLRA regime (pvalue=0.07).
Table 8: Factors Associated with Dismissed Versus Settled Lawsuits Post-PSLRA
Variable Prediction Coefficient pValue
Constant ? 0.62 0.19
Hard evidence + 1.14 0.02
Abnormal insider trading - -0.27 0.37
Earnings warning ? -0.16 0.50
Positive forecast ? 0.74 0.02
Negative forecast ? -0.51 0.15
High volume court - 0.72 0.03
Log likelihood -199.87
Waldc2 15.3
N 230
CensoredN 114
UncensoredN 116
Note: Variable definitions are in the Appendix. The reported results are for the second stage of a two-stage Heckman model estimated for the post-PSLRA period. Stage 2 is a probit model where the dependent variable is equal to 1 for settlements greater than 0.5 percent of the firm’s market value 10 days prior to the end of the class period. Stage 1 (unreported) is a probit model for the decision to file suit:
Prob(suit)=f(Turnover, Min. Return, HiTech, Avg. Tenure, Busy, Independent, Audit Meet-ings, Independent Audit).
As with the filing analysis, we replicate the analysis in Table 9 using a series of increasingly higher cutoffs for the nonnuisance threshold. The results are presented in Table 10 for the Abnormal Insider Trading Out-comes Hypothesis. We find a significantly lower probability of a nonnui-sance settlement under the PSLRA only up to a threshold of 1.0 percent of market capitalization. We conclude that our finding of a screening effect for case outcomes is reasonably robust to alternative specifications of a nonnuisance suit, but not as robust as the screening effect for lawsuit filings. Our settlements analysis is arguably handicapped by the unavailabil-ity of data with regard to the evidence that the plaintiffs may have obtained through the discovery process, which would certainly have an impact on settlement negotiations.
VI. C
onclusion
This article documents the existence of a screening effect stemming from the Private Securities Litigation Reform Act; many suits that would have been Table 9: Tests of Screening Effect for Lawsuit Outcomes
N
Actual Fraction Pre-PSLRA
Predicted Fraction
Post-PSLRA pValue Panel A: Screening Effect
Nonnuisance suits 97 0.59 0.47 0.42
Panel B: Hard Evidence Outcomes (H6A)
No hard evidence 78 0.51 0.40 0.15
Hard evidence 19 0.90 0.77 0.37
Panel C: Abnormal Insider Trading Outcomes (H6B)
No hard evidence and no abnormal insider trading
63 0.56 0.39 0.07
Hard evidence or abnormal insider trading
34 0.65 0.61 0.80
Panel D: Earnings Warnings Outcomes (H6C)
Earnings warning 56 0.50 0.41 0.34
Earnings warning and no hard evidence and no abnormal insider trading
35 0.49 0.37 0.33
Note: The predicted fraction of nonnuisance outcomes is based on the regression model reported in Table 8. A lawsuit is classified as nonnuisance if the settlement amount is greater than 0.5 percent of the firm’s market value 10 days prior to the end of the class period.pvalue is for ac2test of the difference between the 2¥2 classification based on (1) the number of sued
deemed nonnuisance prior to the PSLRA likely would not be filed after Congress adopted the PSLRA. We find only limited evidence, however, with respect to the likelihood of a nonnuisance outcome after passage of the PSLRA. The evidence thus suggests the PSLRA has a much stronger effect on the likelihood of filing suit than it does on the outcomes of suits that are filed.
We do not find evidence of a significant filtering effect for suits that settled for nuisance value or were dismissed pre-PSLRA; thus, we cannot reject the hypothesis that those cases would still be filed post-PSLRA. Overall, our findings do not show that Congress’s efforts to discourage frivolous litigation have succeeded; indeed, we find stronger evidence that the PSRLA has succeeded in discouraging securities fraud class actions that would likely have been deemed meritorious prior to the PSLRA. Reducing the incidence of such class actions could come at the price of reduced deterrence. Our finding of a screening effect at the filing stage cannot tell us whether the benefits to companies of reduced exposure to litigation outweigh any dimi-nution in deterrence. To answer that question would require a measure of the marginal deterrence provided by securities fraud class actions; finding such a measure is an important task for future research on the effects of securities fraud class actions.
Based on our findings, we conclude that Congress effectively elevated the definition of merit in adopting the largely procedural requirements of Table 10: Tests of Robustness of Screening Effect—Abnormal Insider Trading Outcomes Hypothesis
Nonnuisance Threshold (%) N Actual Fraction Pre-PSLRA Predicted Fraction Post-PSLRA pValue ⱖ0.5% 63 0.56 0.39 0.07 ⱖ1.0 63 0.46 0.31 0.07 ⱖ1.5 63 0.37 0.24 0.12 ⱖ2.0 63 0.27 0.19 0.29 ⱖ2.5 63 0.25 0.16 0.19 ⱖ3.0 63 0.19 0.15 0.64 ⱖ3.5 63 0.13 0.16 0.61 ⱖ4.0 63 0.11 0.10 0.77
Note: The predicted fraction of nonnuisance outcomes is based on the regression model reported in Table 8. A lawsuit is classified as nonnuisance if the settlement amount as a percentage of the firm’s market value 10 days prior to the end of the class period is greater than the specified nonnuisance threshold. The actual fraction of pre-PSLRA suits is equal to the fraction of firms with an outcome above the nonnuisance threshold.pvalue is for ac2test of the
difference between the 2¥2 classification based on (1) the number of sued versus nonsued firms and (2) the actual pre-PSLRA and predicted post-PSLRA fractions.